Hawra’a A. Yassein*![]() | Abdul Hassan K. Al-Shukur
| Abdul Hassan K. Al-Shukur![]()
© 2025 The authors. This article is published by IIETA and is licensed under the CC BY 4.0 license (http://creativecommons.org/licenses/by/4.0/).
OPEN ACCESS
This study conducted laboratory tests to investigate the effect of the side-by-side bridge piers' shape and skewness angle on local scour. However, limited research on scouring around side-by-side bridge piers with non-uniform sediment has been published. The current study conducted twelve flume experiments to analyze local scour around three side-by-side bridge piers with different shapes (rectangular, chamfered, sharp-nosed, and lenticular) at different skew angles: 0°, 30°, and 45°. Additionally, the study investigated how local scour patterns are affected by non-uniform sediment (d50=0.873 mm), and the spacing ratio (S/Dp=2). The pier models have a steady, constant flow of Yo=5 cm with a flow rate of 12.5 L/s. Results show that pier design, particle size, skewness, and hydraulic conditions significantly affect scour depth. Regardless of the piers' shape, maximum scour depths (MSDs) occurred upstream of the bridge piers, it also indicated that as the grain size of the armor layer increased, the MSD decreased, and the results showed that the rectangular piers exhibited the greatest MSD at a skew angle of 30°, followed by chamfered, sharp-nose, and lenticular piers, respectively. When α≥45°, the scour downstream increases.
non-uniform sediment, side-by-side bridge piers, local scour, clearwater condition
It is necessary to minimize scours around the bridge piers for both safety and cost reasons. There have been attempts to reduce the scour depth around the pier [1].
The vertical configuration of the pier at the riverbed markedly affects the flow structure, causing substantial differences in the flow field according to the pier's shape, which results in various scour patterns. The primary variable in the scour process is the vortices produced by pressure differentials when the water velocity profile encounters an impediment. The scouring process transpires as a result of a complicated vortex structure. This system includes horseshoe, wake, trailing, and bow wave vortices [2]. Recently, various research has been conducted to examine the impact of various conditions on the formation of vortex systems around bridge piers. These factors can be categorized into three classifications:
(1) flow parameters, comprising approach velocity and flow depth;
(2) sediment parameters, including median size, size distribution, and sediment density;
(3) pier characteristics, comprising shape, type, and dimensions [3-5].
The geometry of the piers is a significant factor in increasing bridges' scour danger. The geometry of the pier significantly influences the development and resistance of the vortex system [6-10].
Two different possibilities involving sediment transport in the approach channel's bed:
(1) clear water, indicating the lack of sediment transport;
(2) "live bed," signifying the transport of bed material within the approach flow.
In the first condition, sediment motion is commencing, and the bed shear stress is either less than or approximately equal to the critical bed shear stress; in the second condition, the bed shear stress exceeds the critical bed shear stress. The displacement of sediment particles contributes to developing an armor layer in the scour hole surrounding the bridge piers. Consequently, the larger grains remain stationary while the finer sediment particles are moved. The larger grains obscure the finer grains during this process, subjecting the coarser grains to increased flow exposure [11] The armoring phenomenon primarily develops from a scouring process that is selective when the bed shear stress of smaller sediment particles (τ) is greater than the critical shear stress for movement (τ*c). Stabilizing scour at bridge piers can take a long time in clear-water flow conditions, particularly when the flow velocity approaches the threshold for the first sediment movement. This results from completely removing sediment particles from the scour hole and the interaction of flowing water with the pier, influenced by vortices that establish the equilibrium scour depth. When the scour depth reaches equilibrium, it no longer varies over time [12].
According to Namaee et al. [13], a set of flume experiments was conducted to investigate the local scour around four pairs of circular bridge piers with non-uniform bed materials under open channels and smooth and rough ice cover conditions, and the results showed that the MSD decreased with an increase in the grain size of the armor layer.
As the study conducted by Xu et al. [14] suggests expressions for the dragging force and uplift force coefficients are suggested based on the process of non-uniform sediment incipient motion, specifically for non-uniform bed material exposure and close alignment conditions. The formula for the incipient velocity of non-uniform sediment was subsequently established. The formula structure is demonstrated to be rational, indicating that fine particles of non-uniform sediment are more challenging to mobilize than uniformly sized particles, whereas coarser particles are more readily set into motion compared to their uniform counterparts.
Numerous investigations using significant laboratory tests have been conducted to investigate pier scour. In most of these investigations, the scour at the pier was investigated under conditions of uniform sediment. A literature study revealed insufficient research on scour at side-by-side piers, and inadequate studies have been published about non-uniform sediment conditions with different pier shapes.
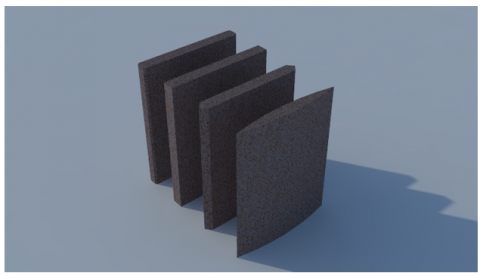
The objective of this study is to investigate the effect of different pier designs (rectangular, chamfered, sharp-nose, and lenticular piers) at varying skew angles (α=0°, 30°, and 45°) under specific flow conditions. The hypothetical dimensions for the piers are h=50 cm, L=40 cm, and Dp=4.5 cm. The pier models have a steady constant flow of Yo=5 cm and a fixed length-to-width ratio of 8.88. The pier diameter is carefully selected to avoid the effect of contraction on scour depth and to reduce blockage effects, often termed sidewall effects. Three side-by-side bridge piers were positioned at the flume's centerline when the flow direction was vertical or skewed to the pier alignment. Figure 1 shows pier models for all shapes.
Figure 1. The piers model
This section describes the methodology used in the experimental program in the current investigation.
3.1 Bed materials
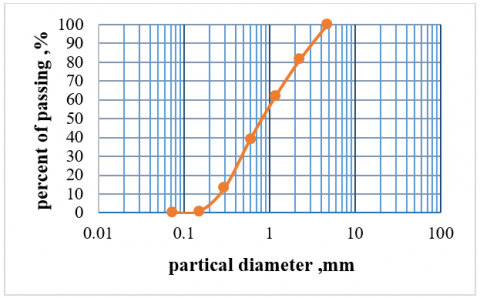
The properties of the particles influence the scour depths. Each experiment used cohesive-less (i.e., non-uniform) sediment as the bed material to achieve the maximum scour depth (MSD). To determine the types and properties of sand used during this study, a soil-grading test (sieve analysis) was carried out [15], as shown in Figure 2. The total weight of the dray sand sample is 1212 grams, and the specifications of the sand used are shown in Table 1.
Figure 2. Grain size distribution curve
Table 1. Specification of bed material
|
Parameter |
Value |
|
d50 |
0.873 mm |
|
ρ |
1637 kg/m3 |
|
σg |
2.81 (non-uniform sediment) |
where, d50 (mean particle size) represents the grain size at 50% passing, ρ denotes the density of the sediment, and σg (Geometric standard deviation) is calculated as $\sqrt{\frac{d 84}{d 16}}$, with d84 being the grain size at 84% passing and d16 the grain size at 16% passing, and the geometric standard deviation (σg>1.3) for non-uniform sediments.
The initial velocity of coarse particles in non-uniform sediment is lower than that of uniform sediment with identical particle sizes. In comparison, the initial velocity of finer particles in non-uniform sediment is higher than that of uniform sediment with the same particle size.
3.2 Experimental setup
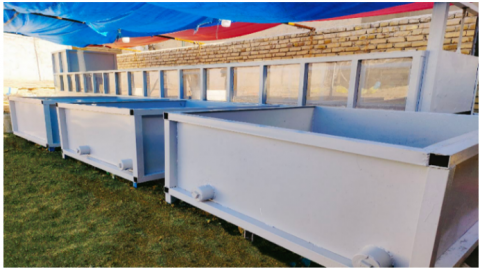
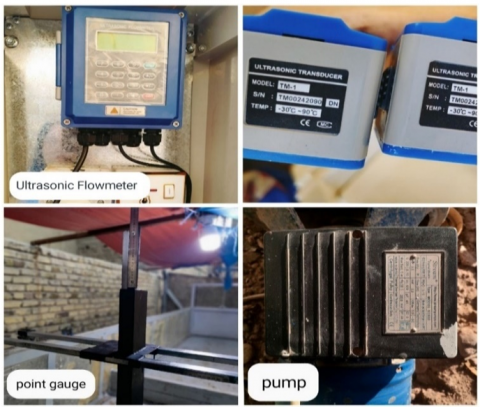
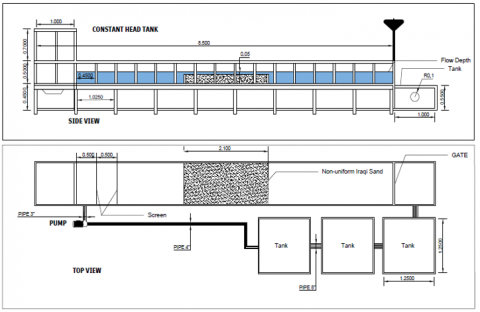
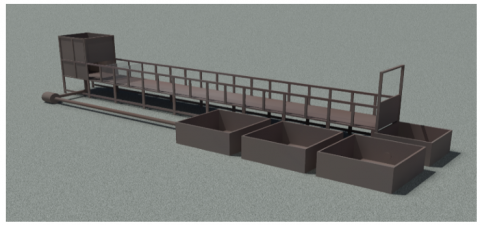
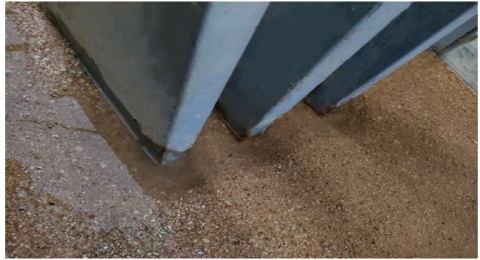
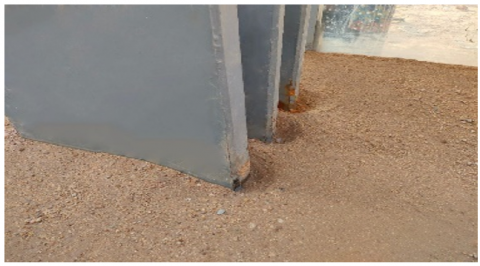
The experiments were performed in Babylon at a private hydraulic laboratory. The flume's walls consist of glass and are encased in steel framing. The smooth side walls have dimensions of 8.5 m in length, 0.98 m in breadth, and 0.6 m in depth. It is not inclined horizontally. The work section measures 2.1 m in length and 0.204 m in depth. The segment, located 2.5 m upstream from the flume inlet, has non-uniform material. An overhead tank upstream of the flume takes water from the main reservoir tank. Baffles, consisting of two screens, are positioned every 50 cm from the flume entry to facilitate a smooth transition onto the bed area. A wooden gate suppressor was also utilized at the upstream approach segment. A rectangular gate measuring 0.98×0.6 m has been built at the flume's exit to equilibrate the water level upstream and downstream and to manage flow velocity. Subsequently, the used water from the flume is discharged into the exit tank. The pump utilizes a 4-inch diameter pipeline adjacent to the flume to convey water from the reservoir at the downstream end to the upstream end of the flume. Four reservoir tanks exist, three with dimensions of 1.25×1.25×0.5 m adjacent to the flume and one in the outlet flume measuring 1×0.98×0.55 m, separated by a rectangular gate. The flow rate was delivered through a 3-inch-diameter pipe by a centrifugal pump positioned at the downstream terminus of the flume. Water discharge has been measured utilizing an ultrasonic flow meter; all depths are recorded with a transportable point gauge exhibiting an accuracy of +/- 0.1 mm, positioned on a brass rail at the upper edge of the flume, as illustrated in Figure 3.
(a)
(b)
(c)
(d)
Figure 3. The experimental flume
3.3 Experiment procedures
1). Initially, a base with the required measurements (distances between piers) was made and fixed at the center of the work portion, and the models were installed at the required spacing and skew angles (either in a vertical orientation or at a skewed angle). It can be noticed that changes in pier position and direction may cause important changes in the flow pattern.
2). The bed material, composed of sand with a mean grain size (d50=0.873 mm), was placed in the work section. The flume was leveled with a scraper, and the initial bed heights were confirmed at random locations using a point gauge to guarantee precise leveling. The sand layer measures 20.4 cm in thickness.
3). The gate is closed downstream. The pump started operating as its velocity progressively escalated till the chosen flow rate was attained. The tailgate was looked at to preserve the correct depth of the flow (Y=5) centimeters by the point gauge and the ruler was fixed at the sidewall of the flume at the upstream and downstream flume and the flow depth is constant for all tests.
4). The discharge was measured using an ultrasonic flowmeter (Q=12.5 L/sec).
5. During each test, a timer was used to record time, Over the first hour, the MSD was documented every few minutes. The initial three hours of every test are especially important because many readings are needed to correctly determine the early stage of the MSD vs. time graph. When the time limit ended (after 24 h), the flow was halted, and the flume was gradually emptied to prevent scour hole changes.
6). After leaving the sand to dry, the location and dimensions of the MSD point were recorded by the point gauge, and after changing the skew angle, the sand is re-leveled, and the procedures are reiterated for each shape.
3.4 Limitations
1). The width of the flume must be not less than 10 times the width of the pier.
2). Clear water conditions when $([V-(V a-V c)]) / V c<1)$ (for non-uniform sediment).
3). The flow rate was 12.5 L/s.
4). The equilibrium scour depth was measured at 24 h.
5). The flow was subcritical.
6). When the spacing ratio $G / D_p<0.25$, the side-by-side piers acted as a unique body.
The MSD of the scour holes for each experimental run was measured and compared for the four shapes of side-by-side bridge piers when the piers were vertical or skewed ( $\alpha=0^{\circ}$, $30^{\circ}$, and $45^{\circ}$ ). The corresponding discharge was 12.5 liters per second. The approach velocity, V , critical velocity, $\mathrm{V}_{\mathrm{c}}$, and armor peak velocity are applicable only for $\sigma_{\mathrm{g}}>1.3$ (nonuniform sediments). The flow density, $\mathrm{V}_{\mathrm{a}}$, must satisfy the condition $\left[\mathrm{V}-\left(\mathrm{V}_{\mathrm{a}}-\mathrm{V}_{\mathrm{c}}\right)\right] / \mathrm{V}_{\mathrm{c}}<1$ for non-uniform sediments with clear water scour conditions present. Additionally, and Froude number, $\mathrm{F}_{\mathrm{r}}$, is relevant, considering the characteristics of the sediment (sand $\mathrm{d}_{50}=0.873 \mathrm{~mm}, \mathrm{~d}_{50 \mathrm{a}}=1.267 \mathrm{~mm}$ ), approach flow depth $\mathrm{Y}_{\mathrm{O}}=0.05 \mathrm{~m}$ its constant for all tests, pier diameter $\left(\mathrm{D}_{\mathrm{p}}\right)$, and pier spacing (S).
$d_{50 a}=\frac{d_{\max }}{1.8}$
dmax=maximum particle size
Critical shear velocities in armored beds are obtained from Eqs. (1) and (2) [2].
$0.1 \mathrm{~mm}<d_{50 a}<1 \mathrm{~mm}$ for:
$V * c a=0.0115+0.0125 d_{50 a}^{1.4}$ (1)
$1 \mathrm{~mm}<d_{50 a}<100 \mathrm{~mm}$ for:
$V * c a=0.0305 d_{50 a}^{0.5}-0.0065 d_{50 a}^{-1}$ (2)
The mean critical velocity on the armored bed is:
$\frac{V c}{V * c a}=5.75 \log \left[5.53 \frac{Y o}{d 50 a}\right]$ (3)
$V_{c a}^*$ : mean critical velocity in armored bed.
Finally, $V a=0.8 V c a$.
$\frac{[V-(V a-V c)]}{V c}<1$ (for non-uniform sediment) (4)
Then $Q=V A$.
Ballio et al. [16] indicated that contraction scour is negligible for B/Dp ≥10. Consequently, it can be confidently stated that the current study's contraction effects were absent. Investigate the depths around three rectangular, chamfered, sharp-nosed, and lenticular side-by-side bridge piers aligned in a single row, each with a width of 45 mm, with a spacing-to-width ratio of S/Dp=2. Following 24 hours of continuous testing, the MSD is situated directly in front of the piers.
4.1 Time variation of scour depth at bridge pier shape
Figure 4 shows the spacing ratio of rectangular, chamfered, sharp-nosed, and lenticular side-by-side bridge piers (S/Dp=2), with three piers vertically to the flow direction (α=0°).
(a)
(b)
(c)
(d)
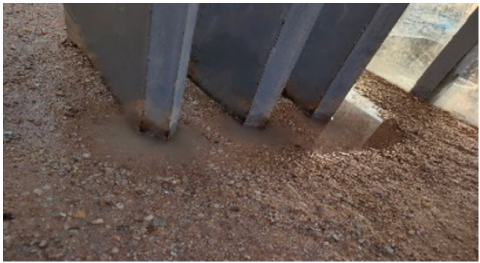
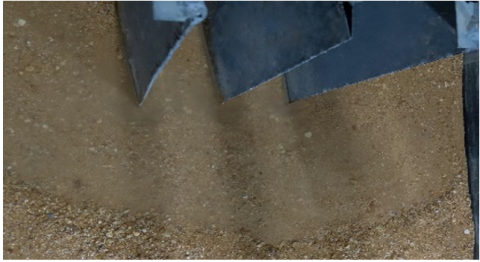
Figure 4. The experiment details when S/Dp=2, and α=0° for (a): Rectangular piers, (b): Chamfered piers, (c): Sharp-nose piers, and (d): Lenticular piers
The extensive exposed region in front of the rectangular piers indicates that the horseshoe vortex for each pier is large compared to other shapes, resulting in increased scouring depth from chamfered, sharp-nose, and lenticular piers, respectively. The MSD is situated immediately upstream of the piers and reaches around two-thirds of the upstream side of the piers. The central pier P2 showed a decreased maximum scour depth compared to the lateral piers. The MSDs at the P1 and P3 bridge piers were almost identical.
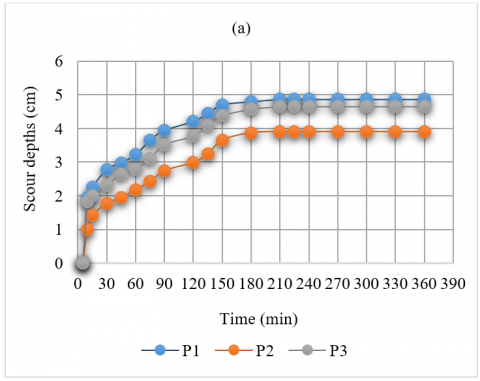
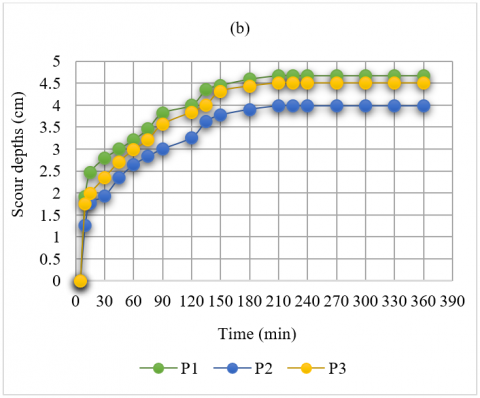
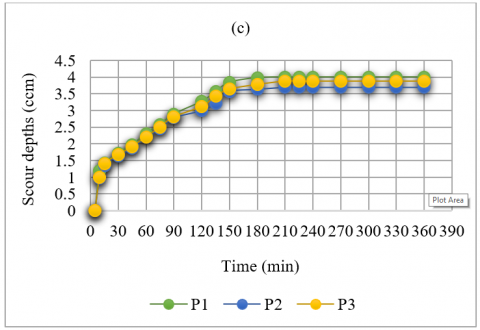
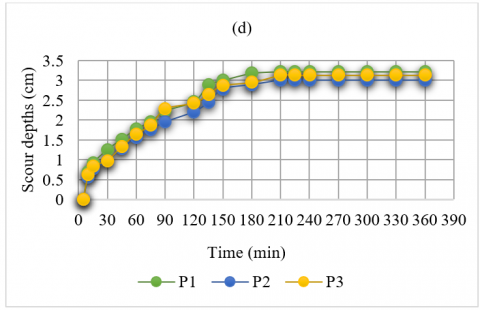
Figure 5 illustrates the temporal development of scour depth at the designated locations for rectangular, chamfered, sharp-nose, and lenticular configurations. For each pier configuration, the scour depth first increased, reaching a maximum value, and observations suggest that around 75-90% of this MSD was attained within the first three hours of the experiment.
Figure 5. Scour depth variation with time when (α=0°, and S/Dp=2) for (a): Rectangular piers, (b): Chamfered piers, (c): Sharp-nose piers, and (d): Lenticular piers
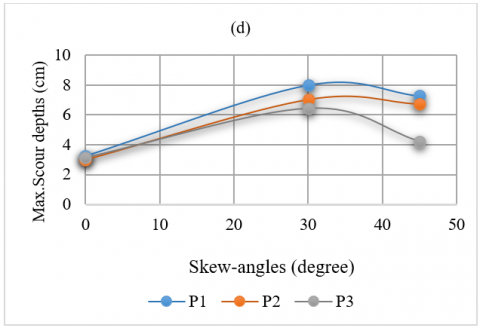
4.2 Variation of MSD with pier shape and skew-angle
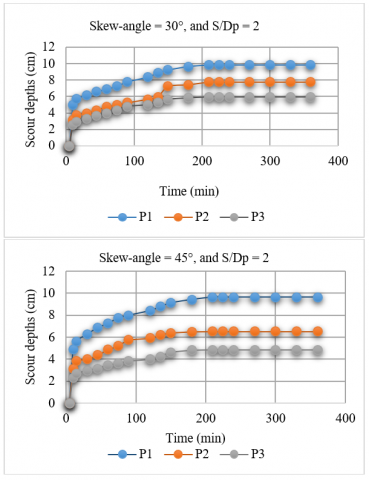
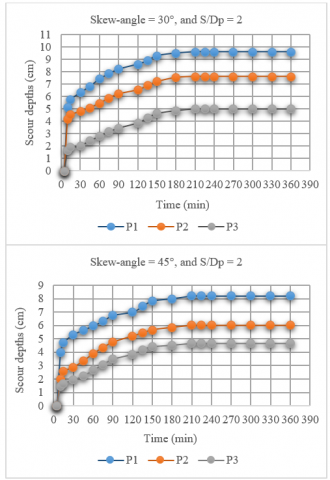
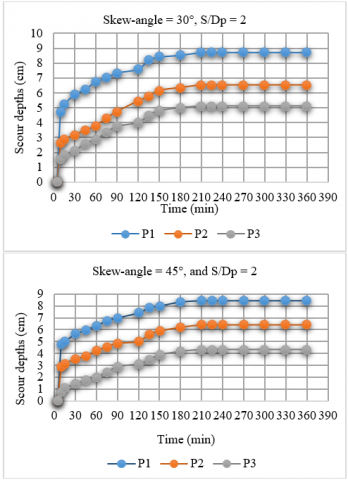
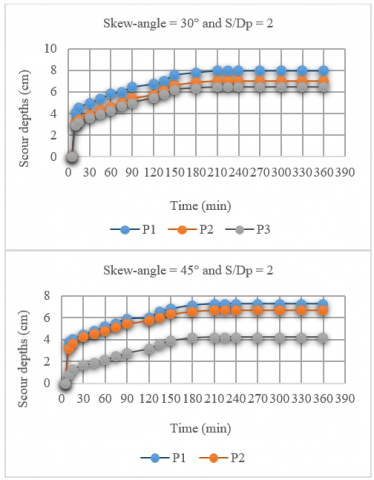
The influence of skewness angles 30° and 45° on scouring depth for all applied pier shapes has been investigated using the methodology outlined in previous investigations. The findings obtained are depicted in Figure 6 when S/Dp=2.
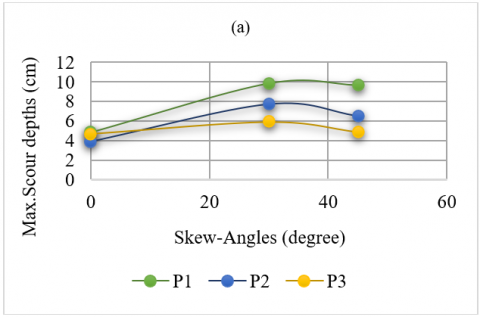
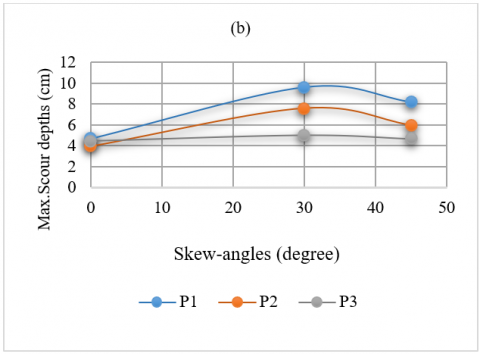
MSD is located at the P1, P2, and P3 corners, respectively, adjacent to the flume wall. The scour hole stretches nearly the entire upstream side of P1. The maximum scour depth (MSD) for rectangular shapes exceeds that of other piers at a 30-degree angle. However, the skew angle (0°-30°) has a larger MSD than that at 45 degrees as shown in Figure 7.
(a)
(b)
(c)
(d)
Figure 6. Scour depth variation with time when (α=30°, and 45° with S/Dp=2) for (a): Rectangular piers, (b): Chamfered piers, (c): Sharp-nose piers, and (d): Lenticular piers
Figure 7. Comparison of MSD and skewness angle with S/Dp=2) for (a): Rectangular piers, (b): Chamfered piers, (c): Sharp-nose piers, and (d): Lenticular piers
Table 2. Summary of experimental data for the series of experiments
|
Run |
Pier-Shape |
α° |
Q (l/s) |
Yo (m) |
V (m/s) |
Vc (m/s) |
Va |
$\frac{[V-(V a-V c)]}{V c}$ |
Max. Scour Depth (cm) |
Fr |
||
|
P1 |
P2 |
P3 |
||||||||||
|
1 |
Rectangular |
0° |
12.5 |
0.05 |
0.258 |
0.392 |
0.314 |
0.85 |
4.86 |
3.9 |
4.65 |
0.364 |
|
2 |
Rectangular |
30° |
12.5 |
0.05 |
0.258 |
0.392 |
0.314 |
0.85 |
9.83 |
7.76 |
5.92 |
0.364 |
|
3 |
Rectangular |
45° |
12.5 |
0.05 |
0.258 |
0.392 |
0.314 |
0.85 |
9.65 |
6.53 |
4.84 |
0.364 |
|
4 |
Chamfered |
0° |
12.5 |
0.05 |
0.258 |
0.392 |
0.314 |
0.85 |
4.67 |
3.98 |
4.5 |
0.364 |
|
5 |
Chamfered |
30° |
12.5 |
0.05 |
0.258 |
0.392 |
0.314 |
0.85 |
9.62 |
7.62 |
5 |
0.364 |
|
6 |
Chamfered |
45° |
12.5 |
0.05 |
0.258 |
0.392 |
0.314 |
0.85 |
8.2 |
6 |
4.68 |
0.364 |
|
7 |
Sharpe-nose |
0° |
12.5 |
0.05 |
0.258 |
0.392 |
0.314 |
0.85 |
4 |
3.7 |
3.88 |
0.364 |
|
8 |
Sharpe-nose |
30° |
12.5 |
0.05 |
0.258 |
0.392 |
0.314 |
0.85 |
8.73 |
6.52 |
5.12 |
0.364 |
|
9 |
Sharpe-nose |
45° |
12.5 |
0.05 |
0.258 |
0.392 |
0.314 |
0.85 |
8.45 |
6.4 |
4.31 |
0.364 |
|
10 |
Lenticular |
0° |
12.5 |
0.05 |
0.258 |
0.392 |
0.314 |
0.85 |
3.22 |
3 |
3.13 |
0.364 |
|
11 |
Lenticular |
30° |
12.5 |
0.05 |
0.258 |
0.392 |
0.314 |
0.85 |
7.98 |
7 |
6.43 |
0.364 |
|
12 |
Lenticular |
45° |
12.5 |
0.05 |
0.258 |
0.392 |
0.314 |
0.85 |
7.25 |
6.7 |
4.22 |
0.364 |
Results showed that the rectangular piers experienced the maximum scour depths of 9.83 cm, 7.76 cm, and 5.92 cm for P1, P2, and P3, respectively, at α=30°.
The collected data shows that all investigated criteria significantly influence the scour depth. Table 2 illustrates that the lenticular piers most effectively resist local scour. Furthermore, utilizing lenticular piers and minimizing the skew angle and flow intensity helps reduce the scour depth. Furthermore, advanced sensing technologies, such as electromagnetic sensors, can assess the scouring depth [17-19].
This study investigated comparisons between various pier shapes to analyze the local scour process, the initiation of sediment particle motion, and the MSD around three side-by-side bridge piers rectangular, chamfered, sharp-nosed, and lenticular through 12 experiments conducted in a large-scale flume using non-uniform sediment. The results of the current investigation allow for the following conclusions:
1). The rectangular design exhibits the larger MSD because of its large exposed area when $\left(\alpha=30\right.$ and $\left.\mathrm{S} / \mathrm{D}_{\mathrm{p}}=2\right)$. In contrast, the lenticular piers represent a better shape because it has a small exposed area, and the geometry of the lenticular piers substantially mitigates the formation of horseshoe vortices, thereby generating wake vortices and consequently reducing scour depth. This phenomenon may elucidate why lenticular piers exhibit superior performance regarding scour depth [20], as it reduces the scour depth by 30% relative to rectangular designs.
2). The skew angle and shape of the pier influence both the beginning of the scour rate, and the equilibrium scour depth.
3). Upstream of the piers, the horseshoe vortex generated heightened bed shear stress and increased velocity at the pier edges, unlike the downstream region. As a result, the greatest scour depth was seen upstream of the piers. In contrast, sediment deposition transpired downstream of the piers as a result of the wake vortex; however, when the skew angle is ≥45°, the scour depth downstream begins to increase.
4). The scour profiles demonstrate that the skew angle influences the horizontal extension (lengthening along the pier cross-section's transverse axis), the scour hole's vertical deepening around the pier and the longitudinal deposition of sand downstream.
5). Relative size (Dp/d50) and relative depth (Y/Dp) influence clear-water local scour's maximum equilibrium scour depth.
6). The results indicate that the MSD decreased with an increase in the grain size of the armor layer.
|
α |
Pier alignment angle (Skew angle) |
|
d50 |
Mean particle size |
|
d50a |
Armor peak mean particle size |
|
Dp |
Pier diameter |
|
ds |
Scour depth |
|
Fr |
Froude number |
|
h |
Pier height |
|
L |
Pier length |
|
Q |
Flow discharge |
|
S |
Pier spacing |
|
V |
Mean flow velocity |
|
Va |
Armor Peak Velocity |
|
Vc |
Critical velocity |
|
Yo |
Approach flow depth |
|
ρ |
Density |
|
σg |
Geometric standard deviation |
[1] Habib, I.A., Mohtar, W.H.M.W., Elsaiad, A., El-Shafie, A. (2018). Nose-angle bridge piers as alternative countermeasures for local scour reduction. The Baltic Journal of Road and Bridge Engineering, 13(2): 110-120. https://doi.org/10.7250/bjrbe.2018-13.405
[2] Lee, C.H., Xu, C., Huang, Z. (2019). A three-phase flow simulation of local scour caused by a submerged wall jet with a water-Air interface. Advances in Water Resources, 129: 373-384. https://doi.org/10.1016/j.advwatres.2017.07.017
[3] Salamatian, M., Zarrati, A.R., Zokaei, S.A., Karimaee, M. (2013). Study on scouring around bridge piers protected by collar using low density sediment. International Journal of Civil Engineering, 11(3): 199-205.
[4] Singh, U.K., Ahmad, Z., Kumar, A. (2017). Turbulence characteristics of flow over the degraded cohesive bed of clay-silt–sand mixture. ISH Journal of Hydraulic Engineering, 23(3): 308-318. https://doi.org/10.1080/09715010.2017.1313144
[5] Pandey, M., Ahmad, Z., Sharma, P.K. (2015). Flow-characteristics around circular pier model. In Proceedings of the HYDRO’15 International Conference, IIT ROORKEE, Roorkee, India, 17-19.
[6] Dargahi, B. (1990). Controlling mechanism of local scouring. Journal of Hydraulic Engineering, 116(10): 1197-1214. https://doi.org/10.1061/(ASCE)0733-9429(1990)116:10(1197)
[7] Yanmaz, A.M., Cicekdag, O. (2001). Composite reliability model for local scour around cylindrical bridge piers. Canadian Journal of Civil Engineering, 28(3): 520-535. https://doi.org/10.1139/l01-009
[8] Zarrati, A.R., Gholami, H., Mashahir, M.B. (2004). Application of collar to control scouring around rectangular bridge piers. Journal of Hydraulic Research, 42(1): 97-103. https://doi.org/10.1080/00221686.2004.9641188
[9] Fael, C., Lança, R., Cardoso, A. (2016). Effect of pier shape and pier alignment on the equilibrium scour depth at single piers. International Journal of Sediment Research, 31(3): 244-250. https://doi.org/10.1016/j.ijsrc.2016.04.001
[10] Vijayasree, B.A., Eldho, T.I., Mazumder, B.S., Ahmad, N. (2019). Influence of bridge pier shape on flow field and scour geometry. International Journal of River Basin Management, 17(1): 109-129. https://doi.org/10.1080/15715124.2017.1394315
[11] Mao, L., Cooper, J.R., Frostick, L.E. (2011). Grain size and topographical differences between static and mobile armour layers. Earth Surface Processes and Landforms, 36(10): 1321-1334. https://doi.org/10.1002/esp.2156
[12] Yang, Y., Melville, B.W., Macky, G.H., Shamseldin, A.Y. (2020). Temporal evolution of clear-water local scour at aligned and skewed complex bridge piers. Journal of Hydraulic Engineering, 146(4): 04020026. https://doi.org/10.1061/(ASCE)hy.1943-7900.0001732
[13] Namaee, M.R., Sui, J., Wu, P. (2020). Experimental study of local scour around side-by-side bridge piers. Current Practice in Fluvial Geomorphology: Dynamics and Diversity, 9. https://doi.org/10.5772/intechopen.86369
[14] Xu, H.T., Lu, J.Y., Liu, X.B. (2008). Non-uniform sediment incipient velocity. International Journal of Sediment Research, 23(1): 69-75. https://doi.org/10.1016/S1001-6279(08)60006-2
[15] Arneson, L.A., Zevenbergen, L.W., Lagasse, P.F., Clopper, P.E. (2012). Hydraulic engineering circular no. 18: Evaluating scour at bridges. US Department of Transportation.
[16] Ballio, F., Teruzzi, A., Radice, A. (2009). Constriction effects in clear-water scour at abutments. Journal of Hydraulic Engineering, 135(2): 140-145. https://doi.org/10.1061/(ASCE)0733-9429(2009)135:2(140)
[17] Zarrati, A.R., Gholami, H., Mashahir, M.B. (2004). Application of collar to control scouring around rectangular bridge piers. Journal of Hydraulic Research, 42(1): 97-103. https://doi.org/10.1080/00221686.2004.9641188
[18] Fael, C., Lança, R., Cardoso, A. (2016). Effect of pier shape and pier alignment on the equilibrium scour depth at single piers. International Journal of Sediment Research, 31(3): 244-250. https://doi.org/10.1016/j.ijsrc.2016.04.001
[19] Vijayasree, B.A., Eldho, T.I., Mazumder, B.S., Ahmad, N. (2019). Influence of bridge pier shape on flow field and scour geometry. International Journal of River Basin Management, 17(1): 109-129. https://doi.org/10.1080/15715124.2017.1394315
[20] Helmy, A., Ali, M., Ahmed, H. (2017). An experimental study of local scour around piers in the curved channels. Journal of Multidisciplinary Engineering Science and Technology, 4(1): 6448-6453.