Remzi Smajli![]() | Nakije Kida*
| Nakije Kida*![]() | Julinda Morina
| Julinda Morina![]() | Vesa Morina
| Vesa Morina![]() | Florije Miftari
| Florije Miftari![]() | Medain Hashani
| Medain Hashani![]() | Albana Pasjaqa
| Albana Pasjaqa![]()
© 2025 The authors. This article is published by IIETA and is licensed under the CC BY 4.0 license (http://creativecommons.org/licenses/by/4.0/).
OPEN ACCESS
This study aims to analyze the impact of key economic factors on the motivation of foreign investors in Kosovo, focusing on indicators such as exchange rate (ER), inflation (INF), interest rates (IR), access to credit (AC), competition (CO), banking services and e-banking (E-BBS), economic growth (EGr), and taxes (Tax). Primary data were collected through a structured questionnaire randomly distributed to a sample of 148 foreign investors. The reliability and validity of the data were assessed through statistical tests such as Cronbach’s Alpha, KMO and Bartlett’s Test, as well as Principal Component Analysis (PCA) and Collinearity Statistics. For data analysis, multiple linear regression and Kendall’s Tau-b analysis were applied using the SPSS 25 statistical software package. The findings highlight that Economic Growth, strongest positive impact (B=6.497, p<0.001), indicating that GDP growth enhances investor confidence. ER, significant positive effect (B=2.584, p =0.009), highlighting the importance of currency stability. INF Rate, notable positive influence (B=2.734, p=0.019), suggesting that predictable INF is acceptable to investors. AC, strong negative effect (B=-5.575, p<0.001), emphasizing that limited credit access deters investment. IR, marginal negative impact (B=-3.144, p=0.055), implying that higher IR may reduce investment motivation. The model explains 30.8% of the variability in investor motivation, implying that other factors also deserve further analysis. Kendall’s tau-b analysis confirms a strong correlation between ER and AC with investor motivation, while IR and banking services show a weak correlation. In line with Dunning’s theory, location advantages–such as the ER and economic growth–play a vital role in attracting investments, while internalization advantages – such as AC–also contribute significantly. This research challenges traditional views by revealing a positive relationship between INF and foreign direct investment (FDI), offering new perspectives for policymakers. It recommends focusing on ER stability, improving AC, and undertaking structural reforms as mechanisms for boosting foreign investment in Kosovo. The original contribution of this study lies in identifying a positive link between INF and FDI, as well as highlighting less-studied factors such as ER and credit access as key elements. Additionally, it emphasizes the impact of competition and banking services, the challenges to economic growth, and the role of structural reforms and fiscal incentives in attracting new investors.
FDI, external economic environment, PCA test, modedel OLS, Kendall's Tau-b, Kosovo
Foreign direct investment (FDI) represents a fundamental pillar of the globalization process, having experienced significant growth in recent decades due to technological advancements and the liberalization of capital markets worldwide. FDI is widely regarded as a key mechanism of international capital movement, contributing to economic development, fostering integration into regional and global markets, and enhancing the competitive advantages of host countries.
This study employs Dunning's Eclectic Paradigm (the OLI framework) to analyze FDI decision-making, focusing on three core advantages that multinational enterprises (MNEs) must possess to invest abroad: Ownership (O), Location (L), and Internalization (I) advantages. Specifically, the study examines location-specific factors such as inflation stability, tax policies, and banking infrastructure, which align with the “L” component of the OLI model and highlight Kosovo’s potential to attract foreign investors.
Hymer [1], a pioneer in the theory of multinational enterprises, argued that firms engage in foreign investment primarily to reduce local competition and exploit firm-specific advantages abroad. While Hymer [1] emphasized competitive motivations; Dunning [2, 3] expanded the theoretical framework by introducing a more structured model that combines ownership, location, and internalization advantages to explain the strategic decisions of MNEs in international markets. According to the OLI paradigm, the presence of all three advantages is essential for successful FDI.
However, the theoretical foundations of FDI extend even further. Buckley [4] pointed out that the modern theory of multinational firms originates from Hymer's doctoral dissertation, completed in 1960 and published in 1979. Nevertheless, earlier contributions from scholars such as Coase [5], Kaldor [6], and Robinson [7] laid important groundwork for this field. Hymer’s work was also significantly influenced by Dunning and Rugman [8], while more recent perspectives including those of Buckley [4] have expanded the scope to a broader theory of the firm, positioning MNEs as a specific form within that larger framework.
In the modern context, Buckley [9] emphasizes that FDI remains a core strategy for multinational corporations to ensure global competitiveness. However, recent developments have introduced new challenges. According to UNCTAD [10], global FDI fell by 2% in 2023, reaching $1.3 trillion, largely due to economic slowdowns and rising geopolitical tensions. When excluding temporary fluctuations in certain European economies, the decline exceeds 10%. Investments in Sustainable Development Goal (SDG)-related sectors, particularly agriculture, food, and water, dropped by more than 10%. The report suggests that improved business facilitation and digital government solutions could enhance transparency and efficiency in the investment environment.
At the national level, Kosovo exhibits similar trends. In 2023, Kosovo's current account deficit narrowed to 7.7% of GDP, down from 10.3% in 2022, driven by a reduced goods trade deficit and an improved balance in services. However, net FDI inflows slightly decreased to 6.5% of GDP, while portfolio investments recorded net outflows [11]. Although Kosovo has experienced an average GDP growth rate of 4% over the past two decades, FDI inflows remain modest. This underscores the need for stronger investment promotion efforts and institutional reforms to better position Kosovo within the global FDI landscape [11].
Kosovo has undergone a complex economic transition, facing significant challenges throughout this process. However, international support and domestic policies have played a crucial role in improving the investment climate, particularly for FDI. Although progress has been made, Kosovo must continue to address regional competition, bureaucratic obstacles, and structural weaknesses to ensure sustainable economic growth through foreign investment.
According to the Central Bank of Kosovo [12], from 2007 to September 30, 2024, total FDI inflows in Kosovo amounted to €6,897.2 million, of which equity capital accounted for €5,925.4 million and debt instruments €913.3 million. Germany and Switzerland are the main contributors to FDI in Kosovo, with each investing over €1 billion, mainly in the real estate, financial services, and energy sectors. Other sectors such as Information and Communication Technology (ICT), infrastructure, and renewable energy also show potential for future investments. Meanwhile, FDI outflows from Kosovo have also impacted the economy, reaching €1,105.4 million, with Albania as the main recipient, followed by Germany and EU countries. Additionally, portfolio investments during this period reached €3,218.6 million, of which €2,427.6 million were in equity and investment fund shares, while €791 million were in debt instruments. In 2023 alone, Kosovo's net FDI inflows reached €816 million, marking an increase compared to the previous year [12].
Kosovo maintains a positive balance of FDI, with more inflows than outflows, creating opportunities for economic growth and the strengthening of key sectors. However, the current level of investment remains insufficient to close the capital gap, which is a central issue of this study. Therefore, attracting more foreign investment is essential for long-term development and for diversifying funding sources.
To this end, Kosovo has established a strong legal and institutional framework to attract foreign investors. The foundation of this framework lies in continuous legal reforms, including Law No. 04/L-220 on Foreign Investment, which guarantees national treatment for foreign investors in nearly all sectors [13]. In addition, Law No. 05/L-079 on Strategic Investments supports FDI by streamlining administrative procedures and providing incentives for foreign companies [14, 15]. The most recent law, Law No. 08/L-209 on Sustainable Investments, adopted in 2024, further strengthens the legal basis for attracting and protecting foreign capita [16].
These legal measures are supported by institutions such as the Kosovo Investment and Enterprise Support Agency (KIESA), whose mandate includes promoting investment, developing exports, supporting SMEs, and advancing Economic Zones [17]. In addition, the Inter-ministerial Commission for Strategic Investments and the European Investors Council in Kosovo, established in 2014, play an active role in enhancing the investment climate [18-20].
Furthermore, Kosovo has signed several key international agreements that improve its investment climate. The Stabilization and Association Agreement (SAA) with the European Union supports regulatory harmonization and economic cooperation [21, 22], while membership in CEFTA strengthens regional trade integration [23]. Additionally, double taxation avoidance agreements with several countries (Albania, Austria, Belgium, Croatia, Finland, Germany, Hungary, Ireland, Latvia, Lithuania, Luxembourg, Malta, Netherlands, North Macedonia, Saudi Arabia, Slovenia, Switzerland, Turkey, United Arab Emirates (UAE), United Kingdom (UK) create more favorable conditions for cross-border investments [24]. According to the U.S. Department of State [25], double taxation avoidance agreements with several countries create more favorable conditions for cross-border investments in Kosovo.
These efforts, together with public consultation platforms and the development of digital government solutions, make Kosovo an increasingly attractive destination for foreign investors [26].
This study applies Dunning’s Eclectic Paradigm, focusing on location-specific factors like inflation stability, taxation policies, and banking infrastructure that influence investment decisions in Kosovo. The research highlights Kosovo's potential to attract FDI and suggests future studies refine the paradigm to better reflect the evolving investment climate. Using structured questionnaires, the study gathers insights from randomly selected foreign investors across Kosovo ARBK [27].
The analysis examines the impact of variables such as exchange rates (ER), INF, interest rates (IR), access to credit (AC), and banking services on FDI. The research aims to answer two key questions:
a) Does economic stability positively affect foreign investors’ motivation in Kosovo?
b) Is there a significant correlation between economic stability and foreign investors' motivation?
These questions are addressed through two hypotheses tested using Multiple Linear Regression (MLR) to evaluate the impact of economic factors on FDI. Additionally, Kendall's Tau-b correlation coefficient analyzes the complex relationships between these factors and FDI growth in Kosovo. The study incorporates factors such as ERs, INF, IR, credit access, competition, banking services, economic growth, and taxation.
Analyzing Key Economic Factors Shaping FDI in Kosovo:
Together, these studies underline the relevance of these economic indicators in shaping Kosovo's investment climate. They provide a theoretical and empirical foundation for understanding how external capital interacts with local economic structures.
The findings of this study aim to inform policymakers, businesses, and civil society on strategies to strengthen Kosovo's economic competitiveness and attract sustainable foreign investment. The structure of the study is as follows: Section two presents the literature review, Section three outlines the methodology, Section four discusses the results, and Section five concludes with policy recommendations.
FDI is a form of investment where a foreign company or individual invests directly in a business or asset located in another country, taking control or at least a significant stake in the management of the business and this investment may include purchasing shares in a foreign company, establishing subsidiaries, or purchasing real estate and other activities that require direct involvement and commitment in the management of the business [43].
In this paper, the main theories related to the influence of macroeconomic factors on FDI include several concepts and authors who have contributed to the development of these theories. Dunning's theory [2], known as the Eclectic Paradigm or OLI, mentions three key advantages that a firm must have to invest abroad: Ownership Advantage (O), Location Advantage (L), and Internalization Advantage (I). Dunning emphasizes the importance of location factors such as INF, tax policies, and banking infrastructure that play an important role in attracting FDI, thus supporting investors' demands for a stable economic and institutional environment.
Hymer's theory [1] focuses on the competitive advantages of international firms, arguing that they invest in foreign markets to avoid local competition and to exploit advantages that cannot be realized in domestic markets. He emphasizes that foreign investment is driven by the desire to create dominant positions in international markets.
This study draws on Dunning's Eclectic Paradigm (OLI framework) to examine FDI decisions, emphasizing location-specific factors such as inflation stability, taxation policies, and banking infrastructure. These factors align with the paradigm's location advantages, showcasing Kosovo's potential to attract foreign investors.
Dunning and Hymer are two important figures in the development of the multinational enterprise (MNE) theory and have contributed to the understanding of the factors that drive the growth and international expansion of these firms.
Hymer was one of the pioneers in the theory of multinational firms. He argued that firms operating in international markets possess unique advantages, such as the ability to avoid local competition and create a dominant position. He mentioned that MNEs are motivated to invest abroad in order to spread their competitive advantages and escape from the limitations and competition of local markets [1].
Hymer's theoretical framework (Table 1) emphasizes the significance of market imperfections, firm-specific advantages, and barriers to internationalization. The variables in the study align closely with these theoretical aspects, providing a clear context for understanding the motivations of foreign investors.
Table 1. Hymer's theoretical framework and its connection to the variables in your study on the motivation of foreign investors in Kosovo
|
Theoretical Aspect by Hymer |
Description |
Connection to Study Variables |
|
Market Imperfections |
Hymer argues that firms invest abroad to avoid competition and exploit firm-specific advantages. |
CO: Your study analyzes how competition in the local market impacts the motivation of foreign investors. |
|
Firm-Specific Advantages |
Firms with specific advantages (e.g., technology, managerial skills) use these to succeed in foreign markets. |
Economic Growth (EGr): Kosovo's growing economy may serve as a pull factor for foreign investors. |
|
Barriers to Market Internationalization |
Firms invest directly to avoid transaction costs and uncertainties in international markets. |
IR: High interest rates can act as barriers for investors, influencing their decisions. |
|
Access to Local Resources |
Investors seek direct access to markets and local resources to maximize profits. |
AC: The ability to secure credit in Kosovo is a critical factor for investors' decisions. |
|
Avoidance of Domestic Competition |
Investors enter foreign markets to avoid competition in their domestic market. |
Taxes (Tax): Tax policies in Kosovo may make the market more attractive to investors seeking to avoid domestic constraints. |
|
Impact of Macroeconomic Uncertainty |
Economic and political stability in a country influences FDI flows. |
INF: Price stability in Kosovo impacts investor confidence and their motivation to invest. |
Dunning [2, 3, 44, 45] introduced the Eclectic Paradigm (OLI Theory), combining prior theories to explain why MNEs invest abroad:
- Ownership Advantage (O): Competitive assets like technology, brand, or human capital.
- Location Advantage (L): Host-country benefits like low labor costs, market access, or favorable policies.
Table 2 presents Dunning's theoretical framework (OLI paradigm) and its connection to the study variables, illustrating how ownership, location, and internalization advantages influence the motivation of foreign investors in Kosovo.
Table 2. Dunning's theoretical framework (OLI paradigm) and its connection to the variables in the study
|
Dunning's Theoretical Framework (OLI Paradigm) Dunning's (1977, 1980, 2000, 2015) |
Description |
Connection to Study Variables |
|
Ownership Advantages (O) |
Firm-specific assets such as technology, managerial skills, brand reputation, and innovation. |
Economic Growth (EGr): Investors are motivated by Kosovo's growing market potential to utilize their ownership advantages. |
|
Location Advantages (L) |
Advantages related to the host country, such as market size, infrastructure, tax incentives, and labor cost. |
Taxes (Tax): Favorable tax policies attract investors to Kosovo. CO: Investors assess competitive conditions in Kosovo. |
|
Internalization Advantages (I) |
Firms prefer to internalize operations to reduce transaction costs, protect proprietary knowledge, and improve efficiency. |
IR: High interest rates may discourage externalization, encouraging firms to operate internally. AC: The availability of credit is a key factor influencing internalization decisions. |
|
Market Opportunities |
Potential for market growth and access to regional and global markets. |
INF: Price stability ensures better market opportunities for foreign. investors. E-Banking and Banking Services (E-BBS): Reliable banking systems improve market efficiency. |
- Internalization Advantage (I): Direct control over operations to avoid risks like IP theft or inefficiencies in outsourcing.
The OLI framework highlights that MNEs need all three advantages to succeed internationally. While Hymer emphasized competitive advantages, Dunning created a structured model to explain FDI motivations and strategic decisions. Study Alignment with OLI Framework Dunning [2, 3, 44-46]:
- Ownership (O): Highlights the firm-specific advantages that foreign investors bring to Kosovo, such as expertise and technology.
- Location (L): Emphasizes Kosovo’s attractiveness as an investment destination, influenced by factors like tax policies and competitive conditions.
- Internalization (I): Explains how foreign investors aim to maximize efficiency by internalizing operations, which is affected by access to credit and interest rates.
The table effectively aligns Dunning’s OLI framework with the specific variables in study to explain the motivation of foreign investors in Kosovo.
The integration of the following studies within Dunning's OLI paradigm underscores the multifaceted nature of FDI decisions, emphasizing the significance of a favorable environment in attracting FDI. This theoretical lens enhances the relevance of Dunning’s framework, particularly for emerging economies like Kosovo, by highlighting critical determinants such as ownership advantages, location-specific factors, and internalization incentives.
Institutional theories, including those proposed by Globerman and Shapiro [47] and North [48], stress the necessity of political and economic stability for attracting FDI. A robust institutional environment mitigates risk and fosters investor confidence. These insights align with findings by Blomström et al. [49, 50], and Borensztein et al. [51], who assert that FDI promotes economic development through the transfer of technology, knowledge spillovers, and the enhancement of human capital.
Macroeconomic theories concerning exchange and interest rates further contribute to our understanding of FDI inflows. Aizenman and Noy [52] argue that ER volatility discourages FDI due to increased uncertainty. Conversely, Edwards [53] and Hermes and Lensink [54] note that a developed financial system and lower IR can facilitate FDI by easing access to capital and supporting technology diffusion.
Building on the foundational work of Coase [5], who introduced transaction cost theory to explain firm behavior, Buckley and Hashai [55] refined these ideas through a general equilibrium model that integrates ownership, location, and internalization advantages—the pillars of Dunning’s paradigm. These contributions laid the groundwork for Hymer’s and Dunning’s theories on multinational enterprises (MNEs), which explore why firms internationalize and how they navigate cross-border operations.
Cantwell and Narula [56] highlight the complementary perspectives of Hymer, who focused on firm-specific competitive advantages, and Dunning, who emphasized cost efficiencies and development opportunities. Narula [57] later warned that the eclectic paradigm risks becoming tautological without a unifying framework, proposing a streamlined version (“EP-lite”) to preserve theoretical clarity.
Despite its widespread application, the eclectic paradigm has been critiqued for a lack of cumulative theoretical development. Wagner [58], through a comprehensive review of 66 studies from 1980 to 2017, illustrated its evolution into a complex interdisciplinary model, while also identifying the need for methodological consistency in future research. Other empirical applications, such as Brouthers et al. [59], demonstrate that even small and medium service firms, like U.S. software companies, follow patterns predicted by Dunning’s theory.
Emerging Market Multinational Enterprises (EMNEs) present additional challenges to traditional FDI theories. Nayyar [60] emphasized the role of state [61] critiques attempts to radically redefine FDI frameworks, advocating for better theoretical alignment rather than wholesale replacements. Similarly, Gaur and Kumar [62] call for new models to explain the distinct paths of EMNEs compared to developed market firms.
Other contributions provide sector-specific and context-specific insights. For instance, Teixeira and Heyuan [63] demonstrated how university-industry linkages in China enhance FDI, while Pitelis and Teece [64] introduced orchestration theory to explain how dynamic capabilities influence MNE behavior.
Recent empirical studies further reinforce these theoretical claims. Bénassy-Quéré et al. [65] found that corruption, weak institutions, and labor protections inhibit FDI, while stronger legal and financial systems foster investment. Erlina and Sitorus [66] confirmed the negative impact of corruption, whereas GDP remains a consistent positive determinant. Meanwhile, Khan et al. [67] highlighted how political instability deters FDI in Pakistan, but trade openness and GDP growth can offset these effects.
ER continue to play a critical role in FDI dynamics. Madaki et al. [68] have shown that foreign ER fluctuations significantly affect economic growth, while other factors like IR and INF have weaker effects. Desai et al. [69] added that high corporate tax rates reduce profitability and capital investment in foreign affiliates, although indirect taxes have less influence.
These diverse theoretical and empirical contributions collectively demonstrate that FDI is shaped by a complex interplay of macroeconomic variables, institutional quality, and firm-specific strategies. In the context of Kosovo, applying the eclectic paradigm helps clarify how factors such as political stability, favorable tax regimes, ER predictability, and AC influence foreign investment decisions. While Dunning’s paradigm remains central, evolving global conditions and the rise of EMNEs suggest a need for continual refinement and contextual adaptation of these theoretical models.
This study presents an empirical quantitative analysis based on primary data, aimed at examining the views of foreign investors on how economic factors influence their decisions to invest in Kosovo. It spans the period from 2018 to 2023, focusing on the experiences of foreign investors who began their operations in Kosovo in 2018 and are still active. This period allows for the evaluation of shifts in investor opinions over time.
Data for this study were collected using a structured Likert scale survey, targeting foreign companies selected at random from all sectors of Kosovo's economy. Between 2018 and 2023, 460 companies were registered, of which 233 remained active, while the rest were closed. Using the YAMANE automatic formula a sample size of 148 companies was determined (https://statsmartly.com/Pop/Yamane.php/#).
Data collection occurred in two phases: the first phase involved gathering 52 surveys from October to December 2024 via email and direct contact. In January 2025, the second phase saw the collection of 96 surveys from investors who preferred face-to-face interaction. The questionnaire was pre-tested to ensure clarity, comprehensibility, and reliability, as well as to identify and correct any issues or ambiguities before it was fully deployed in the study. In addition to the survey data, supplementary information was obtained from annual reports of the Central Bank of Kosovo [70], the Kosovo Agency of Statistics [71], the Kosovo Business Registration Agency [72], the Kosovo Tax Administration [73], official publications from the Ministry of Industry, Entrepreneurship and Trade of Kosovo [74], and both local and international research.
Econometric methods were employed to analyze the data, including descriptive statistical analysis to assess foreign investors' confidence in relation to economic factors (ER, INF, IR, AC, CO, banking services, economic growth, and taxation). Correlation analysis was used to examine the relationships between FDI and economic indicators, as well as the interconnection between independent variables. Regression analysis was applied to evaluate the statistical significance of the impact of these independent variables on foreign investors' motivation.
Here is the connection between the study variables and the theories of Hymer and Dunning, including the model used, tests applied, and the key authors referenced in the analysis of multinational enterprise theory:
The results were interpreted by comparing them with previous studies on foreign investment and economic stability, focusing on factors such as ER volatility, tax incentives, interest rate stability, economic growth, INF, competitiveness between foreign and domestic firms, and AC. This comparison helped assess the motivation of current foreign investors and their potential impact on attracting future investors to Kosovo. Data for the study was sourced from the Statistics Agency of Kosovo, (ASK) and the Tax Administration of Kosovo (ATK). The sample size was determined using [75] formula and [76] method to ensure representativeness. The survey included companies from all sectors, with a focus on large and medium-sized firms, and was stratified by region (with higher concentration in Pristina and Ferizaj). Companies were selected randomly within these sectors and regions.
The data collected through the structured questionnaire were processed and subsequently standardized using the Z-score method prior to performing the MLR analysis. Although all items were originally measured on a uniform 7-point Likert scale (ranging from 1 to 7), standardization was conducted to ensure comparability across variables and to minimize the potential influence of different value magnitudes on the regression results.
Table 3 provides a comprehensive overview of the study's theoretical and methodological framework. The research adopts a quantitative design using structured questionnaires distributed randomly to foreign companies in Kosovo, with a sample size of 148 out of 233 identified firms. Two main hypotheses and related research questions guide the investigation of economic variables influencing FDI motivation. Data were analyzed using statistical tests such as Kendall's Tau-b, Cronbach's Alpha, ANOVA, KMO, and PCA through SPSS software. The framework is grounded in Hymer's and Dunning's theories, integrating key contributions from recent scholarly literature to support the validity and relevance of the study's approach.
Table 3. Overview of the research framework and methodological approach
|
Component |
Description |
|
Research Design |
Quantitative research using primary data collected through a structured questionnaire targeting foreign companies in Kosovo. |
|
Structured Questionnaire |
The questionnaire is designed to collect primary quantitative data, which is gathered randomly from foreign companies in Kosovo. |
|
Sample and Population |
The sample consists of 233 foreign companies, while the total population (sampling frame) includes 148 foreign companies. |
|
Hypotheses |
H1: "ER, INF, IR, AC, CO, e-banking and banking services (E-BBS), economic growth (EGr), and taxes (Tax) have a positive and statistically significant impact on the return of the motivation of foreign investors in Kosovo." |
|
|
H2: "There is a positive and statistically significant correlation among ER, INF, IR, AC, CO, e-banking and banking services (E-BBS), economic growth (EGr), and taxes (Tax) with the motivation of foreign investors in Kosovo." |
|
Research Questions |
i) Does economic stability have a positive and statistically significant impact on the return of the motivation of foreign investors in Kosovo? |
|
|
ii) Is there a positive and statistically significant correlation between economic stability and the motivation of foreign investors in Kosovo? |
|
Data Collection |
Primary data was collected from 148 foreign companies (sample) operating in Kosovo through a structured questionnaire. |
|
Tests Applied |
Kendall's Tau b: Measures the strength and direction of relationships between variables. |
|
|
Cronbach’s Alpha: Evaluates internal consistency and reliability of the data collected. |
|
|
ANOVA with Friedman's Test: Detects differences between related samples. |
|
|
KMO and Bartlett's Test: Assesses data suitability for factor analysis. |
|
|
Principal Component Analysis (PCA): Reduces data dimensionality while retaining key information for analysis. |
|
Statistical Software |
SPSS, 25 software will be used for data analysis. |
|
Refs. |
[1-4, 8, 9, 32, 33, 36, 37, 39-41, 43-45, 47, 49, 50, 53-58, 60, 79] |
The analysis employed standardized variables (denoted by the prefix "Z”), which represent transformed versions of the original variables with a mean of 0 and a standard deviation of 1. This standardization approach contributed to the robustness of the statistical analysis and allowed for a clearer interpretation of the relative weight of each predictor variable within the regression model.
Standardization of variables is considered an important step in regression and multivariate analysis to ensure comparability of coefficients and eliminate scale-related bias [77].
Standardizing variables before conducting linear regression enhances the interpretability of coefficients and simplifies calculations, as it involves transforming each variable by subtracting its sample mean and dividing by its standard deviation, resulting in variables with a mean of zero and a standard deviation of one [78].
The confidence level in the sample size calculation was determined using Yamane's formula, based on a population of 233 companies and a 5% margin of error [75]:
$n=\frac{\mathrm{N}}{1+N e^2}$ (1)
where, n = sample size needed; N = population size (total number of individuals or units); e = margin of error (acceptable error level, e.g., 0.05 for 5%).
$\begin{gathered}n=\frac{233}{1+233 \times(0.05)^2}=\frac{233}{1+233 \times 0.0025}=\frac{233}{1+0.5825}=\frac{233}{1.5825} \approx 147.2\end{gathered}$ (2)
So, the sample size ≈147, which rounds to 148.
The Yamane formula [75] assumes a normal distribution for interpreting perceptions of required and applied skills in practice, making it an appropriate method for sample size determination. In this study, the total population of active foreign companies in Kosovo is N=233, and the calculated sample size is n=148. A 95% confidence level was applied, with an assumed population proportion p=0.5.
The calculation follows the procedure described in Yamane [75].
Figure 1. Sample selection flowchart
Also expressed in Figure 1, the sample selection flowchart clearly outlines the three-step process, identifying the target population of foreign investors, the total population size (N = 233), and the final sample size (n = 148), ensuring a representative and reliable dataset for analysis.
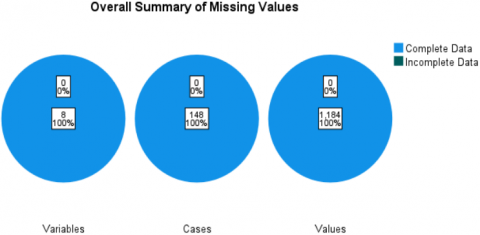
Figure 2. Overall summary of missing values
In this case, a sample of 148 companies is sufficient to draw reliable conclusions for the population of 233 companies in Kosovo. Figure 2 shows that there were no missing responses in any of the 148 surveys.
The data used in this study are cross-sectional in nature, collected through a structured questionnaire over a four-month period. Initially, 52 questionnaires were tested and the results were published. Subsequently, 96 more surveys were collected in January 2025, bringing the total to 148 surveys from foreign companies in Kosovo. The sample consists of 233 active companies for the period 2018-2023 (the period 2018-2023 was specified for convenience in locating them, as access to data is very difficult due to confidentiality concerns from the tax office). A Likert scale was used to measure their opinions regarding the impact of economic factors on the increase or decrease in motivation among foreign investors operating in Kosovo. The data were collected only once from each company. There are no repeated measurements for the same company across different time periods. The four-month data collection period does not classify the data as time series but as cross-sectional (also highlighted are the tests that should be used), as the goal was to include as many companies as possible within a single period, rather than to observe changes over time.
The realization of the study was made possible through a structured questionnaire consisting of 16 questions independent variable and 8 questions and dependent variables on a Likert scale [80]: (1 (Very Negative), 2 (Negative), 3 (Somewhat Negative), 4 (Neutral), 5 (Somewhat Positive), 6 (Positive), 7 (Very Positive).
Before testing, the Likert scale responses were standardized in order to generate the output from SPSS. For the dependent variable of the study and the independent variables, PCA was used to reduce the variables that do not have significance in assessing the motivation of investors. Similarly, PCA was applied to the independent variables to retain only those variables that contribute meaningfully to the model, ensuring that any errors during calculation were minimized.
In this research, a) the “Dependent variable” associated with the hypothesis is the "Motive of Foreign Investors", denoted by the symbol (MFI) which consists of 16 variables which, through the PCA test, have been reduced to 6 components that most motivate foreign investors: (Motivation for Starting a Business in Kosovo: Easy access to local markets; Size of the available market; Availability of workforce; Availability of natural resources; Low CO in the market; Low cost of doing business; Easy access to market information; Healthy economic policies; Poor business environment in Kosovo; Government support for export promotion; Simple government regulations for foreign businesses; Simple regulations for imports; Influence from friends and family members; encouragement from local businesses in Kosovo; The culture of the Albanian people; FDI from other markets).
The formula is a way to calculate the MFI_index that measures the motivation of foreign investors in Kosovo, by combining ratings and weights for 16 economic variables.
Then, the MFI Index would be:
$M F I_{\text {index }}=\frac{1}{n} \sum_{i=0}^n \text { Rating of } \text { Factor }_i$ (3)
where, n is the number of factors (in this case, 16); Rating of Factori is the rating for each individual factor, scored from 1 to 7.
$\begin{aligned} & M F I_{{index }} =\frac{1}{16} \sum_{i=0}^n\left(\frac{\left(\begin{array}{c}\text { Weight1 } * \text { Rating1 }+\ldots \\ + \text { Weight16 } \\ * \text { Rating16 }\end{array}\right)}{(\text { Weight1 }+\ldots+\text { Weight16 })}\right)\end{aligned}$ (4)
where,
- Ratingi: The score given to the i-th variable (e.g., political stability, infrastructure, tax policy, etc.).
- Weighti: The importance (weight) assigned to the i-th variable (how significant each variable is to foreign investors).
- 16: Indicates that there are 16 economic variables being considered PCA (PCA- is used to reduce variables (dimensionality). From 16 variables, PCA extracts several principal components (1, 2, 3, 4, 5, 6 or more) that represent the majority of the information. PCA eliminates multicollinearity: if some variables are strongly correlated with each other, PCA combines them without repetition. It creates an objective index: instead of assigning subjective weights to the variables, PCA automatically generates weights based on the variance of the data. This test was applied separately to the dependent variable, which is represented by 16 variables, and it was also repeated for the independent variables, which include 8 variables, in order to reduce them to 3 or 4 components that best represent the economic environment in Kosovo).
- The inner part (in parentheses): This is a weighted average of the ratings for all 16 variables, where each rating is multiplied by its respective importance (weight).
- The summation ∑ from i=1 to n: Represents the total number of respondents or cases (for example, how many investors filled out the questionnaire).
- The 1/16 factor: This seems to be an additional normalization, but depending on the structure of the formula, it might not be necessary here if you’re already averaging across respondents.
Economic factors are measured on a Likert scale the factors: ER, INF, IR, AC, CO, E-Banking and Banking Services (E-BBS), Economic Growth (EGr), and Taxes (TAX).
The Hypotheses Study:
H1: ER, INF, IR, AC, CO, e-banking and banking services (E-BBS), economic growth (EGr), and taxes (Tax) have a positive and statistically significant impact on the return of the motivation of foreign investors in Kosovo.
H2: There is a positive and statistically significant correlation among ER, INF, IR, AC, CO, e-banking and banking services (E-BBS), economic growth (EGr), and taxes (Tax) with the motivation of foreign investors in Kosovo. To ensure reliable results, tests were performed prior to inferential statistics and hypothesis testing. Descriptive statistical tools were used to calculate the mean and standard deviation, summarizing key data trends.
Descriptive analysis of questionnaire variables begins with the weighted arithmetic mean.
The arithmetic mean is calculated as follows, Eqs. (3) and (5) [81]:
$x_i=\frac{\text { Upper class limit }+ \text { Lower class limit }}{2}$ (5)
and,
Mean $=\overline{\mathrm{x}}=\frac{\sum \mathrm{f} i x i}{\mathrm{f} i}$ (6)
After using variance as an absolute indicator of deviation, the analysis also applies the Sample Standard Deviation formula to measure the dispersion of variables. This method is calculated using a standard formula widely recognized in statistical literature [81].
Eq. (7) shows quantities that are multiplied by their respective weights, summed, and then divided by the total weight, followed by the calculation of the standard deviation.
$\sigma=\sqrt{\frac{\left.\sum(\mathrm{xi} \,\overline{\mathrm{x}})^2\right)}{n-1}}$ (7)
σ =Standard Deviation; xi = terms given in the data; x̄ = mean; n = total number of term.
Test Reliability refers to the extent to which a test is free from measurement error. The greater the measurement error, the less reliable the test becomes [75]. In our study, Cronbach's Alpha is used to assess the reliability of the survey, particularly for the group of 20 questions (variables) in sections 2 and 3 of the questionnaire (see Table 3). Cronbach’s Alpha is a statistical measure that evaluates the internal consistency of multiple Likert-type questions within a survey. Developed by Cronbach [76], this reliability test gauges how well the items in a scale are related to one another and if they measure the same underlying construct. According to UEDUFI [82], Cronbach's Alpha indicates the degree to which scale items correlate with each other as a group. The formula for Cronbach’s Alpha is presented by Bonett and Wright [83]:
$a=\left(\frac{K}{K-1}\right)+\frac{S y^2-S u m S i^2}{S y^2}$ (8)
where, α=Cronbach's Alpha; K=the number of items in the scale; Si=the sum of the item scores for the each item; S=the sum of the total scores for all items.
Friedman's Test [84], is a non-parametric alternative to repeated measures ANOVA, used when data is ordinal or not normally distributed. It tests if there are differences in ranks across related groups or conditions. The test statistic is calculated based on ranks, and the formula is:
$\chi^2=\frac{12}{n k(k+1)}=\sum_{j=1}^k R^2-3 n(k+1)$ (9)
Developed by Friedman [85], it's useful when assumptions of normality are violated, particularly for repeated measures or ranked data.
- The Kaiser-Meyer-Olkin (KMO) Test and Bartlett's Test of Sphericity are statistical tests used to assess the suitability of data for factor analysis.
KMO Test, Kaiser [86]: Measures the sampling adequacy for factor analysis. A high KMO value (close to 1) indicates that factor analysis is appropriate, while a low value (below 0.5) suggests it is not.
KMO Formul:
$K M O=\frac{\sum_{i \sum_j} R_{i j}^2}{\sum_{i \sum_j} R_{i j}^2+\sum_{i \sum_j} S_{i j}^2}$ (10)
where, Rij is the correlation coefficient and Sij is the partial correlation.
- Bartlett's Test [87]: Tests whether the correlation matrix is an identity matrix (i.e., no correlations between variables). A significant result (p<0.05) indicates that factor analysis is appropriate.
Bartlett Formula:
$X^2=\left(\mathrm{N}-1-\frac{2 p+5}{6}\right) \cdot \ln |\mathrm{R}|-\frac{1}{2} \cdot(2 \mathrm{p}+5)$ (11)
where, N is the sample size, p is the number of variables, and R is the correlation matrix.
Both tests help determine whether the data is suitable for factor analysis.
PCA [88] is a statistical technique used to reduce the dimensionality of data while preserving its essential variance. It transforms correlated variables into uncorrelated principal components that capture the maximum variance in the dataset. PCA is widely used for dimensionality reduction, feature extraction, and data visualization, making complex datasets easier to analyze and interpret [89]. It helps in improving processing efficiency and identifying patterns within data. The method is based on the calculation of eigenvectors and eigenvalues from the covariance or correlation matrix:
The principal components are derived using the formula [89, 90]:
$X=V L^{1 / 2}$ (12)
where, X, principal components (transformed data); V: Eigenvectors (matrix of loadings); L, matrix of eigenvectors (directions of components).
$V \sqrt{L}$, represents the transformation used to derive principal components ($L^{1 / 2}$ square root of the diagonal matrix of eigenvalues (variance explained by each component). The formula $X = V L^{1 / 2}$ means that to obtain the principal components, you multiply the eigenvectors by the square root of the eigenvalues.
Kendall's Tau_b [91], is an alternative method for measuring bivariate correlation, especially suitable for ordinal or categorical data. It is a variant of the rank correlation coefficient that accounts for ties (when two or more observations have the same rank). Kendall's Tau-b is particularly effective when the data exhibits non-linear relationships or when dealing with ordinal variables, such as investor preferences or market conditions.
In the context of this study, Second Hypothesis (H2) seeks to determine whether there are significant and strong relationships between the dependent variable, MFI, and the independent variables (ER, INF, IR, AC, CO, E-BBS, EGr, and Tax). To assess these relationships, Kendall's Tau B is employed as a nonparametric correlation coefficient. This method measures both the strength and direction of the relationship between two ordinal or interval variables [92]. Kendall's Tau_b [91] is particularly useful when the data does not adhere to a normal distribution or when the sample size is small, as is the case with the 148 investor cases in this study. This makes Kendall's Tau B more appropriate than parametric tests. The Tau B coefficient is computed using the following formula [91]:
Kendall's Tau_b $=\frac{(D-D)}{\sqrt{\left(C+D+T_X\right) *\left(C+D+T_Y\right)}}$ (13)
where, C is the number of concordant pairs (where one variable increases when the other increases), D is the number of discordant pairs (where one variable increases and the other decreases), and TX and TY are the numbers of equalities in each variable. In addition, τb takes values from -1 (perfect negative relationship) to +1 (perfect positive relationship), with 0 indicating no relationship. A statistically significant value indicates that the variables have a statistically valid relationship.
For H1, this method can answer the following questions:
The first hypothesis (H1) aims to determine whether the independent variables—ER, INF, IR, AC, CO, E-Banking and Banking Services (E-BBS), Economic Growth (EGr), and Taxes (Tax)—have a positive and statistically significant impact on the dependent variable, Motivation of Foreign Investors (MFI). According to Gujarati and Porter [93], the concept of regression was first introduced by Francis Galton in 1892 as part of his studies on heredity. It is a method used to examine the relationship between a response variable (Y) and a covariate (X), where Y represents the dependent variable and X represents the independent variable. In essence, regression seeks to understand how changes in the independent variable affect the dependent variable and reveals the average quantitative relationship between two or more phenomena. Linear regression (LR) is a foundational predictive analysis tool that helps explore functional relationships between variables. One variable is treated as explanatory, while the other is treated as dependent. The analysis begins with Simple Linear Regression (SLR), expressed in Eq. (13), and MLR in Eq. (14). As discussed by Gujarati and Porter [93] and other scholars, these regression models provide a structured framework for understanding the relationships between variables and for making predictions based on these relationships.
Y = a + bx (14)
where, a and b are given by the following formulas:
$a({ intercept })=\frac{\sum y \sum x^2-\sum x \sum x y}{\left(\sum x^2\right)-\left(\sum x\right)^2}$ (15)
and,
$b( slope)=\frac{n \sum x y-\left(\sum x\right)\left(\sum y\right)}{n \sum x^2-\left(\sum x\right)^2}$ (16)
In this equation, x and y represent the two variables along the regression line; b is the slope of the line, a is the y-intercept, x corresponds to the values from the first dataset, and y corresponds to the values from the second dataset.
The Equation of the Theoretical Model of MLR:
$Y=\beta_0+\beta_1 \mathrm{X}_1+\beta_2 \mathrm{X}_2+\beta_3 \mathrm{X}_3+\ldots+\beta \mathrm{pXp}+\varepsilon$ (17)
Y: Represents the response variable;
β0: Denotes the y-intercept;
β1: Represents the average change in Y resulting from a one-unit increase in Xj, while keeping all other predictors constant;
X1: Indicates the first predictor variable;
ε: Represents the error term.
The coefficients β0, β1, β2, …, βp are estimated using the Least Squares Method, which aims to minimize the Residual Sum of Squares (RSS).
The Residual Sum of Squares (RSS) is determined by summing the squared differences between the actual response values (yi) and the predicted values (ŷi) from the MLR model.
RSS $=\Sigma\left(\mathrm{y}_{\mathrm{i}}-\hat{\mathrm{y}}_{\mathrm{i}}\right)^2$ (18)
where, Σ represents the summation; yi is the observed value for each data point, and ŷi is the corresponding predicted value.
The F distribution with degrees of freedom is used for regression.
dfR = k (19)
where, dfR = degrees of freedom for regression, k = number of independent variables (predictors) in the model.
The F-distribution is used to test the overall significance of the regression model. The degrees of freedom for regression (dfR) equal the number of predictors (k), while the degrees of freedom for error (dfE) are calculated as the total number of observations minus the number of predictors and the intercept, i.e., dfE = n − k − 1.
A right-tailed ANOVA test is then applied to determine whether the variation explained by the regression model is greater than the variation caused by error. The main components of the ANOVA table include the test statistic and the p-value, which indicate the statistical significance of the model. In contrast, the t-test focuses on evaluating whether a specific variable (β1) significantly influences the prediction of the dependent variable (y), rather than assessing the overall regression model.
$\mathrm{t}_{\mathrm{n}-\mathrm{k}}=\frac{\mathrm{b} 1}{\text { Std error of b1 }}$ (20)
and, Std error of b1:
$\left(\mathrm{Sb}_1\right)=\frac{\sqrt{\mathrm{MSE}}}{\sqrt{(X-X)^2}}$ (21)
This model helps assess the influence of independent variables on the dependent variable, offering a clearer insight into how these relationships might impact the study's outcomes.
The analysis was processed with SPSS 25 to extract results.
To assess the influence of independent variables on the dependent variable (MFI) and examine the relationships between variables, a series of estimation steps were followed. Initially, a descriptive statistical analysis was performed to summarize the main features of the data. Next, demographic analysis was carried out, with the study data being visualized through graphs to emphasize key demographic characteristics. Subsequently, diagnostic tests were conducted to verify the reliability and suitability of the data, ensuring that valid statistical conclusions could be drawn. Following this, Kendall's Tau-b analysis was employed to measure the relationships between variables. Finally, MLR analysis was applied to estimate the structural equation model and assess the impact of the independent variables on the dependent variable (MFI).
4.1 Descriptive statistics
Key statistical measures (Table 4), including the number of observations, mean, standard deviation, Skewness and Kurtosis, were calculated for each variable: To identify the most suitable variables for analyzing the motivation of foreign investors in Kosovo, several aspects of descriptive statistics are considered. Stability and Reliability: Variables with lower variability, such as interest rate (SD: 0.891), AC/loans (SD: 1.073), and taxes (SD: 1.058), are more stable and reliable for analysis. Response Distribution: AC/loans and interest rate have lower skewness and are closer to a normal distribution, indicating a more consistent perception among investors. Investor Perception: Variables with higher averages, such as AC/loans (6.07) and investor motivation (25.84), show a positive perception and significant impact.
Table 4. Descriptive statistics
|
|
N |
Mean |
Std. Deviation (SD) |
Skewness |
Kurtosis |
||
|
Statistic |
Statistic |
Statistic |
Statistic |
Std. Error |
Statistic |
Std. Error |
|
|
Motive for foreign investors |
148 |
25.84 |
13.067 |
-.603 |
.199 |
-.880 |
.396 |
|
ER |
148 |
4.43 |
1.910 |
-.684 |
.199 |
-1.222 |
.396 |
|
INF |
148 |
3.97 |
1.154 |
.107 |
.199 |
-1.411 |
.396 |
|
IR |
148 |
5.45 |
.891 |
-.792 |
.199 |
.721 |
.396 |
|
AC |
148 |
6.07 |
1.073 |
-.939 |
.199 |
-.398 |
.396 |
|
CO |
148 |
4.63 |
1.907 |
-.570 |
.199 |
-1.088 |
.396 |
|
E-banking and banking services EBBS |
148 |
4.10 |
1.465 |
-.165 |
.199 |
-1.247 |
.396 |
|
Economic growth EGr |
148 |
5.00 |
1.119 |
-.739 |
.199 |
-.005 |
.396 |
|
Taxes Tax |
148 |
5.87 |
1.058 |
-.648 |
.199 |
-.633 |
.396 |
|
Valid N (listwise) |
148 |
|
|
|
|
|
|
Negative Kurtosis: Variables such as ER, INF, and E-BBS exhibit a flatter distribution, requiring further analysis. Interest rate, access to credit/loans, and taxes are the most reliable variables, while investor motivation remains a key factor.
4.2 Demographic statistics
FDI and other variables are presented in graphical and tabular form below.
Based on data from the Central Bank of Kosovo (CBK) for the period from January to September 2024 (Figure 3), FDI reached €657.3 million, marking an increase of €38.5 million or approximately 6.2% compared to the same period in 2023. However, compared to previous years, there is a decline in the annual growth trend.
Figure 3. FDI by year (millions of euros) and annual increase/decrease in %
According to data from January to September 2024 (Figure 4), FDI continue to be predominantly dominated by real estate activities, accounting for 71.4%, followed by financial and insurance activities at 14.9%. The remaining 13.7% consists of other sectors, including construction at 1.6%, manufacturing at 1.5%, mining and quarries at 1.4%, wholesale and retail trade, motor vehicle repair, and motorcycle repair at 1.3%, among others. Motivation of foreign investors in Kosovo.
Figure 4. FDIs by year and economic activities in %
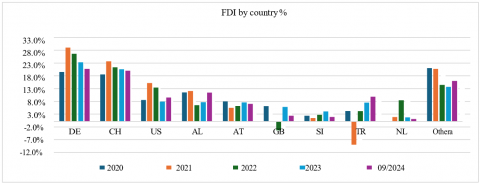
According to analysis by country of origin, the leading investors in Kosovo are from the EU 27 (Figure 5). FDI in Kosovo by country (net) for the period from January to September 2024 are as follows: Germany 20.8%, Switzerland 20.0%, the USA 9.5%, Albania 11.4%, Austria 7.0%, the United Kingdom 2.3%, among others, representing their share in total FDI.
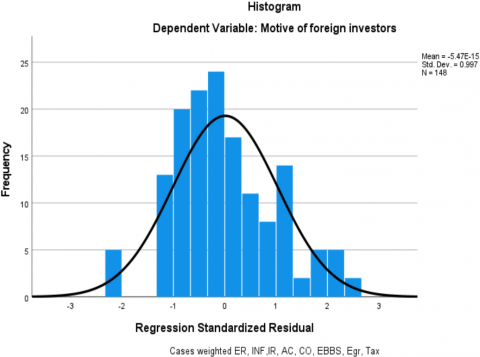
Figure 6. Motive of investors and the performance of economic factor's
The opinion of foreign investors on economic factors is presented in the created Figure 6.
The results presented in Figure 6, based on the statistical analysis of the motives of foreign investors, suggest that although various economic factors such as ER, INF, IR, AC, CO, e-banking and banking services, economic growth, and taxes are related to these motives, their impact is moderate in this sample. The low mean and standard deviation indicate that the data distribution is compact, with low variability among the data values.
This may imply that the analyzed factors do not have a high impact on the motives of foreign investors. To better understand the potential impacts, it may be necessary to apply more advanced statistical methods or consider additional factors that were not included in this analysis.
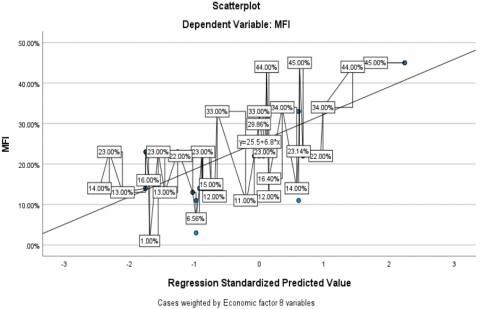
Figure 7. The impact of 8 independent variables on the dependent variable MFI
Figure 7 presents the results of the linear regression analysis, indicating that economic factors influence the motivation of foreign investors to invest in Kosovo. The regression equation Y=25.5+6.8X reveals a positive relationship between the economic variables and investor motivation. The R² value of 45% suggests that 45% of the variation in investor motivation can be explained by these economic factors. The scatter plot displays the distribution of motivation based on the predicted values. To boost investments, it is recommended to improve economic conditions, particularly by enhancing AC and stabilizing ER.
4.3 Statistical tests
To create the motivation index (Dependent variable), data from the components PCA have been used, and the formulas and calculations for each of the 6 components we extracted were processed. The loadings for each variable in the components have been used and multiplied by the weights provided.
4.3.1 Testing dependent variables
Calculations, Cronbach's Alpha, KMO test and PCA for each component Dependent variable MFI (See: This part was not included in the article due to the volume of words that were added too much):
a) A Cronbach's Alpha (Table 5)
Value of 0.849 indicates that the 16 items in the foreign investor motivation index demonstrate high internal consistency and reliably measure the same underlying construct.
Table 5. Reliability statistics-MFI
|
Cronbach's Alpha |
N of Items |
|
.849 |
16 |
b) KMO and Bartlett's Test (Table 6)
With a KMO Table 6 value of 0.745: The sample is suitable for factor analysis, because the value falls into the "good" category. However, Bartlett's Test of Sphericity is statistically significant (p<.001), which means that the correlations between items are sufficient to proceed with factor analysis.
Table 6. KMO and Bartlett's test-MFI
|
Kaiser-Meyer-Olkin Measure of Sampling Adequacy |
.745 |
|
|
Bartlett's Test of Sphericity |
Approx. Chi-Square |
792.107 |
|
df |
120 |
|
|
Sig. |
.000 |
|
c) Tests PCA-MFI
Table 7. Component matrixa
|
Variable |
Component |
|||||
|
1 |
2 |
3 |
4 |
5 |
6 |
|
|
Investors' Motive |
-.761 |
.316 |
-.174 |
-.143 |
-.075 |
.178 |
|
Easy Access to Local Markets |
.149 |
.679 |
.287 |
.034 |
-.193 |
.274 |
|
Demonstrated Size of Investment |
-.557 |
.119 |
-.088 |
.410 |
.447 |
-.133 |
|
Availability of Labor |
.146 |
-.337 |
.514 |
-.167 |
-.584 |
.074 |
|
Availability of Natural Resources |
-.668 |
-.337 |
.181 |
.057 |
.243 |
.151 |
|
Low Market Competition |
.566 |
.523 |
.065 |
.070 |
.257 |
-.148 |
|
Low Cost of Doing Business |
.465 |
.002 |
-.545 |
-.560 |
.104 |
-.016 |
|
Ease of Access to Market Information |
-.064 |
.266 |
-.283 |
.579 |
-.601 |
-.069 |
|
Sound Economic Policies |
-.374 |
.618 |
-.100 |
.386 |
.079 |
.074 |
|
Weak Business Environment in Kosovo |
.424 |
.544 |
.352 |
-.232 |
.247 |
.081 |
|
Government Cares for Export Promotion Initiatives |
.299 |
.061 |
-.050 |
.095 |
-.093 |
.795 |
|
Simple Government Regulations for Foreign Businesses |
.289 |
-.552 |
-.233 |
.383 |
-.149 |
-.134 |
|
Simple Import Regulations |
.199 |
-.019 |
.702 |
.352 |
.084 |
-.001 |
|
Influence from Friends and Family Members |
-.166 |
.337 |
.451 |
-.199 |
-.242 |
-.534 |
|
Encouragement from Kosovar Businesses |
.741 |
.054 |
.101 |
.329 |
.259 |
-.033 |
|
Culture of the Albanian People |
.041 |
-.712 |
.393 |
.114 |
.255 |
.132 |
|
FDI from Other Markets |
.709 |
-.084 |
-.338 |
.265 |
-.038 |
-.110 |
|
Extraction Method: PCA. |
||||||
|
a. 6 components extracted. |
||||||
Table 7 identifies which variables contribute most to each of the 6 main components, with the aim of building a common index that measures the motivation of foreign investors in Kosovo.
Summary of Key Components
-Component 1 – Local Support and Positive Climate:
Positive: Support from Kosovar businesses, FDI from other markets, low CO.
Negative: Personal motive for investment, natural resources. Reflects the influence of the supportive local climate on motivation.
- Component 2 – Institutional Access and Local Market:
Positive: Access to local markets, economic policy, business environment.
Negative: Albanian culture, regulations for foreign businesses. Indicates the importance of institutional structures and perception of the environment.
- Component 3 – Regulatory Framework and Social Impact:
Positive: Import regulations, labor force, family impact. Reflects regulatory ease and social impacts on decision-making.
- Component 4 – Access to Information and Market Size:
Positively: Market information, market size, government regulations
Assess easy access to information and the size of opportunities.
- Component 5 – Cost and Benefit:
Positively: Size of investment, low competition.
Negatively: Labor force, market information. Measures the balance between cost and benefit in investment.
- Component 6 – Institutional Support:
Positively: Government care for exports.
Negatively: Influence from family/friends. Related to the role and trust in the government in attracting investment.
These components were then used to calculate the overall investor motivation index, based on their scores and the weight of each factor. This approach has also been applied previously [94] demonstrating the importance of PCA testing in reducing insignificant variables
The result of the main components (component scores) calculated based on the average ratings and the matrix of components:
The Component Transformation Matrix (Table 8), for MFI shows the correlations between the original factors and the newly extracted factors after applying Varimax rotation. High positive loadings (e.g., 0.860 for Component 1) indicate a strong relationship between the original variable and the new component. Negative values (e.g., -0.177 for Component 2 on Component 1) suggest an inverse correlation. The matrix helps to identify which components are strongly associated with each extracted factor, providing clearer interpretation of the data. The use of PCA and Varimax rotation makes it easier to understand the underlying dimensions of the data by maximizing variance explained per component.
Table 8. Component transformation matrix-MFI
|
Component |
1 |
2 |
3 |
4 |
5 |
6 |
|
1 |
.860 |
.148 |
.330 |
-.306 |
.150 |
-.119 |
|
2 |
-.177 |
.724 |
.478 |
.085 |
-.333 |
.312 |
|
3 |
.143 |
-.540 |
.514 |
.536 |
-.032 |
.367 |
|
4 |
.023 |
.369 |
-.097 |
.519 |
.764 |
-.021 |
|
5 |
-.399 |
-.155 |
.421 |
-.563 |
.529 |
.206 |
|
6 |
.222 |
.035 |
-.459 |
-.158 |
.048 |
.843 |
|
Extraction Method: PCA. Rotation Method: Varimax with Kaiser Normalization. |
||||||
Component 1: Low market competition; Easy access to local markets; Component 2: Healthy economic policies; Weak business environment in Kosovo; Component 3: Availability of labor force; Simple import regulations; Component 4:Ease of access to market information; Simple government regulations for foreign businesses; Component 5: Market size available; Availability of natural resources; Component 6: Government care for export promotion initiatives.
This index represents a summary of the influence of each component on motivation, considering the loadings of the respective variables and the weights we assigned.
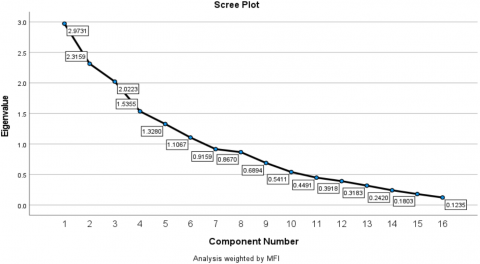
A scree plot is used to visualize the results of a PCA and helps in determining the number of components that should be retained in the model (Figure 8). This plot shows the eigenvalues (the amount of variance explained) for each component and typically uses a "Kaiser criterion" to decide the optimal number of components. In a scree plot, components with an eigenvalue greater than 1 are considered significant and should be retained, while those with an eigenvalue less than 1 can be excluded.
Figure 8. Screen plot-the reduced variables with the most impact on investor motivation
MFI Index based on these 16 factors, we can use a simple weighted sum formula or an average-based approach, depending on how you want to weigh the factors. No, there is no need for standardization to create an index with the average of Likert scales (when the variables are on the same Likert scale). Using the mean of Likert data, where each value has the same importance across all questions, is sufficient to obtain an overall summary without the need for standardization of variables. In addition to using PCA for the independent variables, it should be noted that PCA was used (also for the dependent variable since it is represented by 16 variables to identify the main factors that measured the motivation of foreign investors in Kosovo), then an index was created based on these components, with the weights resulting from PCA. Furthermore, further validation is always necessary, internal consistency (Cronbach's Alpha) to verify that the components are reliable, which has been done.
Formula for the Index: If we assume equal weights for each factor (which is common when there are no specific reasons to assign different weights), the formula for the MFI Index would be:
This will give you an average score for all the factors, which can be interpreted as the overall MFI Index.
Table 9. Using weights from PCA
|
No. |
Variable |
Rating |
Weight from PCA |
Rating×Weight |
|
1 |
Easy access to local markets |
5 |
0.149 |
0.745 |
|
2 |
Size of the available market (Demonstrated Size) |
6 |
-0.557 |
-3.342 |
|
3 |
Availability of workforce (Labor) |
4 |
0.146 |
0.584 |
|
4 |
Availability of natural resources |
6 |
-0.668 |
-4.008 |
|
5 |
Low competition in the market |
5 |
0.566 |
2.830 |
|
6 |
Low cost of doing business |
7 |
0.465 |
3.255 |
|
7 |
Easy access to market information |
6 |
-0.064 |
-0.384 |
|
8 |
Healthy economic policies |
4 |
-0.374 |
-1.496 |
|
9 |
Poor business environment in Kosovo |
3 |
0.424 |
1.272 |
|
10 |
Government support for export promotion |
6 |
0.299 |
1.794 |
|
11 |
Simple gov. regulations for foreign businesses |
5 |
0.289 |
1.445 |
|
12 |
Simple regulations for imports |
4 |
0.199 |
0.796 |
|
13 |
Influence from friends and family members |
7 |
-0.166 |
-1.162 |
|
14 |
Encouragement from local businesses in Kosovo |
6 |
0.741 |
4.446 |
|
15 |
Culture of the Albanian people |
5 |
0.041 |
0.205 |
|
16 |
FDI from other markets |
6 |
0.709 |
4.254 |
|
|
Total |
|
|
10.564 |
Table 9 presents the key factors influencing the motivation of foreign investors in Kosovo, where each factor is assigned a rating by respondents and a weight obtained from Principal Component Analysis (PCA). By multiplying each rating by its corresponding PCA weight and summing these weighted scores, a total value of 10.564 is obtained.
- Formula for Motivation of Foreign Investors (FDI) Index
Applying this to your factors:
$\begin{aligned} M F I_{ {index }}=\frac{1}{16} \sum_{i=0}^n & \text { (Easy access to local markets + ... } + \text { Rating of FDI from other markets }+\ldots+\text { ) }\end{aligned}$ (22)
The Motivation of Foreign Investors Index (MFI_index) formula then divides this total by the number of factors (n=16) to calculate the average motivation score:
$\begin{aligned} & M F I_{ {index }} \\ & =\frac{1}{n} \sum_{i=0}^n\left(\frac{\binom{\text { Weight PCA1 } * \text { Rating } 1+\ldots}{+ \text { WeightPCA16 } * \text { Rating } 16}}{(\text { Weight } 1+\ldots+\text { Weight } 16)}\right)=\frac{10.564}{16}=5.11\end{aligned}$ (23)
Final result: MFI Index=5.11 (This result indicates a relatively high level of investor motivation in relation to local support, positive business climate, and economic factors).
In summary, using PCA-derived weights assigns statistical significance to each factor rather than relying solely on subjective ratings, resulting in a more reliable and objective measure of investor motivation.
This value was transferred to SPSS 25 to the dependent variable MFI.
4.3.2 Testing independent variables
Statistical tests are essential for assessing data reliability, validity, Cronbach's Alpha evaluates internal consistency and reliability. ANOVA with Friedman’s Test is used to detect differences between related samples, and KMO and Bartlett's Test assess data suitability for factor analysis. Lastly, PCA reduces data dimensionality while retaining key information for analysis.
a) The Cronbach's alpha coefficient (CORR) test
Table 10, Reliability assessed by looking at the mean, standard deviation, and sample size. Mean: Both variables (MFI and Economic Factors) show positive evaluations, with means around 4.5 and 5, suggesting favorable opinions from respondents. Standard Deviation: The small standard deviations (0.25923 and 0.28588) indicate consistent responses, with little variation and a high level of agreement. Sample Size: A sample size of 148 is sufficient for reliable analysis and allows for generalization of the results.
Table 10. Item statistic
|
|
Item Statistic Mean |
Std. Deviation |
N |
|
Investors' Motive Foreign (MFI) (The missing variable index (MFI) is specified in the additional annex.) |
4.5107 |
.25923 |
148.00 |
|
Economic Factors |
5.0312 |
.28588 |
148.00 |
Instrument Reliability Analysis (Reliability Statistics) Table 11: To assess the reliability of the questionnaire used in this study, Cronbach's Alpha coefficient was applied, which measures the internal consistency of a group of items that are supposed to measure the same theoretical construct.
Table 11. Reliability instrumental statistics (Cronbach’s alpha test)
|
Cronbach's Alpha |
Cronbach's Alpha Based on Standardized Items |
N of Items |
|
.769 |
.787 |
9 |
The Cronbach's Alpha value=.769 indicates a good level of reliability, as in the literature values above .70 are considered acceptable for research analysis [75]. The Alpha value based on standardized items (.787) is slightly higher, which indicates that standardization of items may have slightly increased uniformity among them. The number of items included in the analysis is 9, which is an adequate number for a simple factorial structure.
Based on these values, the instrument used to measure factors affecting foreign investment in Kosovo shows a good degree of internal consistency and is suitable for use in further statistical analyses.
b) ANOVA with Friedman's Test
Table 12. ANOVA with Friedman's test
|
|
Sum of Squares |
df |
Mean Square |
Friedman's Chi-Square |
Sig |
|
|
Between People |
12.434 |
147 |
.085 |
|
|
|
|
Within People |
Between Items |
20.054a |
1 |
20.054 |
100.568 |
.000 |
|
Residual |
9.458 |
147 |
.064 |
|
|
|
|
Total |
29.513 |
148 |
.199 |
|
|
|
|
Total |
41.947 |
295 |
.142 |
|
|
|
Grand Mean=4.7710
a. Kendall's coefficient of concordance W= .478.
Table 12 presents the results of Friedman's ANOVA test.
Key points: Friedman's Chi-Square=100.568, p=0.000: There is a statistically significant difference between the items. Kendall's W=0.478: Indicates a moderate level of agreement among participants on how they rank the items.
Grand Mean=4.7710: The overall average score across all items. The results show that the items differ significantly, with moderate agreement in rankings among respondents.
c) Factor Analysis-KMO and Bartlett's Test
The Kaiser-Meyer-Olkin (KMO) Measure of Sampling Adequacy is a test developed by Kaiser [95] in 1970. This test is used to assess the suitability of data for factor analysis. Kaiser [95] was a psychologist and statistician who contributed to the development of statistical techniques, and one of his most well-known contributions is the development of this index to evaluate the adequacy of a sample for factor analysis.
Factor Analysis Results Interpretation:
i) Kaiser-Meyer-Olkin (KMO) Measure of Sampling Adequacy
The KMO (Table 13) value is 0.707, which indicates a moderate level of sampling adequacy. A KMO value between 0.5 and 0.7 is considered acceptable, suggesting that the data is suitable for factor analysis, but there may still be some room for improvement.
Table 13. KMO and Bartlett's test
|
Kaiser-Meyer-Olkin Measure of Sampling Adequacy. |
.707 |
|
|
Bartlett's Test of Sphericity |
Approx. Chi-Square |
732.42 |
|
df |
36 |
|
|
Sig. |
.000 |
|
ii) Bartlett's Test of Sphericity
The Chi-Square (Table 13), value is 732.42 with 36 degrees of freedom (df), and the Sig. value is 0.000. This result is statistically significant (p<0.05), meaning that the correlation matrix is not an identity matrix, and there are sufficient correlations among variables to perform factor analysis.
c) PCA tests
Table 14 indicates how much of the variance in each variable is explained by the extracted factors. Variables with high communalities, such as the ER (0.849) and CO (0.801), are strongly related to the factors.
In contrast, the tax variable has a lower communality (0.551), indicating a weaker relationship with the factors. This suggests that the extracted factors adequately describe the data for most of the variables.
Table 14. Communalities
|
|
Initial |
Extraction |
|
Foreign investor motivation-MFI |
1.000 |
.710 |
|
ER |
1.000 |
.849 |
|
Inflation rate-INF |
1.000 |
.645 |
|
Interest rate-IR |
1.000 |
.754 |
|
AC |
1.000 |
.648 |
|
CO |
1.000 |
.801 |
|
E-banking and banking system services-EBBSS |
1.000 |
.793 |
|
Economic growth-Egr |
1.000 |
.740 |
|
Taxes-Tax |
1.000 |
.551 |
|
Extraction Method: PCA. |
||
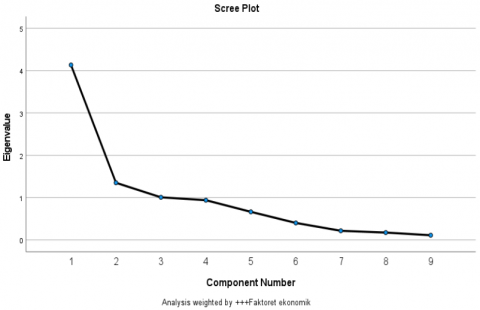
Table 15 presents the variance explained by each component in PCA, used by Kida et al. [96], originally introduced by Hotelling [97]. The first three components explain 73.09% of the total variance, suggesting that they are the most important factors in understanding the data. The remaining components (4-9) explain a smaller portion of the variance, indicating they have less influence on the overall data structure. The rotation process redistributed the variance explained by each component, but the overall variance explained by the three key components remained the same. Overall, the PCA suggests that the first three components are the most critical factors in understanding the underlying structure of the data, and the other components do not significantly contribute.
Table 15. Total variance explained
|
Component |
Initial Eigenvalues |
Rotation Sums of Squared Loadings |
||||
|
Total |
% of Variance |
Cumulative % |
Total |
% of Variance |
Cumulative % |
|
|
1 |
4.224 |
46.939 |
46.939 |
2.631 |
29.229 |
29.229 |
|
2 |
1.198 |
13.311 |
60.250 |
2.229 |
24.767 |
53.997 |
|
3 |
1.156 |
12.839 |
73.089 |
1.718 |
19.092 |
73.089 |
|
4 |
.840 |
9.333 |
82.422 |
|
|
|
|
5 |
.660 |
7.335 |
89.757 |
|
|
|
|
6 |
.404 |
4.487 |
94.244 |
|
|
|
|
7 |
.224 |
2.491 |
96.735 |
|
|
|
|
8 |
.181 |
2.010 |
98.744 |
|
|
|
|
9 |
.113 |
1.256 |
100.000 |
|
|
|
|
Extraction Method: PCA. |
||||||
As shown in Figure 9, the first two components number Economic factors (faktoret ekonomik) represent the majority of the variance, specifically 45.9% and 15%, which together account for 60.9% of the total variance. This indicates a significant reduction in the dependency between the original variables, transforming them into independent components. This result is crucial as it captures a large portion of the information, making the analysis process more efficient and reliable. Using these independent components, which hold the majority of the variance, helps eliminate the potential impact of multicollinearity and improves the accuracy of the analytical models that will be used later.
Figure 9. Scree Plot component number (variables factor economic and MFI)
Table 16. Rotated component matrixa
|
|
Component |
||
|
1 |
2 |
3 |
|
|
MFI |
-.038 |
-.041 |
-.801 |
|
ER |
.778 |
.441 |
.072 |
|
INF |
.258 |
.840 |
.031 |
|
Interest rate |
.862 |
.055 |
.183 |
|
AC |
.393 |
.523 |
.479 |
|
CO |
.775 |
.457 |
-.051 |
|
E-banking and banking system services |
.054 |
.803 |
.218 |
|
Economic growth |
.652 |
-.077 |
.511 |
|
Taxes |
.176 |
.436 |
.704 |
|
Extraction Method: PCA. Rotation Method: Varimax with Kaiser Normalization. |
|||
|
a. Rotation converged in 6 iterations. |
|||
Table 16 presents the rotated component matrix from PCA [98], highlighting three key components influencing foreign investor motivation in Kosovo:
This component includes variables that reflect the macroeconomic stability and policies that are fundamental for attracting foreign investment. The key factors are the ER (.778), interest rate (.862), CO (.775), and economic growth (.652). These elements are considered traditional macroeconomic factors, where economic stability, favorable financial rates, and a competitive environment are essential for encouraging foreign investors.
This component focuses on access to modern financial services and banking facilities, which are crucial for fostering a conducive investment environment. The factors included are INF (.840), e-banking and banking services (.803), and AC (.523). This component highlights the role of financial system development and digitalization in shaping the business climate for foreign investors.
This component emphasizes factors directly impacting the decision to start a business in Kosovo. It includes the motivation to start a business in Kosovo (-.801), taxes (.704), and economic growth (.511). It reflects the importance of both personal motivation and the fiscal environment, where the tax burden and the perception of Kosovo's economic attractiveness significantly influence foreign investors' decisions.
Table 17. Component matrixa
|
|
Component |
||
|
1 |
2 |
3 |
|
|
MFI |
.186 |
.696 |
.437 |
|
ER |
.840 |
-.086 |
.370 |
|
INF |
.700 |
.266 |
-.291 |
|
Interest Rate |
.699 |
-.497 |
.135 |
|
AC |
.778 |
.199 |
.043 |
|
CO |
.801 |
-.083 |
.390 |
|
E-banking and Banking Services |
.608 |
.319 |
-.567 |
|
Economic Growth |
.597 |
-.575 |
-.230 |
|
Taxes |
.664 |
.248 |
-.221 |
|
Extraction Method: PCA. a. 3 components extracted. |
|||
|
Source: The authors' calculations.
|
|||
Table 17 presents the component matrix, where three components are extracted to identify the key factors influencing foreign investors' motivation in Kosovo. The first component is associated with macroeconomic factors, including ER, AC, and CO. The second component highlights investor motivation, showing a negative impact from IR and slow economic growth. The third component is related to financial services and taxes, along with the negative effects of INF and IR. This analysis underscores the significant role that economic factors and financial services play in shaping foreign investors' motivation.
All diagonal values must be above 0.5 to be considered suitable for inclusion in the factor analysis.
The Anti-Image Correlation Matrix (Table 18), was used to evaluate the adequacy of each individual variable for factor analysis. The diagonal elements represent the Measures of Sampling Adequacy (MSA) for each variable. All MSA values are above the minimum acceptable threshold of 0.5, ranging from 0.633 (Economic growth) to 0.824 (Motivation to start a business in Kosovo). This indicates that all variables contribute adequately to the factor structure and are suitable for inclusion in the analysis.
Table 18. Anti-Image correlation matrix (Diagonal MSA values)
|
Variable |
MSA |
|
Motivation to start a business in Kosovo |
0.824 |
|
ER level |
0.768 |
|
INF |
0.711 |
|
Interest rate level |
0.685 |
|
AC |
0.777 |
|
CO |
0.712 |
|
E-banking and banking system services |
0.648 |
|
Economic growth |
0.633 |
|
Taxes |
0.646 |
However, some high off-diagonal correlations (e.g., between "ER level" and "CO": -0.727) suggest potential multicollinearity or overlap between variables, which should be considered during factor interpretation.
The Anti-Image Matrix, together with the KMO value of 0.683 and the statistically significant result of Bartlett's Test of Sphericity (Chi-Square =732.42, df=36, p< .001), supports the appropriateness of applying factor analysis on this dataset.
In the component plot (Figure 10), from p3 (MFI) to 8 independent variables (F1-F8), the nodes illustrate the relationship between the original variables and the components created after PCA. Each component explains a significant portion of the variance, and the nodes help identify the influence of each variable on the independent components. Variables that are closely related to each other are grouped together, while those that contribute more to the overall variance appear more distinct in the component plot. In this way, the created components help reduce the dependency between variables and highlight the key factors influencing the analysis results.
Figure 10. Component plot–Analysis weighted by economic factors
4.4 Testing study hypotheses
Hypothesis testing in this research uses multifactorial linear regression, specifically the Ordinary Least Squares (OLS) method, to measure the impact of economic factors on foreign investors' motivation in Kosovo [94]. The regression model applied is MLR, with multiple independent variables predicting the dependent variable.
4.4.1 Results of the multiple linear regression analysis for the first hypothesis
The MLR model elucidates how macroeconomic factors influence foreign investor motivation (MFI). It demonstrates that variables such as taxes, IR, INF, CO, modern banking services, economic growth, AC, and ER significantly affect MFI. Understanding these relationships is crucial for policymakers and businesses aiming to attract foreign investment and foster economic development.
The first Hypothesis H1: ER, INF, IR, AC, CO, e-banking and banking services (E-BBS), economic growth (EGr), and taxes (Tax) have a positive and statistically significant impact on the return of the motivation of foreign investors in Kosovo.
The represents the model summary for a regression analysis Table 19, specifically a multiple regression model. The MLR model indicates a moderate relationship between independent factors and the motivation of foreign investors (MFI), with an R value of 0.562. The R² value of 0.316 suggests that 31.6% of the variability in MFI is explained by the factors in the model. However, the adjusted R² of 0.277 implies that some variables may have limited impact. The F-statistic (Sig. F=0.000) confirms the overall statistical significance of the model.
However, the Durbin-Watson statistic of 0.366 indicates moderate positive autocorrelation, raising concerns about the reliability of the model for analysis. Durbin-Watson and Autocorrelation, as seen in Table 13, are more applicable to time-series data, where values are linked to different time periods for the same observational unit. In this study, the survey data are not time-series, but are collected from different individuals at the same time, and therefore, using the Durbin-Watson statistic (e.g., value 0.366) is not appropriate in this context. Instead, it is important to focus on the P-values for the coefficients in the model, which were analyzed to identify which factors truly influence the motivation of foreign investors (IMF). To support the reliability of the results and to verify the accuracy of the statistical methods used, several other important tests were also employed, which include: Cronbach’s Alpha Test: This test was used to assess the reliability of the scales used in this study. The Cronbach’s Alpha value helped measure the internal consistency of the questions and variables used. PCA was used to uncover the structure of the variables and to create a new variable for investor motivation. PCA helped reduce the dimensionality and focus on those components that explain the most variance in the data. KMO Test (Kaiser-Meyer-Olkin): This was used to check the adequacy of the data for PCA. The KMO test value helped evaluate the suitability of the sample for factor analysis. Barlett’s Test: This test was used to assess whether the data are sufficiently correlated to justify the use of PCA. A positive result from the test confirmed that the data were suitable for PCA. The use of these important tests helped ensure the quality of the model and supported the interpretation of the factors influencing the motivation of foreign investors, providing a reliable and robust analysis of the data.
Multicollinearity (VIF) (Table 19): Evaluated to determine whether some factors are highly correlated with each other, which may affect the stability of the model. To assess multicollinearity among the independent variables, Collinearity Statistics (Table 19), were examined using Tolerance and Variance Inflation Factor (VIF) values. All VIF values were found to be below the critical threshold of 4.0, ranging from 2.195 to 3.805, while Tolerance values remained above 0.2. These results indicate that multicollinearity is not a serious concern in the regression model and does not distort the estimation of coefficients. Therefore, no corrective measures such as variable elimination or transformation were deemed necessary.
Table 19. Coefficientsa
|
Model |
Unstandardized Coefficients |
Standardized Coefficients |
t |
Sig. |
Collinearity Statistics |
|||
|
B |
Std. Error |
Beta |
Tolerance |
VIF |
||||
|
1 |
(Constant) |
30.363 |
7.675 |
|
3.956 |
.000 |
|
|
|
ER |
2.584 |
.973 |
.408 |
2.656 |
.009 |
.208 |
3.805 |
|
|
INF |
2.734 |
1.152 |
.261 |
2.373 |
.019 |
.406 |
2.462 |
|
|
IR |
-3.144 |
1.625 |
-.232 |
-1.935 |
.055 |
.343 |
2.916 |
|
|
Access to Credit |
-5.575 |
1.291 |
-.495 |
-4.320 |
.000 |
.375 |
2.670 |
|
|
CO |
-1.210 |
.944 |
-.191 |
-1.282 |
.202 |
.222 |
4.512 |
|
|
E-banking and banking services |
-.643 |
.857 |
-.078 |
-.750 |
.455 |
.456 |
2.195 |
|
|
Economic Growth |
6.497 |
1.178 |
.601 |
5.513 |
.000 |
.413 |
2.419 |
|
|
Tax |
-.077 |
1.256 |
-.007 |
-.061 |
.951 |
.407 |
2.460 |
|
To assess the reliability of the instruments used, a reliability analysis was performed with Cronbach‘’s Alpha( Table 11), which measures the internal consistency of the survey questions. Also, Kaiser-Meyer-Olkin (KMO) (Tables 13 to Table 14) were used to assess the suitability of the data for factor analysis and PCA table to reduce the dimensions and identify the structure of the data. These analyses show that the instruments are reliable and appropriate for your study.
F Change: The value of 8.038 is the F-statistic (Table 20), which tests whether the regression model as a whole is statistically significant. Since it is relatively high, this suggests that the model fits the data well and that the independent variables jointly have a significant impact on the dependent variable. df1: This represents the number of predictors in the model, which is 8. These are the factors listed under the "Predictors" section. df2: This represents the degrees of freedom for the residuals, which is 139. It is calculated as the total number of observations (147) minus the number of predictors (8) minus 1 for the intercept.
Table 20. Model summaryb
|
Model |
R |
R Square |
Adjusted R Square |
Std. Error of the Estimate |
Change Statistics |
Durbin-Watson |
||||
|
R Square Change |
F Change |
df1 |
df2 |
Sig. F Change |
||||||
|
1 |
.562a |
.316 |
.277 |
10.27774% |
.316 |
8.038 |
8 |
139 |
.000 |
.366 |
|
a. Predictors: (Constant), Taxes, Interest rate, INF, CO, E-banking and banking system services, Economic growth, AC, ER. b. Dependent Variable: MFI |
||||||||||
Overall, the table suggests that the regression model explains a significant portion of the variation in investment growth, and the predictors together are significantly related to the dependent variable. However, since R² is 0.316, there may still be other factors influencing investment growth that are not included in this model.
The ANOVA results (Table 21) show that the regression model is statistically significant (F=8.038, p=0.000), indicating that the independent variables (taxes, IR, INF, CO, e-banking, economic growth, AC, ER) collectively influence foreign investors' motivation in Kosovo. The Regression Sum of Squares (6792.157) explains the variance, while the Residual Sum of Squares (14682.843) reflects unexplained variance. The strong F-value indicates a good model fit, and the p-value confirms the statistical significance of all variables. In conclusion, these factors significantly impact foreign investment decisions in Kosovo.
Table 21. ANOVAa
|
Model |
Sum of Squares |
df |
Mean Square |
F |
Sig. |
|
|
1 |
Regression |
6792.157 |
8 |
849.020 |
8.038 |
.000b |
|
Residual |
14682.843 |
139 |
105.632 |
|
|
|
|
Total |
21475.000 |
147 |
|
|
|
|
|
a. Dependent Variable: MFI. |
||||||
|
b. Predictors: (Constant), Taxes, Interest rate, INF, CO, E-banking and banking system services, Economic growth, AC, ER |
||||||
Residuals Statistics (Table 22) evaluates the regression model's quality for foreign investors' motivation in Kosovo (MFI). The predicted values range from 8.77% to 40.71%, with a mean of 25.5%, reflecting the distribution of investor motivation. Residuals range from -18.61% to 18.51%, with a mean of 0.00%, showing no systematic bias. Standardized residuals fall within the normal range (±2), indicating no extreme outliers. The small standard deviation of residuals (9.99%) suggests a balanced error distribution. These results confirm a good model fit and normal error distribution, explaining factors like INF, IR, credit access, and taxes. The data used in this study were collected through a structured questionnaire using a Likert scale, where respondents rated the importance of various factors influencing foreign investor motivation on a scale from 1 (not important at all) to 5 (very important).
Table 22. Residuals statisticsa
|
|
Minimum |
Maximum |
Mean |
Std. Deviation |
N |
|
Predicted Value |
8.7698% |
40.7077% |
25.5000% |
6.79744% |
148 |
|
Residual |
-18.61136% |
18.50949% |
0.00000% |
9.99416% |
148 |
|
Std. Predicted Value |
-2.461 |
2.237 |
.000 |
1.000 |
148 |
|
Std. Residual |
-1.811 |
1.801 |
.000 |
.972 |
148 |
|
a. Dependent Variable: MFI. |
|||||
To assess multicollinearity among the independent variables, Collinearity Statistics (Table 19) were examined using Tolerance and Variance Inflation Factor (VIF) values. According to general econometric rules, a VIF value above 10 is considered a strong indicator of problematic multicollinearity, whereas values below 5 are generally acceptable [94]. The cross-sectional data do not make it necessary to use VIF; other tests, which are mentioned earlier in the study, are more appropriate for assessing the reliability of data from structured questionnaires. However, since the MLR model has been used and VIF is part of it, its importance is not overlooked. It can be seen that the highest VIF value does not exceed 4.512, which indicates that it does not render the analysis unreliable.
$\begin{gathered}
\mathrm{MFE}=30.363+2.584 * \mathrm{X}_{(E R)}+2.734 * \mathrm{X}_{(\mathrm{INF})}+ \\
(-3.144) * \mathrm{X}_{(\mathrm{IR})}+(-5.575) * \mathrm{X}_{(\mathrm{ACt})}+(- \\
1.210) * \mathrm{X}_{(\mathrm{CO})}+(-.643) * \mathrm{X}_{(E-\mathrm{BBS})}+6.497 * \\
\mathrm{X}_{(\mathrm{EGr})}+(-.077) * \mathrm{X}_{(\mathrm{Tax})}=30.8 \%
\end{gathered}$ (24)
In Table 19, the MLR model explains the Motivation of Foreign Investors (MFE) based on macroeconomic variables. This model shows that some variables, such as economic growth, INF, and ER, have a positive and strong impact on attracting investors, while factors like IR, AC, CO, and taxes have negative effects. To enhance the motivation of foreign investors, these factors must be managed to create a more attractive investment environment. However, only 30.8% of the variation in their motivation depends on these factors, indicating the presence of other influencing elements not included in the analysis. Here is an explanation for each variable:
Constant (30.363): This is the intercept or base value of the dependent variable (MFE) when all the independent variables are zero. In other words, if all the economic variables (like ER, INF, etc.) are zero, the model predicts a baseline motivation of 30.363 for foreign investors. ER (2.584): For every unit increase in the ER, the foreign investors' motivation (MFE) increases by 2.584 units, assuming all other variables remain constant. This suggests that a higher ER positively impacts foreign investment motivation. INF (2.734): For every unit increase in INF, the motivation of foreign investors increases by 2.734 units, assuming all other factors remain unchanged. This shows that INF might be associated with higher motivation for foreign investment in Kosovo. IR (-3.144): For every unit increase in IR, the foreign investors' motivation decreases by 3.144 units. This negative relationship indicates that higher IR tend to deter foreign investors, likely due to increased borrowing costs. AC (Beta: -5.575): This coefficient suggests that more limited access to credit has a significant negative impact on investor motivation. The very small p-value (0.000) indicates that this factor has a strong and economically significant influence. When investors face difficulties in securing the necessary financing, they may have less motivation to invest. CO (-1.210): As competition in the market increases, foreign investors' motivation decreases by 1.210 units. High levels of competition might discourage investors, as they perceive it as harder to secure market share or achieve profitability. E-banking and Banking Services (-0.643): A rise in E-BBS or the quality of banking services is associated with a decrease in investor motivation by 0.643 units, which could imply that investors are less reliant on banking services, or that better services might lead to lower perceived risks, reducing the need for high investor motivation. Economic Growth (6.497): For every unit increase in economic growth, foreign investor motivation increases by 6.497 units. This highlights the strong positive impact of a growing economy on attracting foreign investment. Taxation (-0.077): For every unit increase in tax rates, foreign investor motivation decreases by 0.077 units. Although this effect is relatively small, it suggests that higher taxes might discourage investment. Overall Summary: The variables with the strongest and most significant positive impact on foreign investor motivation are Economic Growth (Beta=6.497), ER (Beta=2.584), and INF (Beta=2.734).
This indicates that economic factors such as economic growth, investment opportunities, and ER stability are crucial for attracting foreign investors. On the other hand, IR, AC, CO, and Taxes have a negative impact on investor motivation. The model suggests that fostering economic growth and managing inflation could be effective in boosting foreign investment, while reducing barriers such as high IR and taxes could further enhance investment attractiveness.
4.4.2 The testing second hypothesis
Hipoteza e dytë testohet përmes testit jo-parametrik Kendall's Tau_b.
To analyze the relationship between ordinal variables, this study applies the non-parametric statistical test Kendall's tau_b. This test assesses the strength and direction of the association between two ordinal variables, while also accounting for tied ranks, making it more appropriate than Spearman's rho in certain cases, applied also by Kida [99]. The coefficient value ranges from -1 to +1, where positive values indicate a direct relationship, and negative values indicate an inverse one. This test was used to evaluate the second hypothesis, which concerns the relationship between the motivation of foreign investors and the factors related to the economic environment in Kosovo.
H2: There is a positive and statistically significant relationship between ER, INF, IR, AC, CO, e-banking and banking services, economic growth, and the motivation of foreign investors in Kosovo.
Table 23. Correlation Kendall's tau_b
|
|
MFI |
ER |
INF |
IR |
AC |
CO |
EBSSB |
EGr |
||
|
Kendall's tau_b |
MFI |
Correlation Coefficient |
1 |
.154* |
0.105 |
0.054 |
.177* |
.135* |
0.13 |
-0.085 |
|
Sig. (2-tailed) |
|
0.026 |
0.136 |
0.445 |
0.012 |
0.044 |
0.057 |
0.217 |
||
|
N |
148 |
148 |
148 |
148 |
148 |
148 |
148 |
148 |
||
|
ER |
Correlation Coefficient |
.154* |
1 |
.490** |
.496** |
.601** |
.671** |
.294** |
.352** |
|
|
Sig. (2-tailed) |
0.026 |
. |
0 |
0 |
0 |
0 |
0 |
0 |
||
|
N |
148 |
148 |
148 |
148 |
148 |
148 |
148 |
148 |
||
|
INF |
Correlation Coefficient |
0.105 |
.490** |
1 |
.396** |
.374** |
.442** |
.611** |
.196** |
|
|
Sig. (2-tailed) |
0.136 |
0 |
. |
0 |
0 |
0 |
0 |
0.006 |
||
|
N |
148 |
148 |
148 |
148 |
148 |
148 |
148 |
148 |
||
|
IR |
Correlation Coefficient |
0.054 |
.496** |
.396** |
1 |
.377** |
.504** |
.303** |
.655** |
|
|
Sig. (2-tailed) |
0.445 |
0 |
0 |
. |
0 |
0 |
0 |
0 |
||
|
N |
148 |
148 |
148 |
148 |
148 |
148 |
148 |
148 |
||
|
AC |
Correlation Coefficient |
.177* |
.601** |
.374** |
.377** |
1 |
.418** |
.208** |
.358** |
|
|
Sig. (2-tailed) |
0.012 |
0 |
0 |
0 |
. |
0 |
0.003 |
0 |
||
|
N |
148 |
148 |
148 |
148 |
148 |
148 |
148 |
148 |
||
|
CO |
Correlation Coefficient |
.135* |
.671** |
.442** |
.504** |
.418** |
1 |
.287** |
.237** |
|
|
Sig. (2-tailed) |
0.044 |
0 |
0 |
0 |
0 |
. |
0 |
0 |
||
|
N |
148 |
148 |
148 |
148 |
148 |
148 |
148 |
148 |
||
|
EBSSB |
Correlation Coefficient |
0.13 |
.294** |
.611** |
.303** |
.208** |
.287** |
1 |
.189** |
|
|
Sig. (2-tailed) |
0.057 |
0 |
0 |
0 |
0.003 |
0 |
. |
0.006 |
||
|
N |
148 |
148 |
148 |
148 |
148 |
148 |
148 |
148 |
||
|
EGr |
Correlation Coefficient |
-0.085 |
.352** |
.196** |
.655** |
.358** |
.237** |
.189** |
1 |
|
|
Sig. (2-tailed) |
0.217 |
0 |
0.006 |
0 |
0 |
0 |
0.006 |
. |
||
|
N |
148 |
148 |
148 |
148 |
148 |
148 |
148 |
148 |
||
Based on the Kendall's Tau-b correlation table (Table 23), the following variables exhibit statistically significant correlations with Foreign Investor Motivation (MFI) at the 0.05 significance level:
i) ER: τ=0.154, p=0.026;
ii) AC: τ=0.177, p=0.012;
iii) CO: τ=0.135, p=0.044.
These findings suggest that MFI is positively associated with ER, AC, and CO. However, the correlation coefficients are relatively small, indicating weak associations. Nonetheless, the statistical significance of these correlations implies that they are unlikely to be due to random chance.
The other variables—INF, IR, E-banking & Banking Services (EBSSB), and Economic Growth Rate (EgR)—do not show statistically significant correlations with MFI, as their p-values exceed the 0.05 threshold.
In summary, while MFI is weakly correlated with ER, AC, and CO, these relationships are statistically significant, suggesting that these factors may influence foreign investor motivation. However, the weak strength of these correlations indicates that other unexamined variables may also play a significant role in determining MFI.
These findings suggest that improving AC and stabilizing the ER can positively influence foreign investor motivation. Additionally, managing interest rates and inflation can create a more favorable investment climate.
In summary, the Kendall's Tau-b correlation analysis supports the regression results, emphasizing the importance of macroeconomic stability and financial accessibility in attracting foreign investments. Based on these points, the second hypothesis can be partially supported, as most of the variables show positive and statistically significant correlations. However, some variables, such as interest rates and E-BBS, do not fully align with the hypothesis, which weakens its complete support.
This study applies the theories of Dunning [45] and Hymer [1] to analyze the impact of macroeconomic factors on the motivation of foreign investors (FIM) in Kosovo. The findings reinforce the key concepts of these authors, particularly Dunning's theory of location advantage and Hymer's internalization theory. The analysis showed that factors such as economic growth and ER stability play significant roles in motivating foreign investors, aligning with Dunning's assertions about the importance of a country's economic conditions in attracting investment. Likewise, Hymer's theory is reflected, as investors often seek to exploit advantages unavailable in their home markets, which may explain their preference for countries with stable and growing economies.
This study analyzed macroeconomic factors influencing foreign investor motivation (FIM). The key findings are: Economic Growth: Strongest positive impact (B=6.497, p<0.001), indicating that GDP growth enhances investor confidence. ER: Significant positive effect (B=2.584, p=0.009), highlighting the importance of currency stability. INF: Notable positive influence (B=2.734, p=0.019), suggesting that predictable inflation is acceptable to investors. AC: Strong negative effect (B=-5.575, p<0.001), emphasizing that limited credit access deters investment. IR: Marginal negative impact (B=-3.144, p=0.055), implying that higher IR may reduce investment motivation. The regression results suggest that macroeconomic stability and financial accessibility are the most influential factors in driving foreign investor motivation.
Specifically: Strong economic growth and a stable ER increase confidence among investors; Limited AC and potentially high IR are deterrents; Interestingly, tax policies and banking infrastructure are perceived as less critical by respondents, potentially due to other overriding concerns or expectations. The regression model suggests that foreign investors are primarily motivated by: Economic growth; Stability of the ER; Manageable inflation; AC. Factors that appear to have no significant impact on the decision to invest: Taxation; Modern banking services; Market competition.
5.1 Comparison with previous studies
5.1.1 Comparison of study findings with existing literature
The ER has a positive and statistically significant effect on FDI in Kosovo (B=2.584, p=0.009). An increase in the ER makes Kosovo more attractive to foreign investors. Our study aligns with Eichengreen [100] and Madaki et al. [68], supporting the idea that ER play a key role in attracting FDI. However, Erlina and Sitorus [66] found no significant impact, suggesting regional differences. The INF has a significant and positive effect on FDI in Kosovo (B=2.734, p=0.019). INF may signal increased demand or economic adjustment, attracting investors. This study supports by Eichengreen [100] but contradicts by Singhal and Kumar [101], who found no significant impact on FDI inflows. According to Alfaro [102], INF, openness, and exchange-rate regimes are key factors in determining short-term commitments for economic stability. This suggests that INF's impact on FDI varies by region and type of investment. The Interest Rate has a negative, but marginally significant relationship with FDI (B=-3.144, p=0.055). High-IR discourage investment due to the high borrowing costs. Our findings suggest a weak, negative impact of IR on FDI, aligning with Madaki et al. [68], who also reports a minimal impact. AC has a strong negative impact on FDI in Kosovo (B=-5.575, p=0.000). The lack of favorable AC is a major barrier to foreign investments. The study aligns with Bénassy-Quéré et al. [65] and Khan et al. [67], reinforcing the idea that financial access plays a critical role in attracting FDI. CO has a negative but insignificant effect on FDI in Kosovo (B=-1.210, p=0.202). Our comparison finds that competition is not a significant factor for Kosovo, while Yiu et al. [79] suggest that competition in the home country affects FDI. This indicates that the impact of CO on FDI may vary between countries. Banking Services & E-Banking show a negative but insignificant effect on FDI in Kosovo (B=-0.643, p=0.455). Our study contradicts Bénassy-Quéré et al. [65], suggesting that banking services may not be a decisive factor for foreign investors in Kosovo. Economic Growth is considered the most important factor for FDI (B=6.497, p=0.000). Dunning [45] assert that stable economic conditions promote long-term investments. In the context of FDI, macroeconomic factors such as inflation, trade openness, and exchange rate regimes have been shown to significantly influence investment decisions [102], while recent studies emphasize that attracting multinational enterprises also depends on firm-level selection criteria and institutional hurdles [103].
Similarly, Zogjani et al. [104] found that GDP growth is crucial for FDI in GCC countries. Our study supports Dunning [46], Alfaro et al. [102], and Zogjani et al. [104], reinforcing the fact that economic growth is a key driver of FDI in Kosovo. The impact of Taxes is negligible, even though it is negative (B=-0.077) and statistically insignificant (p=0.951) on FDI in Kosovo. Desai et al. [69] argue that corporate income tax rates reduce profit rates of foreign branches. Our study contradicts Desai et al. [69], suggesting that taxes are not a key determinant for FDI in Kosovo, whereas they find it to be an important factor. Our findings largely align with key studies on the impact of ER, INF, AC, and economic growth on FDI. However, there are differences regarding competition, banking services, and taxes, suggesting that factors affecting FDI may be region-specific.
The variables with the strongest and most significant positive impact on foreign investor motivation are Economic Growth (Beta=6.497), ER (Beta=2.584), and INF (Beta=2.734). This indicates that economic factors such as economic growth, investment opportunities, and ER stability are crucial for attracting foreign investors. On the other hand, IR, AC, CO, and Taxes have a negative impact on investor motivation. The model suggests that fostering economic growth and managing inflation could be effective in boosting foreign investment, while reducing barriers such as high IR and taxes could further enhance investment attractiveness.
5.1.2 Theoretical explanations
The findings align with Dunning's OLI framework (Ownership, Location, and Internalization), where location-specific factors such as economic growth and ER stability are crucial for attracting foreign investors. Dunning argues that investors are more likely to invest in countries that offer competitive advantages, such as stable economies and favorable ER. Additionally, Hymer's internalization theory explains that foreign investors seek to exploit advantages offered by host countries, such as economic growth, while avoiding risks associated with operating in insecure or highly competitive environments.
5.1.3 The causal mechanism
In this study suggests that macroeconomic stability, driven by factors like economic growth and ER stability, plays a critical role in attracting foreign investment. Furthermore, AC and manageable inflation are seen as enablers of investment. High IR and limited credit access act as barriers, reducing the attractiveness of a country for foreign investors.
This study reinforces the importance of stable economic conditions, including economic growth and ER stability, in motivating foreign investors. The findings also highlight the significance of financial accessibility and manageable inflation, while showing that interest rates and competition are not major factors in the context of Kosovo. These conclusions offer valuable implications for policies aimed at attracting and retaining foreign investments in Kosovo.
This study examines the impact of economic factors on the motivation of foreign investors in Kosovo, identifying key variables that significantly influence investment decisions. Through regression and correlation analysis, the relationships between these factors and investments have been evaluated, leading to important findings with implications for economic policies and the country's future development. Kosovo holds considerable potential to attract foreign investment due to its favorable geographical location, privatization of public enterprises, a young and multilingual workforce, and abundant natural resources. However, the level of FDI remains relatively low. After a decline in FDI (with only €145 million in 2014), FDI reached €657.3 million in the period from January to September 2024, showing an increase of €38.5 million or about 6.2% compared to the same period in 2023 (www.bqk-ks.org). Despite this growth, FDI is still insufficient to meet Kosovo's developmental needs. However, expectations for 2025 are positive, driven by economic stability and the potential for visa liberalization by the EU. Despite these prospects, Kosovo faces persistent economic challenges such as high interest rates, limited AC, and underdeveloped banking services, which hinder further investment growth. The results from the MLR model show that economic factors like economic growth, inflation, and taxation positively impact investor motivation. In contrast, competition and ER have a negative but insignificant effect. Investors prefer digital and innovative banking services that enhance credit access and reduce the costs of international transfers. To improve the investment climate, policy efforts should focus on high-potential sectors such as manufacturing, mining, and energy, while aligning ER policies to encourage FDI. Moreover, the Kosovo Investment Promotion Agency (IPAK) should prioritize sectors where Kosovo holds competitive advantages, such as infrastructure and natural resources. Furthermore, enhancing the business environment, establishing transparent systems for managing complaints, and increasing competition in the banking sector are crucial to attracting investors. Policies should also concentrate on improving AC for investors and fostering a sustainable, growing economy. Managing inflation is critical as it helps shape investor expectations and improves the overall investment climate. While taxes and banking services have a relatively minor impact in this study, ongoing reforms in these areas could further enhance the business environment in the long term. Ultimately, Kosovo's foreign investment growth seems to be influenced by macroeconomic factors like economic growth, ER, and INF, with barriers like credit access remaining significant obstacles. Addressing these challenges and creating a favorable economic environment could attract more foreign investment.
6.1 Policy implications and future research suggestions
Based on the results of this study, the following recommendations can be made to improve the climate for foreign investments in Kosovo: improving AC by creating easier borrowing opportunities with favorable terms, stabilizing the ER to create a more favorable environment for investments, encouraging economic growth by supporting sustainable growth and the diversification of economic sectors, reducing the fiscal burden by creating a stable and predictable fiscal system, improving infrastructure and competition, particularly in banking services and the service sector, and managing inflation through sustainable macroeconomic policies while ensuring transparency in public administration. In conclusion, addressing macroeconomic barriers such as AC, ER stability, economic growth, fiscal policy, infrastructure, and transparency will help attract foreign investments and contribute to creating a more favorable investment climate in Kosovo. "The government should further develop information portals for foreign investors [105].
6.2 Policy implications and future research suggestions
Based on the results of this study, the following recommendations can be made to improve the climate for foreign investments in Kosovo: improving AC by creating easier borrowing opportunities with favorable terms, stabilizing the ER to create a more favorable environment for investments, encouraging economic growth by supporting sustainable growth and the diversification of economic sectors, reducing the fiscal burden by creating a stable and predictable fiscal system, improving infrastructure and competition, particularly in banking services and the service sector, and managing inflation through sustainable macroeconomic policies while ensuring transparency in public administration. In conclusion, addressing macroeconomic barriers such as AC, ER stability, economic growth, fiscal policy, infrastructure, and transparency will help attract foreign investments and contribute to creating a more favorable investment climate in Kosovo.
6.3 Limitations
For future research, expanding the sample to include a broader range of foreign investors could provide a more comprehensive understanding of investment motivation. Additionally, incorporating detailed data on government policies and regulations affecting investor decisions would enhance the analysis. Using primary data from a larger number of companies operating in Kosovo over a 20-year period would help identify long-term trends and changes in investor behavior, ensuring more stable and reliable results. Furthermore, interviews with public sector experts and major investors could add depth to the study by offering diverse perspectives on factors not included in this research. A panel econometric approach could also be applied to compare the impact of economic factors on foreign investor motivation in Kosovo with neighboring countries. Moreover, the Dynamic Panel Data Model (GMM-Generalized Method of Moments) could be used to address endogeneity issues and capture the dynamic effects of key economic variables on FDI. This would ensure a more detailed and reliable analysis of the impact of economic factors and government policies on FDI.
Remzi Smajli, Nakije Kida, Vesa Morina, Julinda Morina, Florije Miftari: Validation, Supervision, Writing–original draft, Methodology. Nakije Kida, Remzi Smajli, Medain Hashani, Vesa Morina, Julinda Morina, Florije Miftari. Albana Pasjaqa: Writing – review and editing, Nakije Kida, Vesa Morina dhe Julinda Morina; Writing–original draft, Visualization. Remzi Smajli, Medain Hashani, Vesa Morina and Julinda Morina, Nakije Kida, Florije Miftari, Albana Pasjaqa: Software, Sources, Project administration, Conceptualization. Remzi Smajli, Medain Hashani, Nakije Kida, Julinda Morina, Remzi Smajli and Vesa Morina: Methodology, Investigation, Formal analysis, Data curation.
Our gratitude to the AAB College for funding the scientific article.
Structured Questionnaire
The structured questionnaire used in this study includes the following sections based on the title of the paper: "The External Economic Environment an Attractive Factor for Foreign Direct Investment in Kosovo: An Econometric Analysis".
Section 1: Demographics
Section 2: Perception of the External Business Environment for Foreign Investors Operating in Kosovo
Motivation of Foreign Investors for Starting a Business in Kosovo (dependent variable - MFI)
Please indicate your level of agreement or disagreement with the following statements about what motivated you to start a business in Kosovo.
1 (Very Negative) | 2 (Negative) | 3 (Somewhat Negative) | 4 (Neutral) | 5 (Somewhat Positive) | 6 (Positive) | 7 (Very Positive)
|
Factor Rating (1-7) |
|
|
Easy access to local markets |
[ ] |
|
Size of the available market |
[ ] |
|
Availability of workforce |
[ ] |
|
Availability of natural resources |
[ ] |
|
Low competition in the market |
[ ] |
|
Low cost of doing business |
[ ] |
|
Easy access to market information |
[ ] |
|
Healthy economic policies |
[ ] |
|
Poor business environment in Kosovo |
[ ] |
|
Government support for export promotion |
[ ] |
|
Simple government regulations for foreign businesses |
[ ] |
|
Simple regulations for imports |
[ ] |
|
Influence from friends and family members |
[ ] |
|
Encouragement from local businesses in Kosovo |
[ ] |
|
The culture of the Albanian people |
[ ] |
|
FDI from other markets |
[ ] |
Section 3: Economic Factors (Independent variables)
Please indicate how negative or positive you feel about each of the following factors while doing business in Kosovo. (Indicate: 1 means very negative and 7 means very positive for each of the following factors).
Economic Factors (Independent Variables):
1 (Very Negative) | 2 (Negative) | 3 (Somewhat Negative) | 4 (Neutral) | 5 (Somewhat Positive) | 6 (Positive) | 7 (Very Positive)
|
Economic Factor Rating (1-7) |
|
|
Exchange Rate-ER |
[ ] |
|
Inflation Rate-INF |
[ ] |
|
Interest Rate-IR |
[ ] |
|
Access to Credit-AC |
[ ] |
|
Competition-Co |
[ ] |
|
E-Banking and Banking System Services – E-BBSS |
[ ] |
|
Economic Growth-Egr |
[ ] |
|
Taxes-Tax |
[ ] |
[1] Hymer, S.H. (1976). The International Operations of National Firms: A Study of Direct Foreign Investment. Cambridge, MA: MIT Press. https://dspace.mit.edu/handle/1721.1/27375.
[2] Dunning, J.H. (1977). Trade, location of economic activity and the MNE: A search for an eclectic approach. In: The International Allocation of Economic Activity: Proceedings of A Nobel Symposium Held at Stockholm. London: Palgrave Macmillan UK, pp. 395-418. https://doi.org/10.1007/978-1-349-03196-2_38
[3] Dunning, J.H. (2015). The eclectic paradigm of international production: A restatement and some possible extensions. In: The Eclectic Paradigm: A Framework for Synthesizing and Comparing Theories of International Business from Different Disciplines or Perspectives. Palgrave Macmillan, London, pp. 50-84. https://doi.org/10.1007/978-1-137-54471-1_3
[4] Buckley, P.J. (1985). A critical view of theories of the multinational enterprise. In: The Economic Theory of The Multinational Enterprise. London: Palgrave Macmillan UK, pp. 1-19. https://doi.org/10.1007/978-1-349-05242-4_1
[5] Coase, R.H. (1937). The nature of the Firm. Economica, 4: 386-405. https://doi.org/10.1111/j.1468-0335.1937.tb00002.x
[6] Kaldor, N. (1937). Annual survey of economic theory: The recent controversy on the theory of capital. Econometrica, Journal of the Econometric Society, 201-233. https://doi.org/10.2307/1905512
[7] Robinson, J. (1934). What is perfect competition? The Quarterly Journal of Economics, 49(1): 104-120. https://doi.org/10.2307/1883878
[8] Dunning, J.H., Rugman, A.M. (1985). The influence of Hymer’s dissertation on the theory of foreign direct investment. The American Economic Review, 75(2): 228-232. http://www.jstor.org/stable/1805601
[9] Buckley, P.J. (2016). The contribution of internalisation theory to international business: New realities and unanswered questions. Journal of World Business, 51(1): 74-82. https://doi.org/10.1016/j.jwb.2015.08.012
[10] UNCTAD. (2024). World investment report 2024. https://unctad.org/publication/world-investment-report-2024.
[11] International Monetary Fund. (2024). Country: Republic of Kosovo. https://www.imf.org/en/Countries/KOS.
[12] Central Bank of Kosovo. (2024). Annual Report 2024. https://bqk-kos.org/.
[13] Official Gazette of the Republic of Kosovo. (2014). Law No. 04/L-220 on foreign investments. https://gzk.rks-gov.net/ActDetail.aspx?ActID=2425.
[14] Official Gazette of the Republic of Kosovo. (2017). Law No. 05/L-079 on strategic investments in the Republic of Kosovo. https://gzk.rks-gov.net/ActDetail.aspx?ActID=13319.
[15] Constitutional Court. (2016). Constitutional review of law No. 05/L-079 on strategic investments in the republic of Kosovo. Case No. KO 120/16. https://gjk-ks.org/wp-content/uploads/vendimet/gjk_ko_120_16_shq.pdf.
[16] Official Gazette of the Republic of Kosovo. (2024). Law No. 08/L-209 on sustainable investments. https://gzk.rks-gov.net/ActDocumentDetail.aspx?ActID=96277.
[17] KIESA. (2024). Invest in Kosovo. https://kiesa.rks-gov.net/.
[18] EIC. (2022). EU industry weeks. Kosovo 2022. Key take-aways and result. https://eic-kos.eu/publications/brochures/eu-industry-weeks-kosovo-2022/.
[19] Ministry of Industry, Entrepreneurship, and Trade. (2024). Division of strategic investments. https://mint.rks-gov.net/page.aspx?id=1,400.
[20] European Investors Council. (2014). An association of the leading foreign investors in the country. https://eic-kos.eu/.
[21] European Commission. (2016). Stabilisation and association agreement (SAA) between the European Union and Kosovo enters into force. European Commission. https://ec.europa.eu/commission/presscorner/detail/en/ip_16_1184.
[22] European Commission. (2024). Kosovo report 2024: Enlargement and eastern neighbourhood. https://enlargement.ec.europa.eu/document/download/c790738e-4cf6-4a43-a8a9-43c1b6f01e10_en?filename=Kosovo%20Report%202024.pdf.
[23] Osservatorio Balcani E Caucaso Transeuropa. (2025). Kosovo and CEFTA: Strengthening regional trade integration. https://www.balcanicaucaso.org/aree/Kosovo.
[24] Tax Administration of Kosovo. (2025). Double taxation agreements. https://www.atk-ks.org/en/agreements/double-taxation-agreements/https://www.atk-ks.org/en/agreements/double-taxation-agreements/.
[25] U.S. Department of State. (2024, tetor 30). 2024 Investment climate statements: Kosovo. https://www.state.gov/reports/2024-investment-climate-statements/kosovo/.
[26] Government of Kosovo. (2024). Reform agenda of Kosovo under the EU reform and growth facility for the western Balkans. https://kryeministri.rks-gov.net/wp-content/uploads/2024/10/RGF-Kosovo-Reform-Agenda.pdf.
[27] Agency for Business Registration in Kosovo, 2023. (2024). Business Registration in Kosovo. https://arbk.rks-gov.net/.
[28] Le, H.T.P., Pham, H., Do, N.T.T., Duong, K.D. (2024). Foreign direct investment, total factor productivity, and economic growth: Evidence in middle-income countries. Humanities and Social Sciences Communications, 11(1): 1-11. https://doi.org/10.1057/s41599-024-03462-y
[29] Adams, S. (2009). Foreign direct investment, domestic investment, and economic growth in Sub-Saharan Africa. Journal of Policy Modeling, 31(6): 939-949. https://doi.org/10.1016/j.jpolmod.2009.03.003
[30] Agosin, M., Mayer, R. (2000). Foreign investment in developing countries: Does it crowd in domestic investment? UNCTAD Discussion, p. 146. https://unctad.org/system/files/official-document/dp_146.en.pdf.
[31] Harrison, A.E., McMillan, M.S. (2003). Does direct foreign investment affect domestic credit constraints? Journal of International Economics, 61(1): 73-100. https://doi.org/10.1016/S0022-1996(02)00078-8
[32] Sharma, U., Changkakati, B. (2022). Dimensions of global financial inclusion and their impact on the achievement of the United Nations development goals. Borsa Istanbul Review, 22(6): 1238-1250. https://doi.org/10.1016/j.bir.2022.08.010
[33] Burlea‐Schiopoiu, A., Brostescu, S., Popescu, L. (2023). The impact of foreign direct investment on the economic development of emerging countries of the European Union. International Journal of Finance & Economics, 28(2): 2148-2177. https://doi.org/10.1002/ijfe.2530
[34] Alnaa, S.E., Ahiakpor, F. (2020). Exchange rate volatility and foreign direct investment. Research in Applied Economics, 12(3): 38-50. https://doi.org/10.5296/rae.v12i3.17737
[35] Ignatius, A.E., Ogbonna, A.A., Maduca, A.C. (2019). Exchange rate volatility and foreign direct investment: The Nigerian experience. Journal of Business and Economic Policy, 6(4): 78-87. https://doi.org/10.30845/jbep.v6n4p10
[36] Baek, I.M., Okawa, T. (2001). Foreign exchange rates and Japanese foreign direct investment in Asia. Journal of Economics and Business, 53(1): 69-84. https://doi.org/10.1016/S0148-6195(00)00038-2
[37] Oman, C.P. (2000). Policy competition for foreign direct investment: A study of competition among governments to attract FDI. OECD Development Centre Studies. https://doi.org/10.1787/9789264181083-en
[38] Loncan, T. (2023). Product market competition and FDI decisions. Journal of Financial and Quantitative Analysis, 58(6): 2617-2656. https://doi.org/10.1017/S0022109022000679
[39] Zekarias, S.M. (2016). The impact of foreign direct investment (FDI) on economic growth in Eastern Africa: Evidence from panel data analysis. Applied Economics and Finance, 3(1): 145-160. http://doi.org/10.11114/aef.v3i1.1317
[40] Fernandes, A. (2024). Impact of foreign direct investment (FDI) on economic growth: A study of Brazil. International Journal of Economics, 9: 31-41. https://doi.org/10.47604/ijecon.2442
[41] Kanval, N., Ihsan, H., Irum, S., Ambreen, I. (2024). Human capital formation, foreign direct investment inflows, and economic growth: A way forward to achieve sustainable development. Journal of Management Practices, Humanities and Social Sciences, 8(3): 48-61. https://doi.org/10.33152/jmphss-8.3.5
[42] Emeka, I. (2024). Foreign direct investment (FDI) and economic growth in Nigeria. Journal of Poverty, Investment and Development, 9(1): 13-25. https://doi.org/10.47604/jpid.2584
[43] OECD. (1999). Benchmark definition of foreign direct investment. Edition, T. https://www.oecd.org/content/dam/oecd/en/publications/reports/1996/11/oecd-benchmark-definition-of-foreign-direct-investment_g1gh5da0/9789264064805-en.pdf.
[44] Dunning, J.H. (1980). Toward an eclectic theory of international production: Some empirical tests. In The Eclectic Paradigm. Palgrave Macmillan, London. https://doi.org/10.1007/978-1-137-54471-1_2
[45] Dunning, J.H. (2000). Regions, Globalization, and the Knowledge-Based Economy. OUP Oxford. http://doi.org/10.1093/0199250014.001.0001
[46] Dunning, J.H., Lundan, S.M. (2008). Multinational Enterprises and the Global Economy (2nd ed.). Edward Elgar Publishing. https://pdfs.semanticscholar.org/a921/3b12d20efd3eeee76cbdb31e7d96662fc0fc.pdf.
[47] Globerman, S., Shapiro, D. (2003). Governance infrastructure and US foreign direct investment. Journal of International Business Studies, 34: 19-39. https://doi.org/10.1057/palgrave.jibs.8400001
[48] North, D.C. (1990). A transaction cost theory of politics. Journal of Theoretical Politics, 2(4): 355-367. https://doi.org/10.1177/0951692890002004001
[49] Blomström, M., Kokko, A., Globerman, S. (2001). The determinants of host country spillovers from foreign direct investment: A review and synthesis of the literature. In Inward Investment Technological Change and Growth: The Impact of Multinational Corporations on The UK Economy. Palgrave Macmillan, London, pp. 34-65. https://doi.org/10.1057/9780230598447_2
[50] Blomström, M., Kokko, A., Mucchielli, J.L. (2003). The economics of foreign direct investment incentives. In Foreign Direct Investment in The Real and Financial Sector of Industrial Countries. Berlin, Heidelberg: Springer Berlin Heidelberg, pp. 37-60. https://doi.org/10.1007/978-3-540-24736-4_3
[51] Borensztein, E., De Gregorio, J., Lee, J.W. (1998). How does foreign direct investment affect economic growth? Journal of International Economics, 45(1): 115-135. https://doi.org/10.1016/S0022-1996(97)00033-0
[52] Aizenman, J., Noy, I. (2006). FDI and trade-Two-way linkages? The Quarterly Review of Economics and Finance, 46(3): 317-337. https://doi.org/10.1016/j.qref.2006.02.004
[53] Edwards, S. (1990). Capital flows, foreign direct investment, and debt-equity swaps in developing countries. https://doi.org/10.3386/w3497
[54] Hermes, N., Lensink, R. (2003). Foreign direct investment, financial development and economic growth. The Journal of Development Studies, 40(1): 142-163. https://doi.org/10.1080/00220380412331293707
[55] Buckley, P.J., Hashai, N. (2009). Formalizing internationalization in the eclectic paradigm. Journal of International Business Studies, 40: 58-70. https://doi.org/10.1057/palgrave.jibs.8400421
[56] Cantwell, J., Narula, R. (2001). The eclectic paradigm in the global economy. International Journal of The Economics of Business, 8(2): 155-172. https://doi.org/10.1080/13571510110051504
[57] Narula, R. (2010). Keeping the eclectic paradigm simple. Multinational Business Review, 18(2): 35-50.
[58] Wagner, C. (2020). Deducing a state-of-the-art presentation of the Eclectic Paradigm from four decades of development: A systematic literature review. Management Review Quarterly, 70(1): 51-96. https://doi.org/10.1007/s11301-019-00160-x
[59] Brouthers, K.D., Brouthers, L.E., Werner, S. (1996). Dunning's eclectic theory and the smaller firm: The impact of ownership and locational advantages on the choice of entry-modes in the computer software industry. International Business Review, 5(4): 377-394. https://doi.org/10.1016/0969-5931(96)00019-4
[60] Nayyar, R. (2018). Advancing research on the determinants of Indian MNEs: The role of sub-national institutions. International Journal of Emerging Markets, 13(3): 536-556.
[61] Lall, S., Narula, R. (2009). Understanding FDI-Assisted Economic Development. Routledge, p. 298.
[62] Gaur, A., Kumar, V. (2010). Internationalization of emerging market firms: A case for theoretical extension. In: The Past, Present and Future of International Business & Management. Emerald Group Publishing Limited, Leeds, pp. 603-627. https://doi.org/10.1108/S1571-5027(2010)00000230031
[63] Teixeira, A.A., Heyuan, W. (2012). Is human capital relevant in attracting innovative foreign direct investment to China? Asian Journal of Technology Innovation, 20(1): 83-96. https://doi.org/10.1080/19761597.2012.681436
[64] Pitelis, C.N., Teece, D.J. (2018). The new MNE: ‘Orchestration’ theory as envelope of ‘Internalisation’ theory. Management International Review, 58: 523-539. https://doi.org/10.1007/s11575-018-0346-2
[65] Bénassy‐Quéré, A., Coupet, M., Mayer, T. (2007). Institutional determinants of foreign direct investment. World Economy, 30(5): 764-782. https://doi.org/10.1111/j.1467-9701.2007.01022.x
[66] Erlina, S., Sitorus, N.H. (2024). Institutional quality and macroeconomic indicators on foreign direct investment in developing Asian countries. InJEBA: International Journal of Economics, Business and Accounting, 2(3): 348-358. https://doi.org/10.5281/zenodo.13691563
[67] Khan, A., Ejaz, S., Safdar, S. (2023). Political instability and investment behaviour in Pakistan. NUST Journal of Social Sciences and Humanities, 9(1): 1-40. https://doi.org/10.51732/njssh.v9i1.160
[68] Madaki, L.J., Akawu, F.A., Ibbih, J.M. (2022). Effect of airport non-aeronautic infrastructure on economic growth in Nigeria: 1986-2020. Journal of Agripreneurship and Sustainable Development, 5(1): 153-165. https://doi.org/10.59331/jasd.v5i1.298
[69] Desai, M.A., Foley, C.F., Hines Jr, J.R. (2004). Foreign direct investment in a world of multiple taxes. Journal of Public Economics, 88(12): 2727-2744. https://doi.org/10.1016/j.jpubeco.2003.08.004
[70] Central Bank of Kosovo. (2024). Time serieas, foreign trade. https://bqk-kos.org/.
[71] Agency of Statistics of Kosovo. (2024). Key indicators. https://ask.rks-gov.net/.
[72] Agency for Business Registration in Kosovo. (2023). Business statistics. Foreign Companies-Branches in Kosovo. https://arbk.rks-gov.ne.
[73] Tax Administration of Kosovo. (2024). Open Data. https://www.atk-ks.org/open-data/.
[74] Ministry of Industry, Entrepreneurship and Trade of Kosovo. (2024). Publication. https://mint.rks-gov.net/page.aspx?id=2,1.
[75] Yamane, T. (1967). Statistics: An Introductory Analysis (2nd ed.). New York: Harper and Row.
[76] Cronbach, L.J. (1951). Coefficient alpha and the internal structure of tests. Psychometrika, 16(3): 297-334. https://doi.org/10.1007/BF02310555
[77] Field, A. (2013). Discovering Statistics Using IBM SPSS Statistics (4th ed.). SAGE Publications. https://sadbhavnapublications.org/research-enrichment-material/2-Statistical-Books/Discovering-Statistics-Using-IBM-SPSS-Statistics-4th-c2013-Andy-Field.pdf.
[78] Taboga, M. (2021). Linear regression with standardized variables. Lectures on Probability Theory and Mathematical Statistics. Kindle Direct Publishing. Online Appendix. https://www.statlect.com/fundamentals-of-statistics/linear-regression-with-standardized-variables.
[79] Yiu, D.W., Lau, C., Bruton, G.D. (2007). International venturing by emerging economy firms: The effects of firm capabilities, home country networks, and corporate entrepreneurship. Journal of International Business Studies, 38: 519-540. https://doi.org/10.1057/palgrave.jibs.8400278
[80] Hair, J.F., Black, W.C., Babin, B.J., Anderson, R.E. (2021). Multivariate Data Analysis (8th ed.). Pearson.
[81] Byjus math formula. (2024) Math formuls. Byjus Math Formulas (2023). https://byjus.com/correlation-coefficient-formula. https://byjus.com/math-formulas/.
[82] UEDUFI. (2024). How to calculate Cronbach's alpha in SPSS. https://uedufy.com/how-to-calculate-cronbachs-alpha-in-spss/.
[83] Bonett, D.G., Wright, T.A. (2015). Cronbach's alpha reliability: Interval estimation, hypothesis testing, and sample size planning. Journal of Organizational Behavior, 36(1): 3-15. https://doi.org/10.1002/job.1960
[84] Hoffman, J.I. (2015). Chapter 10 - Hypothesis testing: The null hypothesis, significance, and Type I error. In Biostatistics for Medical and Biomedical Practitioners. Academic Press. https://doi.org/10.1016/B978-0-12-802387-7.00010-X
[85] Friedman, M. (1937). The use of ranks to avoid the assumption of normality implicit in the analysis of variance. Journal of the American Statistical Association, 32(200): 675-701. https://doi.org/10.1080/01621459.1937.10503522
[86] Kaiser, H.F. (1974). An index of factorial simplicity. Psychometrika, 39(1): 31-36. https://doi.org/10.1007/BF02291575
[87] Bartlett, M.S. (1954). A note on the multiplying factors for various χ2 approximations. Journal of the Royal Statistical Society. Series B (Methodological), 16(2): 296-298.
[88] Holland, S.M. (2008). Principal components analysis (PCA). Department of Geology, University of Georgia, Athens, GA, 30602, 2501. http://stratigrafia.org/8370/handouts/pcaTutorial.pdf.
[89] Smith, L.I. (2002). A tutorial on principal components analysis. http://www.facweb.iitkgp.ac.in/~sudeshna/courses/ML06/principal_componentstutorial.pdf.
[90] Element Lab Solution. (2024). https://www.elementlabsolutions.com/uk/chromatography-blog/post/principal-component-analysis-part-2.
[91] Kendall, M.G. (1938). A new measure of rank correlation. Biometrika, 30(1-2): 81-93. https://doi.org/10.1093/biomet/30.1-2.81
[92] Kida, N., Smajli, R., Gjuraj, D., Morina, V., Morina, J. (2025). Driving factors of foreign direct investment in Kosovo: The roles of market access and government support. International Journal of Sustainable Development & Planning, 20(1): 433-451. https://doi.org/10.18280/ijsdp.200139
[93] Gujarati, D.N., Porter, D.C. (2009). Basic econometrics. McGraw-hill. Fifth Edition. International Edition McGraw-Hill/Irwin, A Business Unit of The McGraw-Hill Companies. Inc., New York. https://www.cbpbhotellinu.ac.in/userfiles/file/2020/STUDY_MAT/ECO/1.pdf/.
[94] Pedhazur, E. (1997). Multiple regression in behavioral research: Explanation and prediction. 3rd Harcourt Brace. Fort Worth, TX. https://searchworks.stanford.edu/view/7840987.
[95] Kaiser, H.F. (1970). A second generation Little Jiffy. Psychometrika, 35(4): 401-415. https://doi.org/10.1007/BF02291817
[96] Kida, N., Smajli, R., Hashani, M., Morina, V., Morina, J., Miftari, F. (2025). The impact of trade and consumption on Kosovo GDP growth: An analysis based on the Cobb-Douglas model. Planning, 20(2): 503-526. https://doi.org/10.18280/ijsdp.200205
[97] Hotelling, H. (1933). Analysis of a complex of statistical variables into principal components. Journal of Educational Psychology, 24(6): 417. https://doi.org/10.1037/h0071325
[98] Jolliffe, I.T., Cadima, J. (2016). Principal component analysis: A review and recent developments. Philosophical Transactions of the Royal Society A: Mathematical, Physical and Engineering Sciences, 374(2065): 20150202. https://doi.org/10.1098/rsta.2015.0202
[99] Kida, N. (2021). The causal link between FDI and remittances in Kosovo, Switzerland, and Denmark. Comparative Economic Research. Central and Eastern Europe, 24(2): 45-68. https://dspace.uni.lodz.pl/handle/11089/38135
[100] Eichengreen, B. (2005). Is a change in the renminbi exchange rate in China's interest? Asian Economic Papers, 4(1): 40-75. https://doi.org/10.1162/asep.2005.4.1.40
[101] Singhal, N., Kumar, N. (2025). The non-linear effects of selected macroeconomic variables on outward foreign direct investment from India. Journal of Asian Economic Integration, 26316846241304162. https://doi.org/10.1177/26316846241304162
[102] Alfaro, L. (2005). Inflation, openness, and exchange-rate regimes: The quest for short-term commitment. Journal of Development Economics, 77(1): 229-249. https://doi.org/10.1016/j.jdeveco.2004.02.006
[103] Alfaro, M. (2021). Attracting multinationals: Additional hurdles under firm selection. Economics Letters, 208: 110087. https://doi.org/10.1016/j.econlet.2021.110087
[104] Zogjani, J., Kovaci-Uruci, F., Zogjani, A. (2024). Transformative dynamics of the economy of Kosovo: A perspective on history and development of foreign direct investment. Naše Gospodarstvo/Our Economy, 70(3): 37-47. https://doi.org/10.2478/ngoe-2024-0015
[105] Government of Kosovo. (2024). Office of the prime minister, office for good governance. Welcome to the public consultation platform-make your voice heard. https://konsultimet.rks-gov.net/.