Ali Ghazi Abdul Ali Al-Maliki*![]() | Ali M Jaafar
| Ali M Jaafar![]() | Amjad Al-Musaed
| Amjad Al-Musaed![]()
© 2025 The authors. This article is published by IIETA and is licensed under the CC BY 4.0 license (http://creativecommons.org/licenses/by/4.0/).
OPEN ACCESS
This research investigates the technical performance of finishing materials used in the facades of school buildings in hot and arid regions, addressing the lack of thorough evaluation in material selection. Current practices often result in rapid material degradation, necessitating frequent maintenance. The study seeks to establish technical standards and indicators for evaluating material durability and condition over time. By focusing on two selected school buildings, the research aims to provide insights into material performance and user behavior impacts. It includes a literature review, field surveys, and laboratory testing to evaluate material resistance to local environmental and human factors. The study's findings will contribute to developing guidelines for improving the durability of finishing materials in school buildings, thereby reducing maintenance costs and enhancing building longevity. One key conclusion is the inadequacy of current materials in withstanding local conditions, highlighting the need for specialized studies to establish local standards for material evaluation. The research encountered several obstacles, including technical challenges related to limited capabilities for sample testing. The second set of challenges were administrative in nature, which hindered the research due to the regulations and requirements for accessing school buildings. Additionally, there were difficulties in extracting samples of finishing materials and subsequently replacing them within the building.
technical performance, finishing materials, school building, building performance evaluation, durability of finishes
Finishing materials are crucial to any building as they constitute the visible surface in all parts of the structure. Their importance lies in making buildings appear remarkable and unique. Moreover, in school buildings, improving, enhancing, increasing the durability and sustainability of the structures. The concept of performance, as defined by many researchers, includes the ability of materials to effectively perform their required functions over an extended period [1], as well as their resistance to environmental factors and the maintenance of structural integrity in school buildings [2]. Exterior facades are exposed to harsh environmental conditions, making the selection and maintenance of appropriate materials critical for long-term durability. This research aims to establish specialized local criteria for evaluating the technical performance of finishing materials used on the exterior facades of school buildings in hot and arid environments. As a result, there is a need to explore this area further by addressing the knowledge gap in local studies. The research outlines a detailed framework for evaluating the condition and durability of these materials, considering factors such as resistance to environmental degradation, ease of maintenance, and overall durability. The research also explores the relationship between material performance and the necessity of regular maintenance, providing insights into best practices for selecting and maintaining materials in educational buildings. To understand how to evaluate the condition of finishing materials, it is essential to grasp the concept of performance. Performance has been defined as an action or type of behavior that focuses on details and secondary matters [3]. It also refers to the extent of success or ability in performing a task [4], and it is evaluated through efficiency: the method of operation, mechanism: the response to stimuli and behavior [5], and the successful completion of functions, which can be measured through productivity and response time [6], and fidelity in action [7]. The technical performance of finishing materials is also defined based on their ability to enhance thermal performance, surface layer density, resistance to environmental degradation, wear resistance, ease of maintenance, and load resistance, thereby contributing to the efficiency of the primary structure [8]. Similarly, It is defined as the final stage in their manufacturing process, requiring the highest quality in terms of form, precision, and surface integrity [9]. Furthermore, it involves a complex interplay among seven performance criteria: effectiveness, efficiency, quality, productivity, quality of work life, innovation, and profitability [10], the extent to which the goal is achieved [11], and the contribution of systems, organizational units, and employees in achieving and verifying objectives [12], and the degree of goal achievement [13]. Finishing materials are also defined as "any type of material used in exterior or interior spaces, on horizontal or vertical surfaces, that can provide both technical functionality and aesthetic value to the final construction" [14], Additionally, they are described as "the final layer that protects and enhances the surface of building elements." This layer plays a crucial role in the visual and psychological perception of interior spaces [15]. Therefore, the concept of performance can be seen as the mastery and consistency that lead to high-quality outcomes, relying on maintaining the quality of environmental boundaries. Thus, performance evaluation is essential to determine the efficiency and suitability of finishing materials in school buildings.
This section presents a review of relevant literature to clarify the definition of the technical performance category in buildings, with a focus on establishing its criteria, evaluation methods, and analytical approaches to ensure building quality and safety, particularly in the context of finishing materials. Subsequently, the key concepts for the theoretical framework to be employed in evaluating the selected research samples will be identified.
The technical performance category refers to the structural and material characteristics of a building, encompassing criteria such as planned service life, load capacity, maintainability, rejuvenation capability, fire resistance, noise transfer control, and thermal insulation of the building envelope, along with other technical requirements essential for ensuring building sustainability and operational efficiency [16].
Performance criteria refer to the factors that must be measured and the rationale behind their assessment, defining how success is determined and evaluated. The selection process of these criteria involves identifying dimensions or variables relevant to ensuring the successful operation of the building [17]. Performance criteria also represent the attributes and characteristics used to evaluate the achievement of a specific performance level. The classification of performance criteria aligns with the overarching philosophy of performance classification, where these criteria are attributed to various performance components, including technical criteria used for performance evaluation [18], technical performance criteria represent the suitability of structural elements, potentially reaching a critical warning level. These criteria are characterized by the following attributes [19]:
Adjustability and Correctability: Special attention should be given to integrating these criteria in the early stages of building design and construction, as they become less modifiable at later stages.
Measurability and Evaluability: These criteria can be objectively and mathematically assessed using specialized equipment, reducing reliance on subjective judgment by focusing on quantifiable physical variables, thereby enabling acceptable thresholds to be defined for each criterion individually.
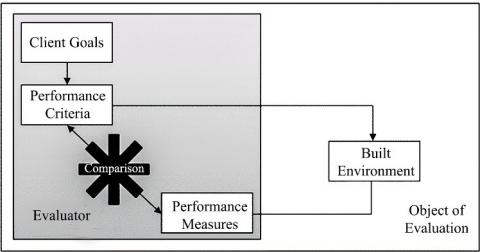
Performance evaluation is a systematic process for comparing the actual performance of buildings, linking client objectives with technical standards established by specialists to measure user satisfaction and the efficiency of constructed components. This process aims to enhance the quality of management, design, and construction practices [20] (Figure 1).
Figure 1. Performance evaluation process [21]
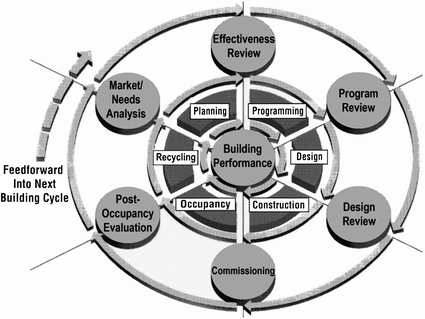
The significance of performance evaluation lies in its ability to provide critical insights into user needs, preferences, and satisfaction levels [22]. Additionally, it offers feedback on the causes and effects of environmental issues related to building components, aiding in long-term planning and product lifecycle management [23]. To achieve this, Building Performance Evaluation (BPE) serves as an effective tool that supports decision-making at both strategic and operational levels throughout all building elements [24]. Furthermore, performance evaluation is a fundamental requirement for implementing necessary modifications aimed at enhancing future design [25], Preiser and Schramm proposed that performance evaluation should be conducted based on the complete lifecycle of a building, which consists of six fundamental phases in the construction process; strategic Planning, programming, design, construction, occupancy, adaptive Reuse / Recycling.
Each phase in the building lifecycle is an essential component, necessitating a cyclical and interconnected approach (Figure 2). To ensure a comprehensive perspective, the evaluation framework has been expanded with the objective of continuous improvement in the quality of constructed elements [26].
Figure 2. Performance evaluation process model [26]
Technical performance evaluation involves testing and assessing technical performance criteria to verify that each criterion meets acceptable thresholds, depending on the type of project and the nature of its occupants [18]. As these criteria are measurable and can be evaluated objectively and mathematically using specialized instruments, they help reduce reliance on subjective estimations. The focus remains on quantifiable physical variables, with acceptable limits set for each criterion based on user needs [19].
Identifying and Evaluating Technical Performance Criteria
To determine technical performance criteria and their evaluation methods, the following set of studies will be analyzed, and a conclusion will be drawn for each study, as follows:
According to Waggener [26], technical performance encompasses several criteria that can be evaluated by ensuring that materials possess specific properties. These include edge resistance and moisture penetration resistance, which relate to material porosity. The surface thickness must be designed to ensure adequate coverage, which helps reduce water absorption and enhance material resistance to environmental factors, additionally, mold resistance is a crucial criterion, as organic materials may create a suitable environment for microorganism and mold growth. Therefore, it is essential to analyze the material composition and assess its resistance to mold growth, the chemical resistance criterion refers to a material’s ability to maintain color and surface sheen when exposed to cleaning agents and intensive cleaning processes, which may impact the integrity and durability of materials. This criterion is also linked to material chemistry, determining whether the material is rigid or flexible. The use of low-performance materials may result in loss of surface sheen, surface pitting (corrosion), and overall material degradation over time, ultimately reducing the material’s service life. Therefore, finishing materials should be selected based on their chemical and corrosion resistance to ensure their long-term durability and performance quality the load resistance criterion for finishing materials is associated with their ability to withstand heavy static loads and dynamic moving loads. Additional criteria include resistance to cleaning agents, referring to the effects of rigorous cleaning procedures on material integrity and durability. This is also related to material chemistry, which determines whether the material is rigid or flexible furthermore, the installation and bonding methods criterion involves ensuring the integrity of bonding elements. This includes analyzing the adhesive components of finishing materials and surface joints to ensure dimensional stability when exposed to heat or moisture under varying environmental conditions. The bonding strength to the substrate, as well as at the joints with adjacent materials, must be sufficient to prevent separation or deformation.
From the above, it can be concluded that the technical performance category encompasses various criteria, and these criteria include several measurable indicators. The most significant of these indicators are summarized in Table 1.
Marteinsson and Jónsson [27] addresses the concept of technical performance through criteria for evaluating the condition of materials. These criteria include: type of maintenance required, which involves providing a maintenance plan and offering information on the performance of materials and components used, cost, analysis and the impact of repairs on the final outcome of the materials, surface classification based on three key considerations:
•Distinct material failure
•Percentage of degradation
•Extent of maintenance required
The degradation percentage is assessed based on the following factors:
•Degradation frequency – includes the type of degradation, number of occurrences, and rate of occurrence.
•Extent of degradation – refers to the surface area affected in walls, ceilings, and floors.
•Type of degradation – classified descriptively as intact, minor damage, and major damage.
Table 1. The technical performance criteria and indicators as presented in Waggener's study
|
Criteria |
Indicators |
|
Moisture resistance |
Material porosity |
|
Material thickness |
|
|
Material chemistry |
|
|
Mold resistance |
Material type |
|
Chemical resistance |
Material color |
|
Surface sheen |
|
|
Corrosion resistance |
|
|
Cleaning agent resistance |
|
|
Material hardness |
|
|
Load resistance |
Static loads |
|
Dynamic loads |
|
|
Bonding element resistance |
Adhesive strength |
|
Dimensional stability |
|
|
Heat resistance |
The degradation types are categorized into four stages (A to D), where each material is described based on its specific degradation stage, as illustrated in Table 2.
Table 2. Stages of material degradation
|
Description |
Surface Condition |
Damage Level |
|
A. Intact |
Clean, intact, and not peeling |
No damage / Minimal or very minor damage |
|
B. Minor Damage |
Dirty / Disfigured but not exposing the underlying layers |
Slight peeling / Limited cracks |
|
C. Major Damage |
Peeling and exposing the underlying layers |
Some peeling and limited damage from environmental conditions and cracks |
|
D. Hazardous Condition |
Widespread peeling exposing the underlying layers |
Significant environmental damage, major cracks, and other damage |
Table 3. The technical performance criteria and indicators as presented in Marteinsson's study
|
Criteria |
Indicators |
|
Material Condition |
Maintenance Requirement |
|
Material Degradation |
|
|
Material Type |
|
|
Surface Texture |
|
|
Type of Material Treatment |
|
|
Installation Method |
Furthermore, material inspection is a fundamental component of technical performance evaluation, including factors such as material type, surface texture (smooth, textured, etc.), type of surface treatments (paint, protective coatings, etc.) Installation method for finishing materials.
It can be concluded that the technical performance category includes additional criteria related to material condition, which can be evaluated using several indicators. The most significant of these indicators are summarized in Table 3.
While Sherif [28] highlighted that technical performance comprises two primary criteria: durability and maintainability, the durability criterion includes; impact resistance, stain resistance, resistance to cleaning agents, corrosion resistance, resistance to repeated washing, resistance to peeling from the underlying layer, the maintainability criterion encompasses; assessment of ease of cleaning, frequency of repair and restoration, accessibility to electrical and mechanical services.
Based on the above, it can be concluded that technical performance in Shareef's study consists of two primary criteria, which can be evaluated as illustrated in Table 4.
Table 4. The technical performance criteria and indicators as presented in Sherif's study
|
Criteria |
Indicators |
|
Material Durability |
Impact Resistance |
|
Stain Resistance |
|
|
Resistance to Cleaning Agents |
|
|
Corrosion Resistance |
|
|
Peeling Resistance |
|
|
Maintainability |
Ease of Cleaning |
|
Need for Repair |
|
|
Accessibility |
The study by Zhang et al. [29] introduced bonding element strength as a criterion for evaluating the technical performance of finishing materials. Adhesives used in exterior facades enhance the safety and durability of finishing materials, helping to maintain the cleanliness of the external surface. Additionally, the presence of an air layer reduces the occurrence of issues such as blistering, cracking, peeling, and discoloration of exterior materials, furthermore, surface roughness, as examined by Thomas [30], plays a significant role in the durability and performance of a product. Rough surfaces tend to wear down more quickly and have a substantial effect on how a product interacts with its environment, as higher friction levels are observed compared to smooth surfaces. Moreover, maintaining a certain degree of roughness is essential to ensure effective adhesion of coatings and surface treatments, facilitated by surface texture effects, in another study, Katar [31] defined material durability based on distinctive properties and specifications related to technical performance, such as hardness, strength, weight, density, material thickness, and its ability to withstand high temperatures.
Table 5. The technical performance criteria and indicators as presented in the studies [30, 31]
|
Criteria |
Indicators |
|
Material Durability |
Adhesive Strength |
|
Surface Roughness |
|
|
Material Hardness |
|
|
Corrosion Resistance |
|
|
Material Density |
|
|
Material Thickness |
|
|
Heat Resistance |
Based on the above, it can be concluded that the material durability criterion within the technical performance category can also be evaluated using several key indicators, as summarized in Table 5.
Previous studies have examined various characteristics that define technical performance, including chemical resistance, material durability, bonding element integrity, material condition, and maintainability. The significance of these criteria lies in their ability to provide a safe environment that meets user needs, while also contributing to the enhancement of future building designs, particularly in hot and arid environmental conditions and human usage contexts.
Given the specific nature of this research, the theoretical framework will be constructed with a focus on the concepts of material condition and durability, as these are the most critical indicators affecting local school buildings. Furthermore, these indicators serve as key factors in ensuring the longevity and safety of other technical performance criteria, due to their strong interrelation and mutual influence, as illustrated in Table 6.
Table 6. Main and secondary vocabulary and indicators of the theoretical framework
|
Main Vocabulary |
Secondary Vocabulary |
Indicators |
|
|
Material durability |
Material Resistance AA |
Impact Resistance AAA |
|
|
Stain Resistance AAB |
|||
|
Cleaning Agent Resistance AAC |
|||
|
Corrosion Resistance AAD |
|||
|
Friction Resistance AAE |
|||
|
Dimensional Stability AAF |
Heat Resistance AAFA |
||
|
Moisture Resistance AAFB |
|||
|
Material Hardness AB |
|||
|
Material Density AC |
|||
|
Adhesion Capability AD |
|||
|
Material Condition |
Maintenance Needs BA |
Minor Damage BAA |
|
|
Major Damage BAB |
|||
|
Critical Condition BAC |
|||
|
Material Degradation BB |
Extent of Degradation BBA |
Wall Collapse Rate BBAA |
|
|
Frequency of Degradation BBB |
Number Of Degradation Occurrences BBBA |
||
|
Speed Of Degradation BBBB |
|||
|
Type of Degradation BBC |
|||
|
Previous Maintenance Impact BC |
|||
In this section, the research steps on which the study was designed will be explained. These steps guide the research towards the selection and analysis of samples, and the practical application to obtain the key findings and recommendations, as follows:
(1) Develop a theoretical framework with more detailed concepts related to the research topic.
(2) Extract the primary and secondary terms along with their indicators that contribute to building the theoretical framework by studying the category of technical performance to assess the condition and durability of finishing materials in the exterior facades of school buildings.
(3) Study and analyses two selected local case studies that were chosen due to the use of different and varied finishing materials on their exterior facades, as well as the varying levels of damage caused by environmental and human factors, and apply the theoretical framework to them.
(4) Determine the analysis and measurement approach, where the research adopts a descriptive-analytical and experimental methodology in dealing with the selected samples to explore the application of the indicators. This involves field surveys to assess the condition of the finishing materials and the collection of samples to evaluate the durability of the finishing materials through a laboratory simulation of the conditions faced by these materials in the actual school buildings.
(5) Present the findings, conclusions, and recommendations.
This section addresses the study and analysis of two local school buildings, where these samples will be analyzed based on specific concepts such as material condition and durability, which will be evaluated using a set of primary and secondary terms and their indicators as outlined in Table 6. The primary reason for selecting these two samples is the diversity of finishing materials used and the extent of damage they have sustained due to environmental and human conditions, providing a deeper understanding of the technical aspects related to the resistance of these materials.
4.1 Asma Bent Abi Bakr School
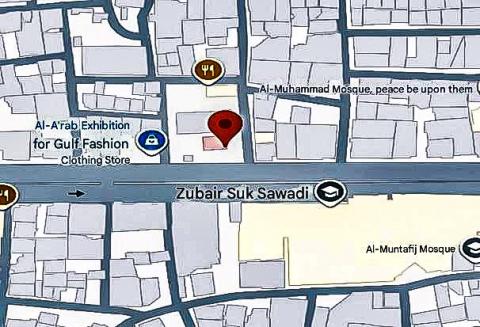
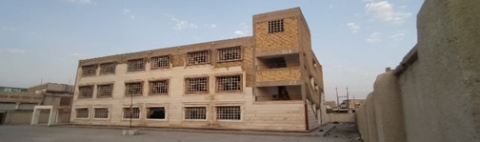
The building comprises eighteen (18) classrooms distributed across three floors (Figure 3). It accommodates approximately 350 students and was originally constructed in 2005, with its most recent renovation completed in 2013. The facility is located in Al-Zubair, Basra, Iraq (Figure 4), and is surrounded by busy main roads and disorganized local markets.
Figure 3. The layout of Asma Bent Abi Bakr School
Figure 4. Location of Asma Bent Abi Bakr School and its surroundings
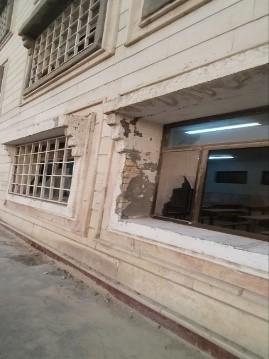
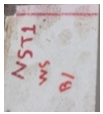
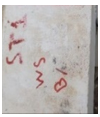
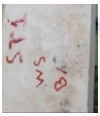
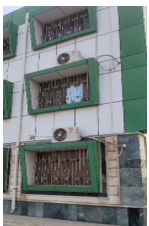
Figure 5. Condition of the natural stone finishing materials (ST1) In the façade of Asma Bent Abi Bakr School
Figure 6. Condition of the paint finishing materials (WPai+GT1) on the window frames of the façade of Asma Bent Abi Bakr School
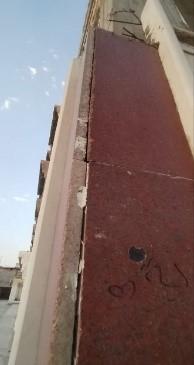
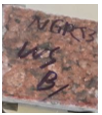
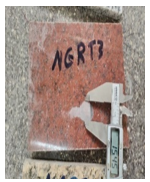
Figure 7. Condition of the red granite finishing materials on the façade of Asma Bent Abi Bakr School (GRT3)
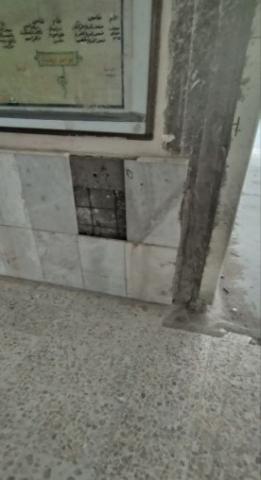
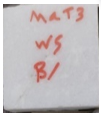
Figure 8. Condition of the finishing materials on the façade of Asma Bent Abi Bakr School, specifically the white marble (MAT3)
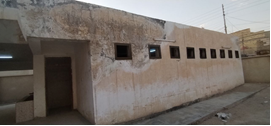
Figure 9. Condition of the paint finishing materials (WPai+GT1) on the sanitary façade of Asma Bent Abi Bakr School
Table 7. Selected finishing materials samples
|
Asmaa Bent Abi Bakr School |
||||||
|
(ES) Samples Exposed to Environmental Conditions Only |
(EHS) Samples Exposed to Environmental and Human Conditions |
|||||
|
|
Sample Code |
Item Description |
Sample Image |
Sample Code |
Item Description |
Sample Image |
|
1 |
NGRT3 |
Natural Granite Stone Type 3 red color for walls |
GRT3 |
Natural Granite Stone Type 3 red color for walls |
||
|
2 |
NMaT3 |
Natural Marble Type 3 white color for walls |
MaT3 |
Natural Marble Type 3 white color for walls |
||
|
3 |
NST1 |
Natural Stone Type 1 for walls |
ST1 |
Natural Stone Type 1 for walls |
||
|
4 |
NWPai+GT1 |
Water-Based Paint with Gypsum Type 1 beige color for walls |
WPai+GT1 |
Water-Based Paint with Gypsum Type 1 beige color for walls |
||
|
Al-Shaheed Qahtan Ali Al-Lami School |
||||||
|
(ES) Samples Exposed to Environmental Conditions Only |
(EHS) Samples Exposed to Environmental and Human Conditions |
|||||
|
|
Sample Code |
Item Description |
Sample Image |
Sample Code |
Item Description |
Sample Image |
|
1 |
NMaT1 |
Natural Marble Type 1 green color for walls |
MaT1 |
Natural Marble Type 1 green color for walls |
||
|
2 |
NST1 |
Natural Stone Type 1 for walls |
ST1 |
Natural Stone Type 1 for walls |
||
|
3 |
NCT1 |
Ceramic Type 1 beige color for flooring |
CT1 |
Ceramic Type 1 beige color for flooring |
||
|
4 |
NACT1 |
Aluminum Composite Panel Type 1 white color for walls |
ACT1 |
Aluminum Composite Panel Type 1 white color for walls |
||
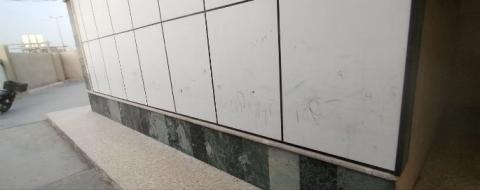
The facade incorporates a variety of finishing materials, including natural stone (Stone Type One – ST1), natural white marble (Marble Type Three – MAT3), natural red granite (Granite Type Three – GRT3), and water-based paint combined with gypsum (Water Paint with Gypsum Type One – WPai+GT1), as detailed in Table 7. On-site inspection (Figures 5-9) revealed significant deterioration of these finishing materials. This degradation is primarily attributed to the ease with which the installations can be disassembled, a result of poor execution and inadequate maintenance, ultimately leading to their current poor technical condition.
4.2 Qahtan Ali Al-Lami School
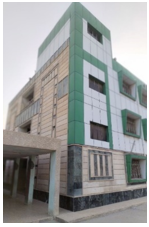
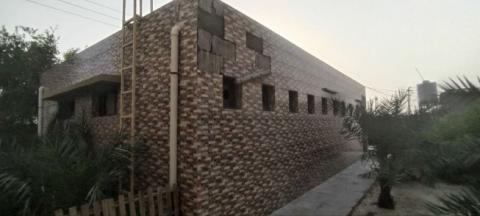
The building consists of eighteen (18) classrooms distributed across three floors, as illustrated in Figure 10, and accommodates approximately 380 students. It was constructed in 2000 and underwent its most recent renovation in 2017. Located in the Al-Zahra neighborhood of Basra, Iraq (Figure 11), the school is situated amidst busy main streets and unregulated commercial shops, contributing to a visually chaotic environment.
Figure 10. The layout of Al-Shaheed Qahtan Ali Al-Lami School, including the usage of spaces
Figure 11. Location of Al-Shaheed Qahtan Ali Al-Lami School with its surroundings.
Figure 12. Condition of the green marble finishing materials on the exterior facade of Al-Shaheed Qahtan Ali Al-Lami School
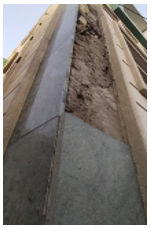
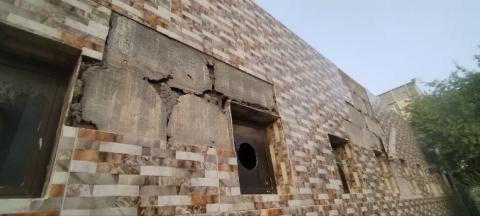
Figure 13. Condition of the finishing materials (marble, stone, and aluminum panels) on the exterior facade of Al-Shaheed Qahtan Ali Al-Lami School
Figure 14. Condition of the finishing materials (marble, stone, and aluminum panels) on the exterior facade of Al-Shaheed Qahtan Ali Al-Lami School
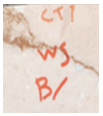
Figure 15. Condition of the ceramic finishing materials on the exterior of the restrooms at Al-Shaheed Qahtan Ali Al-Lami School
Figure 16. Condition of the ceramic finishing materials on the exterior of the restrooms at Al-Shaheed Qahtan Ali Al-Lami School
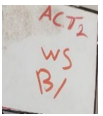
Figure 17. Condition of the aluminum panel finishing materials on the exterior of Al-Shaheed Qahtan Ali Al-Lami School building
The facade features a combination of finishing materials, including natural stone (Stone Type One – ST1), green marble (Marble Type One – MAT1), aluminum composite panels (Aluminum Composite Panel Type One – ACT1), and ceramic tiles (Ceramic Type One – CT1), as presented in Table 7. On-site inspection (Figures 12-17) reveals a moderate level of deterioration in these materials. This condition is influenced by factors such as the relatively small student population, consistent maintenance efforts, and noticeable wear in high-traffic areas, particularly gathering spaces and restrooms. Additionally, the ease of material disassembly—resulting from substandard execution—has contributed to the overall decline in the technical condition of the building's finishing components.
4.3 Samples of finishing materials
This section will show samples of the finished materials from the two schools that were subjected to laboratory simulation tests, and these will be presented in Table 7 with photographs and descriptions accompanying each finishing material. The samples were taken from sites exposed only to environmental conditions (ES) where the letter (N) in the sample code represents non-use by humans, for example sample (NGRT3), and from sites exposed to both environmental and human conditions (EHS). The results were calculated based on the average values of the two samples for the same material.
The analysis form was developed with indicators to verify the variables based on the information derived from the selected samples for the practical study, which was obtained through field surveys of the samples and laboratory simulations and tests of the finishing material samples in the selected schools, as illustrated in Table 8.
Table 8. Main and secondary vocabulary and indicators with their achievement rates for the two research samples
|
Main Vocabulary |
Secondary Vocabulary |
Indicators |
Asmaa Bent Abi Bakr School |
Al-Shaheed Qahtan Ali Al-Lami School |
Ratio Average |
||||
|
Material durability A |
34.14% |
Material Resistance AA |
30.97% |
Impact Resistance AAA |
8.78% |
15.67% |
12.23% |
||
|
Stain Resistance AAB |
25.00% |
23.00% |
24.00% |
||||||
|
Cleaning Agent Resistance AAC |
3.75% |
9.66% |
6.71% |
||||||
|
Corrosion Resistance AAD |
13.57% |
22.51% |
18.04% |
||||||
|
Friction Resistance AAE |
29.52% |
34.66% |
32.09% |
||||||
|
Dimensional Stability AAF |
50.49% |
Heat Resistance AAFA |
55.50% |
67.48% |
61.49% |
||||
|
Moisture Resistance AAFB |
35.55% |
43.41% |
39.48% |
||||||
|
Material Hardness AB |
53.21% |
34.25% |
43.73% |
||||||
|
Material Density AC |
4.05% |
4.56% |
4.30% |
||||||
|
Adhesion Capability AD |
42.01% |
40.43% |
41.22% |
||||||
|
Material Condition B |
29.82% |
Maintenance Needs BA |
24.54% |
Minor damage BAA |
29.13% |
32.01% |
30.57% |
||
|
Great damage BAB |
40.63% |
24.59% |
32.61% |
||||||
|
Critical condition BAC |
15.37% |
5.51% |
10.44% |
||||||
|
Material Degradation BB |
52.49% |
Extent of Degradation BBA |
73.62% |
Wall Collapse Rate BBAA |
85.13% |
62.11% |
73.62% |
||
|
Frequency of |
50.00% |
Number Of Degradation Occurrences BBBA |
66.67% |
33.33% |
50.00% |
||||
|
Speed Of Degradation BBBB |
32.00% |
68.00% |
50.00% |
||||||
|
Type of Degradation BBC |
40.63% |
32.01% |
36.32% |
||||||
|
Previous Maintenance Impact BC |
13.75% |
11.14% |
12.44% |
||||||
5.1 Impact resistance testing
The testing was conducted according to the British Standard [32]. The impact resistance was calculated using the following equations: e = v / u.
where:
v represents the velocity of impact (falling speed).
U represents the velocity of rebound (rebound speed).
The velocity of impact v is calculated using the following equation: v = √(2gh₂).
where:
h2 represents the rebound height in centimeters.
g represents the acceleration due to gravity (= 981 cm/s²).
The value of (u) is calculated using the equation: u = √(2gh₂).
where:
h1 represents the drop height in centimeters.
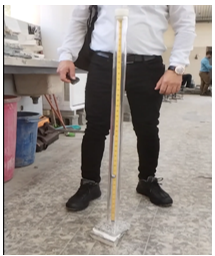
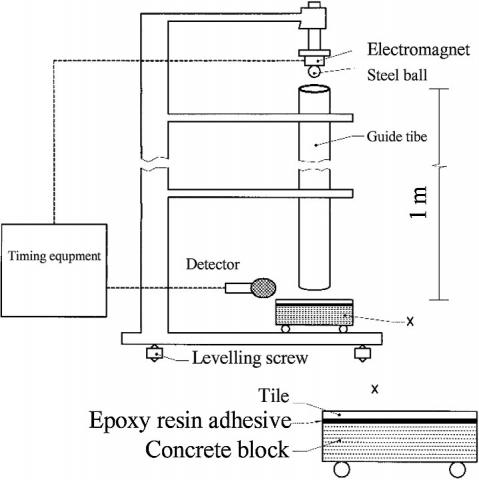
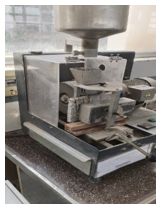
For the test, a Coefficient of Restitution (e) measuring device was utilized, which was constructed by the researchers to closely replicate the device described in the relevant British Standard, as illustrated in Figures 18 and 19. Average values were calculated, and the results were obtained by comparing the samples. The coefficient of restitution (e) was measured for various materials across two schools, with the findings presented in Table 9.
The highest rebound ratio recorded at Asmaa Bent Abi Bakr School was for NST1, at 15.48%, while at Al-Shaheed Qahtan Ali Al-Lami School, the highest was for NCT1, at 21.16%. The overall average rebound ratios were 8.78% for Asmaa Bent Abi Bakr School and 15.67% for Al-Shaheed Qahtan Ali Al-Lami School.
Table 9. The impact resistance test
|
Asmaa Bent Abi Bakr School |
||||
|
ES |
Coefficient of Restitution (e) |
EHS |
Coefficient of Restitution (e) |
Rebound Ratio |
|
NGRT3 |
87.29% |
GRT3 |
82.81% |
5.13% |
|
NMaT3 |
71.27% |
MaT3 |
75.60% |
5.72% |
|
NST1 |
42.17% |
ST1 |
35.64% |
15.48% |
|
Average Ratios |
8.78% |
|||
|
Al-Shaheed Qahtan Ali Al-Lami School |
||||
|
ES |
Coefficient of Restitution (e) |
EHS |
Coefficient of Restitution (e) |
Rebound Ratio |
|
NMaT1 |
82.81% |
MaT1 |
76.43% |
7.70% |
|
NST1 |
42.17% |
ST1 |
35.64% |
15.48% |
|
NCT1 |
68.55% |
CT1 |
54.05% |
21.16% |
|
NACT1 |
35.64% |
ACT1 |
43.65% |
18.35% |
|
Average Ratios |
15.67% |
|||
Figure 18. Rebound coefficient testing device
Figure 19. Schematic diagram of the coefficient of restitution testing device [33]
5.2 Stain resistance testing
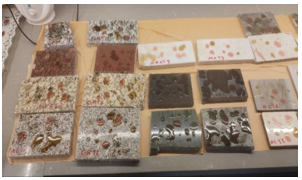
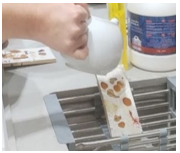
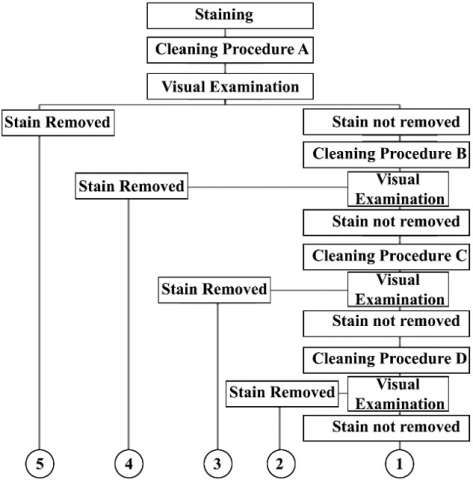
The examination was conducted in accordance with the British Standard [34]. Samples were deliberately stained using various types of staining materials, as illustrated in Figure 20, and left for 24 hours. Following this, the samples were dried using a microwave device. The classification process then began, based on a series of standardized cleaning procedures.
Figure 20. The stage of destroying samples with staining materials
Figure 21. Procedure (A) Cleaning with boiling water
Figure 22. Procedure (B) Cleaning with a weak detergent
Figure 23. Procedure (C) Cleaning with a strong detergent
Figure 24. Procedure (D) Cleaning with solvents
Figure 25. The process of categorizing the results of the stain resistance test [34]
Table 10. Results of stain resistance testing for finishing materials
|
Asmaa Bent Abi Bakr School |
|||||||
|
ES |
Cleaning Procedure A: Boiling Water |
Cleaning Procedure B: Mild Detergent |
Cleaning Procedure C: Strong Detergent |
Cleaning Procedure D: Acetone Solvents |
Cleaning Procedure D: hydrochloric Acid Solvents |
Sum |
EHS |
|
NGRT3 |
20% |
20% |
20% |
20% |
20% |
100% |
GRT3 |
|
NMaT3 |
20% |
20% |
20% |
20% |
20% |
100% |
MaT3 |
|
NST1 |
0% |
0% |
20% |
20% |
20% |
60% |
ST1 |
|
NWpa.+G.T1 |
0% |
0% |
0% |
0% |
0% |
0% |
Wpa.+G.T1 |
|
Cleaning Procedure A: Boiling Water |
Cleaning Procedure B: Mild Detergent |
Cleaning Procedure C: Strong Detergent |
Cleaning Procedure D: Acetone Solvents |
Cleaning Procedure D: hydrochloric Acid Solvents |
Sum |
Average |
Stain Resistance Ratio |
|
20% |
20% |
20% |
20% |
20% |
100% |
100% |
40% |
|
0% |
0% |
0% |
0% |
0% |
0% |
50% |
20% |
|
0% |
0% |
20% |
20% |
20% |
60% |
60% |
24% |
|
0% |
20% |
20% |
20% |
20% |
80% |
40% |
16% |
|
Average Ratios |
25% |
||||||
|
Al-Shaheed Qahtan Ali Al-Lami School |
|||||||
|
ES |
Cleaning Procedure A: Boiling Water |
Cleaning Procedure B: Mild Detergent |
Cleaning Procedure C: Strong Detergent |
Cleaning Procedure D: Acetone Solvents |
Cleaning Procedure D: hydrochloric Acid Solvents |
Sum |
EHS |
|
NMaT1 |
20% |
20% |
20% |
20% |
20% |
100% |
MaT1 |
|
NST1 |
0 |
0 |
20% |
20% |
20% |
60% |
ST1 |
|
NCT2 |
20% |
20% |
20% |
20% |
20% |
100% |
CT1 |
|
NELT1 |
0 |
0 |
20% |
20% |
20% |
60% |
ELT1 |
|
Cleaning Procedure A: Boiling Water |
Cleaning Procedure B: Mild Detergent |
Cleaning Procedure C: Strong Detergent |
Cleaning Procedure D: Acetone Solvents |
Cleaning Procedure D: hydrochloric Acid Solvents |
Sum |
Average |
Stain Resistance Ratio |
|
20% |
20% |
20% |
20% |
20% |
100% |
100% |
29% |
|
0 |
0 |
20% |
20% |
20% |
60% |
60% |
17% |
|
0 |
20% |
20% |
20% |
20% |
80% |
90% |
26% |
|
0 |
20% |
20% |
20% |
20% |
80% |
70% |
20% |
|
Average Ratios |
23% |
||||||
Cleaning Procedure A involved rinsing with boiling water at a temperature of 55℃ (Figure 21).
Procedure B consisted of cleaning with a mild detergent (chloromethyl-based bright powder) using a non-abrasive sponge (Figure 22).
Procedure C employed a strong detergent (chlorine-based) applied with a scraping tool (Figure 23).
Procedure D involved the use of solvents in two stages: first, immersion in acetone, followed by hydrochloric acid (referred to as "flash"). Samples were soaked in each solution for 24 hours, then rinsed and dried (Figure 24).
All stages were evaluated through visual inspection. The samples were categorized as shown in Figure 25. The results are summarized in Table 10.
At Asmaa Bent Abi Bakr School, the materials demonstrating the highest stain resistance (100%) were NGRT3, GRT3, and NMaT3. Moderate resistance (60%) was observed in NST1 and ST1, while the lowest resistance (0%) was recorded for MaT3 and NWpa.+G.T1. The overall average stain resistance ratio for this school was 25%.
At Al-Shaheed Qahtan Ali Al-Lami School, the highest stain resistance (100%) was observed in NMaT1, MaT1, and NCT2. Materials with moderate resistance (80%) included CT1 and ELT1, while the lowest resistance (60%) was found in NST1, ST1, and NELT1. The overall average stain resistance ratio was 23%.
5.3 Cleaning agent’s resistance
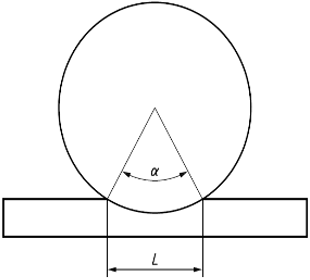
The test was conducted according to the British Standard [34], as the samples were subjected to the cleaning procedures mentioned in the previous stain test and then the corrosion volume of the samples was tested according to the standard (BS EN ISO 10545-6:2012) [35], as the deep corrosion volume was calculated from the equation: V = ((πα / 180) - sin α) × ((h × d²) / 8).
where:
a represents the angle, in degrees, that lies at the center of the rotating disk by the chord.
h represents the thickness of the rotating disk in mm.
d represents the length of the wear distance, as in Figure 26.
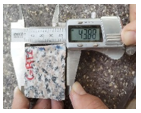
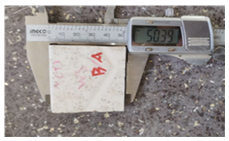
The wear length was measured using a digital vernier caliper, as illustrated in Figure 27. For the assessment of deep abrasion, a specialized device was employed to measure the deep abrasion volume (V), as shown in Figure 28. Average values were calculated, and the results were derived by comparing the performance of different samples. The findings are presented in Table 11.
At Asmaa Bent Abi Bakr School, the highest deep abrasion volume ratio was recorded for GRT3, at 11.37%, while at Al-Shaheed Qahtan Ali Al-Lami School, the highest ratio was observed for NMaT1, at 18.68%. The overall average deep abrasion volume ratios were 3.75% for Asmaa Bent Abi Bakr School and 9.66% for Al-Shaheed Qahtan Ali Al-Lami School.
Figure 26. Details of the rotating disk of the corrosion testing device [35]
Figure 27. The corrosion testing device
Figure 28. Examination of the erosion distance of sample (GRT3)
Table 11. Results of the cleaning agent resistance test
|
Asmaa Bent Abi Bakr School |
||||||
|
EHS |
Erosion Distance |
v |
ES |
Erosion Distance |
v |
Volume Ratio |
|
GRT3 |
17.77 |
59.5295 |
NGRT3 |
15.75 |
52.7625 |
11.37% |
|
MaT3 |
69.5 |
2906 |
NMaT3 |
69.5 |
2906 |
0.00% |
|
ST1 |
34 |
330 |
NST1 |
33.71 |
317.98 |
3.64% |
|
Wpai.+G.T1 |
69.5 |
2906 |
NWpai.+G.T1 |
69.5 |
2906 |
0.00% |
|
Average Ratios |
3.75% |
|||||
|
Al-Shaheed Qahtan Ali Al-Lami School |
||||||
|
EHS |
Erosion Distance |
v |
ES |
Erosion Distance |
v |
Volume Ratio |
|
MaT1 |
21.94 |
88.75 |
NMaT1 |
20.55 |
72.17 |
18.68% |
|
ST1 |
34 |
330 |
NST1 |
33.71 |
317.98 |
3.64% |
|
CT1 |
18.08 |
60.568 |
NCT1 |
20.61 |
72.38 |
16.32% |
|
ACT1 |
69.5 |
2906 |
NACT1 |
69.5 |
2906 |
0.00% |
|
Average Ratios |
9.66% |
|||||
5.4 Corrosion resistance test
The test was carried out in accordance with British Standard [35]. The extent of deep corrosion was determined using the same methodology described for assessing resistance to cleaning agents. Average values were calculated, and the results were obtained by comparing the performance of the different samples. The findings are summarized in Table 12.
At Asmaa Bent Abi Bakr School, the highest deep corrosion volume ratio was recorded for Wpa.+G.T1 at 94.33%, while at Al-Shaheed Qahtan Ali Al-Lami School, the highest ratio was observed for NST1 at 92.81%. The overall average deep corrosion volume ratios were 86.43% for Asmaa Bent Abi Bakr School and 77.49% for Al-Shaheed Qahtan Ali Al-Lami School.
Table 12. Results of the corrosion resistance test on samples
|
Asmaa Bent Abi Bakr School |
||||||
|
EHS |
Erosion Distance |
v |
ES |
Erosion Distance |
v |
Volume Ratio |
|
GRT3 |
19.61 |
65.6935 |
NGRT3 |
15.45 |
15.45 |
76.48% |
|
MaT2 |
24.03 |
116.145 |
NMaT2 |
20.8 |
20.8 |
82.09% |
|
ST1 |
40.54 |
561.55 |
NST1 |
40.35 |
40.35 |
92.81% |
|
Wpa.+G.T1 |
41.44 |
602.12 |
NWpa.+G.T1 |
34.14 |
34.14 |
94.33% |
|
Average Ratios |
86.43% |
|||||
|
Al-Shaheed Qahtan Ali Al-Lami School |
||||||
|
EHS |
Erosion Distance |
v |
ES |
Erosion Distance |
v |
Volume Ratio |
|
MaT1 |
20.18 |
67.603 |
NMaT1 |
17.59 |
17.59 |
73.98% |
|
ST1 |
40.54 |
561.55 |
NST1 |
40.35 |
40.35 |
92.81% |
|
CT1 |
20.6 |
72.35 |
NCT1 |
19.69 |
19.69 |
72.79% |
|
ACT1 |
15.15 |
50.7525 |
NACT1 |
15.03 |
15.03 |
70.39% |
|
Average Ratios |
77.49% |
|||||
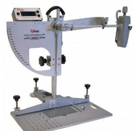
5.5 Friction resistance test
The test was conducted in accordance with the Slovak specification [36]. Friction resistance was evaluated by measuring surface slip, which involved recording the slip length and the heat generated before and after water exposure. A slip resistance testing device was used for this purpose, as illustrated in Figure 29. Average values were calculated, and the results were obtained by comparing the performance of the samples. The findings are presented in Table 13.
Table 13. Results of the friction resistance test for finishing material samples
|
Asmaa Bent Abi Bakr School |
||||||||
|
ES |
B. WATER/CM |
A. WATER/CM |
Friction Average |
EHS |
B. WATER/CM |
A. WATER/CM |
Friction Average |
Friction Ratio |
|
NGRT3 |
0.67 |
0.47 |
0.57 |
GRT3 |
0.33 |
0.53 |
0.43 |
23.53% |
|
NMaT3 |
0.41 |
0.40 |
0.41 |
MaT3 |
0.59 |
0.60 |
0.59 |
31.56% |
|
NST1 |
0.29 |
0.47 |
0.38 |
ST1 |
0.71 |
0.53 |
0.62 |
38.01% |
|
NWPai+GT1 |
0.36 |
0.50 |
0.43 |
WPai+GT1 |
0.64 |
0.50 |
0.57 |
25.00% |
|
Average Ratios |
29.52% |
|||||||
|
Al-Shaheed Qahtan Ali Al-Lami School |
||||||||
|
ES |
B. WATER/CM |
A. WATER/CM |
Friction Average |
EHS |
B. WATER/CM |
A. WATER/CM |
Friction Average |
Friction Ratio |
|
NMaT1 |
0.57 |
0.48 |
0.53 |
MaT1 |
0.43 |
0.52 |
0.47 |
10.48% |
|
NST1 |
0.29 |
0.47 |
0.38 |
ST1 |
0.71 |
0.53 |
0.62 |
38.01% |
|
NCT1 |
0.81 |
0.54 |
0.67 |
CT1 |
0.19 |
0.46 |
0.33 |
50.99% |
|
NACT1 |
0.75 |
0.49 |
0.62 |
ACT1 |
0.25 |
0.51 |
0.38 |
39.19% |
|
Average Ratios |
34.66% |
|||||||
Figure 29. Slip resistance testing device [37]
At Asmaa Bent Abi Bakr School, the highest friction ratio was recorded for NST1 at 38.01%, while at Al-Shaheed Qahtan Ali Al-Lami School, the highest value was observed for NCT1 at 50.99%. The overall average friction ratios were 29.52% for Asmaa Bent Abi Bakr School and 34.66% for Al-Shaheed Qahtan Ali Al-Lami School.
5.6 Heat resistance test
The test was conducted in accordance with British Standard [38], using a thermal oven (7.0 ft³ Bench Oven, 300°F Max, Digital Controller), as shown in Figure 30. Length measurements were taken using a digital vernier caliper, as illustrated in Figure 31. The values for the difference in the coefficient of linear thermal expansion (αₗ) were calculated using the appropriate equation: αₗ = (1 / L₀) × (ΔL / ΔT).
Figure 30. Thermal oven device [39]
Figure 31. Digital caliper device
where:
Lo represents the length of the sample at ambient temperature.
ΔL represents the increase in the length of the test sample between ambient temperature and 100℃.
ΔT represents the increase in temperature.
The average values were calculated, and the results were derived as shown in Table 14. At Asmaa Bent Abi Bakr School, the highest thermal expansion ratio was observed for NST1 at 73.48%, while at Al-Shaheed Qahtan Ali Al-Lami School, the highest value was recorded for NCT1 at 79.06%. The overall average thermal expansion ratios were 55.50% for Asmaa Bent Abi Bakr School and 67.48% for Al-Shaheed Qahtan Ali Al-Lami School.
Table 14. Results of the heat resistance test for finishing material samples
|
Asmaa Bent Abi Bakr School |
||||
|
ES |
Coefficient of Expansion αl |
EHS |
Coefficient of Expansion αl |
Expansion Ratio |
|
NGRT3 |
1.8186E-05 |
GRT3 |
5.69333E-05 |
68.06% |
|
NMaT3 |
5.09396E-05 |
MaT3 |
0.000126187 |
59.63% |
|
NST1 |
0.000232582 |
ST1 |
6.16845E-05 |
73.48% |
|
NWPai+GT1 |
1.21013E-05 |
WPai+GT1 |
9.58E-06 |
20.83% |
|
Average Ratios |
55.50% |
|||
|
Al-Shaheed Qahtan Ali Al-Lami School |
||||
|
ES |
Coefficient of Expansion αl |
EHS |
Coefficient of Expansionαl |
Expansion Ratio |
|
NMaT1 |
3.33682E-05 |
MaT1 |
0.000127714 |
73.87% |
|
NST1 |
0.000232582 |
ST1 |
6.16845E-05 |
73.48% |
|
NCT1 |
1.33727E-05 |
CT1 |
6.38506E-05 |
79.06% |
|
NACT1 |
4.6032E-05 |
ACT1 |
2.5997E-05 |
43.52% |
|
Average Ratios |
67.48% |
|||
5.7 Moisture resistance test
The test was conducted according to the British specification [40], as the length of the samples before boiling in water was calculated using a digital caliper (vernier calipers). The moisture expansion coefficient difference values were extracted from the application of the equation: (Δl / L) × 1000.
where:
ΔL represent the difference between the two average values after boiling, in millimeters.
L represents the average initial length, in millimeters, of the test sample before boiling, as in Figures 32 and 33.
The average values were calculated, and the results were obtained as presented in Table 15. At Asmaa Bent Abi Bakr School, the highest expansion ratio was recorded for MaT3 at 66.80%, while at Al-Shaheed Qahtan Ali Al-Lami School, the highest value was observed for ACT1 at 65.65%. The overall average expansion ratios were 35.55% for Asmaa Bent Abi Bakr School and 43.41% for Al-Shaheed Qahtan Ali Al-Lami School.
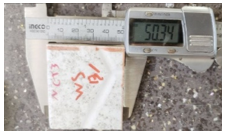
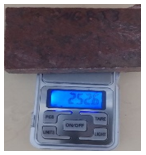
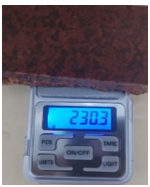
Figure 32. Measuring the length of a sample (NCT3) before boiling
Figure 33. Measuring the length of a sample (NCT3) after boiling
Table 15. Results of the moisture resistance test for finishing material samples
|
Asmaa Bent Abi Bakr School |
||||
|
ES |
Moisture Expansion MM/M |
EHS |
Moisture Expansion MM/M |
Expansion Ratio |
|
NGRT3 |
5.940594059 |
GRT3 |
5.545286506 |
6.65% |
|
NMaT3 |
5.859375 |
MaT3 |
1.945525292 |
66.80% |
|
NST1 |
5.576208178 |
ST1 |
3.724394786 |
33.21% |
|
Average Ratios |
35.55% |
|||
|
Al-Shaheed Qahtan Ali Al-Lami School |
||||
|
ES |
Moisture Expansion MM/M |
EHS |
Moisture Expansion MM/M |
Expansion Ratio |
|
NMaT1 |
6.237006237 |
MaT1 |
4.338394794 |
30.44% |
|
NST1 |
5.576208178 |
ST1 |
3.724394786 |
33.21% |
|
NCT1 |
6.896551724 |
CT1 |
3.838771593 |
44.34% |
|
NACT1 |
3.669724771 |
ACT1 |
10.68376068 |
65.65% |
|
Average Ratios |
43.41% |
|||
5.8 The hardness of the material test
The test was conducted according to the British Standard [41], as the hardness of the samples was calculated by calculating the modulus of rupture (The modulus of rupture, R,) by applying the equation: R = (3Fl₂) / (2bh²) = (3S) / (2h²).
where:
F represents the fracture load expressed in Newtons.
L2 represents the distance between the support bars in mm for the testing device.
b represents the width of the test sample in mm.
h represents the minimum thickness of the test sample measured after the test along the broken edge, in mm.
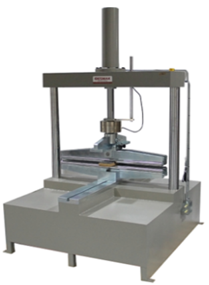
The samples were tested using a Servo-Hydraulic Breaking Test Machine, as shown in Figure 34. The results were calculated by averaging the measured values and comparing the performance of the samples. The findings are presented in Table 16.
At Asmaa Bent Abi Bakr School, the highest hardness ratio was recorded for NMaT3 at 57.84%, while at Al-Shaheed Qahtan Ali Al-Lami School, the highest value was observed for NCT1 at 60.03%. The overall average hardness ratios were 53.21% for Asmaa Bent Abi Bakr School and 34.25% for Al-Shaheed Qahtan Ali Al-Lami School.
Figure 34. Digital caliper device
Table 16. Results of the hardness test for finishing materials
|
Asmaa Bent Abi Bakr School |
||||
|
ES |
Fracture Coefficient R |
EHS |
Fracture Coefficient R |
Hardness Ratio |
|
NGRT3 |
0.041271866 |
GRT3 |
0.019541888 |
52.65% |
|
NMaT3 |
0.032354619 |
MaT3 |
0.013640045 |
57.84% |
|
NST1 |
0.008282105 |
ST1 |
0.004211753 |
49.15% |
|
Average Ratios |
53.21% |
|||
|
Al-Shaheed Qahtan Ali Al-Lami School |
||||
|
ES |
Fracture Coefficien R |
EHS |
Fracture Coefficient R |
Hardness Ratio |
|
NMaT1 |
0.057093899 |
MaT1 |
0.041211719 |
27.82% |
|
NST1 |
0.008282105 |
ST1 |
0.004211753 |
49.15% |
|
NCT1 |
0.042831079 |
CT1 |
0.017118446 |
60.03% |
|
NACT1 |
0.225230769 |
ACT1 |
0.225230769 |
0.00% |
|
Average Ratios |
34.25% |
|||
5.9 Material density testing
The test was conducted in accordance with British Standard [42]. The apparent relative density (B) was determined using the vacuum method, as specified in the standard, with the aid of a pressure discharge device (Glass Desiccator, Vacuum Type, NL 7006 G), as shown in Figure 35. The value of (B) was calculated using the equation: B = m₁ / V.
Figure 35. Device (Glass Desiccators (Vacuum Type) NL 7006 G) [43]
Figure 36. Measurement of dry mass of sample (NGRT3)
Figure 37. Measuring the mass of the sample immersed in water with pressure discharge (NGRT3)
Figure 38. The mass of the sample suspended and immersed in water with pressure discharge (NGRT3)
where:
M1: represents the mass of the dry sample.
V: represents the volume of the sample and it is calculated using the equation: B = m₁ / V, where:
M2V: represents the mass of the sample immersed in water with pressure discharge.
M3: represents the mass of the sample suspended and immersed in water with pressure discharge, as in Figures 36-38.
The average values were calculated, and the results were obtained as presented in Table 17. At Asmaa Bent Abi Bakr School, the highest density ratio was recorded for NMaT3 at 9.25%, while at Al-Shaheed Qahtan Ali Al-Lami School, the highest value was observed for NMaT1 at 7.01%. The overall average density ratios were 4.05% for Asmaa Bent Abi Bakr School and 4.56% for Al-Shaheed Qahtan Ali Al-Lami School.
Table 17. Results of the material density test for finishing materials
|
Asmaa Bent Abi Bakr School |
||||||
|
ES |
M1-g |
M2v-g |
M3-g |
External Volume (V) |
Bulk Density (B) |
|
|
NGRT3 |
252.6 |
253.6 |
73.1 |
180.5 |
1.4 |
|
|
NMaT3 |
119.6 |
120.1 |
38.1 |
82 |
1.46 |
|
|
NST1 |
314.1 |
335.7 |
70.4 |
265.3 |
1.18 |
|
|
EHS |
M1-g |
M2v-g |
M3-g |
External Volume (V) |
Bulk Density (B) |
Apparent Density (B) |
|
GRT3 |
229.1 |
230.3 |
65.8 |
164.5 |
1.39 |
0.48% |
|
MaT3 |
126.8 |
126.9 |
31.1 |
95.8 |
1.32 |
9.25% |
|
ST1 |
334.4 |
357 |
81.4 |
275.6 |
1.21 |
2.42% |
|
Average Ratios |
4.05% |
|||||
|
Al-Shaheed Qahtan Ali Al-Lami School |
||||||
|
ES |
M1-g |
M2v-g |
M3-g |
External Volume (V) |
Bulk Density (B) |
|
|
NMaT1 |
119.5 |
119.8 |
38 |
81.8 |
1.46 |
|
|
NST1 |
314.1 |
335.7 |
70.4 |
265.3 |
1.18 |
|
|
NCT1 |
88.1 |
93 |
18.1 |
74.9 |
1.18 |
|
|
NACT1 |
52.9 |
53 |
9.6 |
43.4 |
1.22 |
|
|
EHS |
M1-g |
M2v-g |
M3-g |
External Volume (V) |
Bulk Density (B) |
Density Ratio |
|
MaT1 |
102.7 |
102.8 |
27.2 |
75.6 |
1.36 |
7.01% |
|
ST1 |
334.4 |
357 |
81.4 |
275.6 |
1.21 |
2.42% |
|
CT1 |
92.1 |
101.3 |
25.7 |
75.6 |
1.22 |
3.45% |
|
ACT1 |
56.4 |
57 |
13.2 |
43.8 |
1.29 |
5.34% |
|
Average Ratios |
4.56% |
|||||
5.10 Adhesion test
The test was conducted according to the British specification [44], as the adhesion potential of the finishing materials was calculated using the tensile strength testing device (Pull-off Tester LR-P6) as shown in Figure 39, as the values were extracted through the equation: Aₛ = L / A, where:
Aₛ represents the individual tensile adhesion force in Newton per square millimeter.
L represents the total tensile force in Newton.
A represents the sample area in square millimeters (2500 mm2).
The average values were calculated, and the results were derived as shown in Table 18. At Asmaa Bent Abi Bakr School, the highest adhesion ratio was observed for NMaT3 at 73.24%, while at Al-Shaheed Qahtan Ali Al-Lami School, the highest value was recorded for NMaT1 at 62.02%. The overall average adhesion ratios were 42.01% for Asmaa Bent Abi Bakr School and 40.43% for Al-Shaheed Qahtan Ali Al-Lami School.
Figure 39. Shows the Pull-off Tester LR-P6 [44]
Table 18. Results of the adhesion capability test for finishing materials
|
Asmaa Bent Abi Bakr School |
||||
|
ES |
Adhesion Strength KN |
EHS |
Adhesion Strength KN |
Adhesion Ratio |
|
NGRT3 |
1.152 |
GRT3 |
2.032 |
43.31% |
|
NMaT3 |
3.625 |
MaT3 |
0.97 |
73.24% |
|
NST1 |
1.3 |
ST1 |
1.436 |
9.47% |
|
Average Ratios |
42.01% |
|||
|
Al-Shaheed Qahtan Ali Al-Lami School |
||||
|
ES |
Adhesion Strength KN |
EHS |
Adhesion Strength KN |
Adhesion Ratio |
|
NMaT1 |
1.082 |
MaT1 |
2.849 |
62.02% |
|
NST1 |
1.3 |
ST1 |
1.436 |
9.47% |
|
NCT1 |
2.348 |
CT1 |
1.179 |
49.79% |
|
Average Ratios |
40.43% |
|||
After reviewing the description of the laboratory testing of the finishing material samples, the analysis of the results will follow. This will involve examining the data through graphical representations, from the indicators with the highest values to those with the lowest values, as detailed below.
5.11 Discussion of the results for the first main vocabulary: Material durability (A)
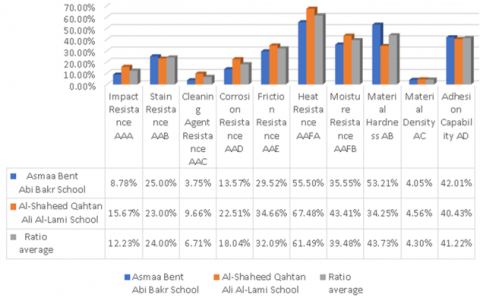
Figure 40 illustrates the achieved percentages for the two research samples under the main variable of Material Durability. It provides a comparative analysis between Asmaa Bent Abi Bakr School and Al-Shaheed Qahtan Ali Al-Lami School, along with the overall average (mean) percentages for each type of resistance, as summarized below.
Figure 40. Achieved ratios for the two research samples under the main variable: Material durability (A)
The highest percentage recorded was in the Heat Resistance (AAFA) indicator, where a notable variation in performance between the two schools was observed. Al-Shaheed Qahtan Ali Al-Lami School achieved the highest percentage at 67.48%, indicating that the materials used in this school possess a strong ability to withstand heat. In contrast, Asmaa Bent Abi Bakr School recorded a lower percentage of 55.50%, suggesting a comparatively lower heat resistance in the materials used. When compared to the overall average of 61.49%, Qahtan Ali Al-Lami School exceeded the mean with notable efficiency, whereas Asmaa Bent Abi Bakr School fell below the general average.
The next highest performance was found in the Material Hardness (AB) indicator. Here, Asmaa Bent Abi Bakr School recorded a percentage of 53.21%, outperforming Qahtan Ali Al-Lami School, which recorded 34.25%. The average value for this indicator was 43.73%, clearly demonstrating the superior hardness of materials used at Asmaa Bent Abi Bakr School.
For the Adhesion Capability (AD) indicator, the results were relatively close. Asmaa Bent Abi Bakr School achieved a percentage of 42.01%, while Qahtan Ali Al-Lami School recorded 40.43%, with an average of 41.22%. These results suggest that both schools utilized materials with good adhesion properties, with a slight advantage observed at Asmaa Bent Abi Bakr School.
In terms of the Moisture Resistance (AAFB) indicator, Qahtan Ali Al-Lami School demonstrated a higher level of technical performance, achieving 43.41%, compared to 35.55% at Asmaa Bent Abi Bakr School. The overall average for this indicator was 39.48%. This indicates that while both schools employed finishing materials with effective moisture resistance, Qahtan Ali Al-Lami School exhibited a marginally superior performance in this category.
For the Friction Resistance (AAE) indicator, the percentages were relatively close, with Al-Shaheed Qahtan Ali Al-Lami School recording 34.66% and Asmaa Bent Abi Bakr School recording 29.52%. The average percentage for this indicator was 32.09%, indicating a moderate level of friction resistance in the finishing materials used in both schools, with a slight advantage for Qahtan Ali Al-Lami School.
In the Stain Resistance (AAB) indicator, Asmaa Bent Abi Bakr School achieved a percentage of 25.00%, while Qahtan Ali Al-Lami School recorded 23.00%, with an overall average of 24.00%. This suggests that both schools employed finishing materials with moderate stain resistance, with a marginal advantage for Asmaa Bent Abi Bakr School.
Regarding the Corrosion Resistance (AAD) indicator, Qahtan Ali Al-Lami School recorded a higher percentage of 22.51% compared to 13.57% at Asmaa Bent Abi Bakr School, with an average of 18.04%. These results indicate that corrosion resistance was relatively low in both schools, although materials at Qahtan Ali Al-Lami School demonstrated slightly better performance.
In the Impact Resistance (AAA) indicator, Qahtan Ali Al-Lami School achieved 15.67%, while Asmaa Bent Abi Bakr School recorded 8.78%, with an average of 12.23%. These figures reflect poor impact resistance in the finishing materials used at both schools, though Qahtan Ali Al-Lami School showed a notable advantage.
For the Cleaning Agents Resistance (AAC) indicator, both schools recorded low percentages, with Qahtan Ali Al-Lami School at 9.66% and Asmaa Bent Abi Bakr School at 3.75%, resulting in an average of 6.71%. This indicates weak resistance to cleaning agents in the finishing materials, with a slight edge for Qahtan Ali Al-Lami School.
Finally, for the Material Density (AC) indicator, the results were very close: Asmaa Bent Abi Bakr School recorded 4.05%, while Qahtan Ali Al-Lami School recorded 4.56%, with an average of 4.30%. This demonstrates a similar level of performance between the two schools in terms of material density.
5.12 Discussion of the results for the second main item: Material condition (B)
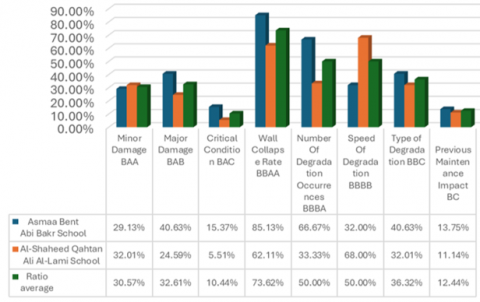
Figure 41 displays the achieved percentages for the two research samples under the main variable "Condition of Material." It presents measurements across various indicators for two schools—Asmaa Bent Abi Bakr School and Al-Shaheed Qahtan Ali Al-Lami School—along with the overall average percentage for each indicator, as detailed below.
Figure 41. Achieved ratios for the two research samples under the main variable: Material condition (B)
The highest percentage was recorded in the Wall Collapse Rate (BBAA) indicator, where Asmaa Bent Abi Bakr School achieved 85.13%, significantly surpassing Al-Shaheed Qahtan Ali Al-Lami School, which recorded 62.11%. The average percentage for this indicator was 73.62%. These results indicate that the finishing materials at Asmaa Bent Abi Bakr School demonstrate superior technical performance concerning structural integrity and lower susceptibility to collapse.
In the Number of Degradation Occurrences (BBBA) indicator, Asmaa Bent Abi Bakr School recorded 66.67%, slightly higher than Qahtan Ali Al-Lami School, which recorded 33.33%. With an average of 50.00%, this suggests that the finishing materials at Asmaa Bent Abi Bakr School experience more frequent degradation events compared to those at Qahtan Ali Al-Lami School.
For the Speed of Degradation (BBBB) indicator, Qahtan Ali Al-Lami School recorded a significantly higher percentage of 68.00%, while Asmaa Bent Abi Bakr School recorded 32.00%, with an average of 50.00%. This indicates a faster rate of material degradation at Qahtan Ali Al-Lami School, reflecting weaker technical performance concerning the durability of finishing materials over time.
In the Type of Degradation (BBC) indicator, Qahtan Ali Al-Lami School recorded 40.63%, compared to 32.01% at Asmaa Bent Abi Bakr School, with an average of 36.32%. This suggests that Qahtan Ali Al-Lami School experiences a greater variety of degradation types in its finishing materials.
Regarding the Major Damage (BAB) indicator, Asmaa Bent Abi Bakr School recorded a higher percentage of 40.63%, while Qahtan Ali Al-Lami School recorded 24.59%, with an average of 32.61%. Despite the higher percentage at Asmaa Bent Abi Bakr School, this indicator may reflect the severity rather than the frequency of damage. Therefore, the results suggest that Qahtan Ali Al-Lami School may face more widespread technical damage across its materials, while Asmaa Bent Abi Bakr School may experience fewer but more severe instances.
In the Minor Damage (BAA) indicator, Al-Shaheed Qahtan Ali Al-Lami School recorded a percentage of 32.01%, while Asmaa Bent Abi Bakr School recorded 29.13%. With an average of 30.57%, these results indicate a comparable level of minor damage in both schools, with a slight advantage observed at Qahtan Ali Al-Lami School.
For the Previous Maintenance Impact (BC) indicator, Qahtan Ali Al-Lami School achieved 13.75%, slightly higher than Asmaa Bent Abi Bakr School, which recorded 11.75%. The average for this indicator was 12.44%. These findings suggest that the finishing materials in both schools are minimally affected by prior maintenance interventions, with Qahtan Ali Al-Lami School showing a marginally better outcome.
Lastly, in the Critical Condition (BAC) indicator, both schools recorded low percentages. Qahtan Ali Al-Lami School registered 5.51%, while Asmaa Bent Abi Bakr School recorded 15.37%, with an average of 10.44%. These results indicate that the occurrence of critical condition degradation in the finishing materials is minimal in both schools, though slightly more present in Asmaa Bent Abi Bakr School.
By reviewing the results of the research samples in relation to the evaluation of indicators for the condition and durability of finishing materials, a set of conclusions was reached that can provide a basis for the recommendations that should be taken into consideration, as follows:
•Stone finishing materials exhibit strong resistance to staining due to their technical properties, such as density, hardness, and surface cohesion, making them suitable for environmental and human conditions related to staining.
•The results indicate that the finishing materials used on school facades exhibit weak resistance to dimensional stability when exposed to extreme temperatures in the hot and arid local climate. This leads to an increased rate of material deterioration, which also affects their moisture resistance.
•Laboratory testing and simulation results show that the hardness of the finishing materials used on school facades is insufficient to withstand environmental and human conditions, which explains the continuous deterioration and falling of facade materials and their increased need for maintenance.
•The materials used on facades are not suitable for local climate conditions and human use in terms of corrosion resistance, leading to pitting and peeling of material surfaces, and thus increasing the rate of degradation.
•The weak impact resistance of the finishing materials makes them unsuitable for human use in school buildings, as they are prone to damage and falling due to frequent contact in areas heavily used by students and staff.
•The field survey of the research samples and the extracted results indicate high rates of deterioration, suggesting that the finishing materials are subjected to harsh environmental and human conditions, leading to high frequency and speed of degradation.
•This study successfully achieved its initial research objectives through a systematic evaluation of the technical performance of finishing materials used in school buildings in hot and arid environments. The research provided quantitative evidence regarding the durability, condition, and maintainability of these materials by integrating field surveys, laboratory testing, and analytical evaluations.
Additionally, the study successfully addressed several key research questions, including:
•What are the primary technical performance indicators for finishing materials in school buildings?
The study identified material durability (impact resistance, stain resistance, corrosion resistance, cleaning agent resistance, heat resistance, and moisture resistance) and material condition (extent and frequency of degradation, damage levels, and the impact of previous maintenance) as critical indicators for evaluating material performance.
•How do environmental and human factors influence the degradation of finishing materials?
The results showed that materials exposed to both environmental and human conditions (EHS samples) exhibited a significantly higher rate of deterioration compared to those exposed only to environmental conditions (ES samples).
The study found that extreme temperatures and humidity fluctuations contribute to material expansion, weaken adhesion, and accelerate degradation.
•What are the implications of material selection on maintenance and long-term building sustainability?
The frequent need for maintenance and repairs in schools using materials with poor impact and corrosion resistance increases operational costs and compromises structural integrity.
The research highlights the importance of selecting materials with high heat and moisture resistance, particularly in hot and arid climates, to reduce maintenance frequency and extend the lifespan of school buildings.
•What are the key factors contributing to material degradation?
The study highlighted dimensional instability, weak adhesion properties, and insufficient resistance to cleaning agents as major contributors to material failure.
Materials suffered from frequent detachment, primarily due to poor construction execution, lack of maintenance, and inappropriate material selection.
These findings provide valuable insights for optimizing material selection and improving maintenance strategies, ultimately enhancing the sustainability and durability of school buildings in challenging environmental conditions.
These results provide valuable insights for improving the technical performance of the finishing materials used in schools, with a focus on enhancing certain weak aspects and ensuring the continuity of good performance over the long term. Accordingly, the following recommendations can be made:
Improved material selection for harsh environments: The study demonstrates that materials with weak resistance to heat, moisture, and mechanical stress degrade rapidly, leading to frequent maintenance and high costs. Therefore, future material selection should prioritize high-performance materials with superior heat resistance, moisture protection, and impact durability to ensure long-term sustainability.
Developing local standards for finishing materials: Given the high degradation rates observed in school building facades, there is a need to establish local material performance standards. These should define acceptable resistance levels for impact, wear, corrosion, and heat, ensuring that materials used in construction projects align with the environmental and human stress factors specific to the region.
Enhancing quality control in material application: The research found that many finishing materials failed due to poor bonding strength and dimensional instability. To mitigate this, stricter quality control measures should be implemented in material application processes, including better adhesive selection, optimized installation techniques, and adherence to international building codes.
Adopting preventive maintenance strategies: The high degradation rates of materials indicate that reactive maintenance (repairing after damage) is ineffective. Instead, schools should implement preventive maintenance plans that involve regular inspections, timely cleaning, and protective treatments to extend the lifespan of finishing materials.
Investing in advanced protective coatings: Surface treatments such as anti-corrosion coatings, waterproofing layers, and UV-resistant finishes should be incorporated into building materials to enhance their durability. This can significantly reduce material wear, staining, and environmental damage.
Optimizing the use of natural and sustainable materials: Stone and ceramic materials demonstrated higher resistance to environmental and human-induced degradation. Where possible, the use of natural stone and eco-friendly materials should be prioritized to improve performance while maintaining environmental sustainability.
Standardizing maintenance training for school staff: To ensure long-term material performance, maintenance staff should be trained in proper cleaning techniques, material handling, and early damage detection. This will help prevent unnecessary deterioration and costly replacements.
Exploring alternative materials and technologies: Future research should investigate the use of innovative materials such as self-healing coatings, nanotechnology-based finishes, and smart materials that adapt to environmental conditions. These advancements could revolutionize the durability and maintenance of finishing materials.
Integration of material testing in pre-construction planning: Instead of relying solely on manufacturer specifications, material performance should be tested under real-world environmental conditions before large-scale application in school buildings. This will ensure that selected materials meet required performance standards.
Policymaking and governmental regulations: Policymakers should enforce the use of high-performance, environmentally adapted materials in public school construction projects. Government agencies should provide funding and support for research into more durable and cost-effective finishing materials.
By implementing these recommendations, future school buildings can achieve enhanced durability, reduced maintenance costs, and improved safety and functionality, ultimately ensuring a sustainable built environment.
Despite the valuable insights provided by this study, certain limitations should be acknowledged:
Limited sample scope: The study focused on two school buildings, which, while representative, may not fully encompass the variability of finishing materials used in all school environments. Expanding the sample size across different regions with varying climatic and human factors could provide more generalizable findings.
Environmental simulation constraints: The laboratory tests were designed to simulate environmental and human exposure conditions as closely as possible. However, real-world conditions are dynamic and complex, and the controlled testing environment may not fully capture long-term material degradation patterns.
Material selection and availability: The study was limited to the materials currently used in the selected school buildings. Newer materials with potentially better performance characteristics were not included due to availability constraints.
Short-term observation: The research evaluated the performance of finishing materials based on existing data and laboratory simulations. Longitudinal studies that track material performance over extended periods in real-world settings would provide more robust insights into degradation rates and maintenance needs.
Limited exploration of human impact: While human usage was considered in the analysis, detailed studies on behavioral patterns and their direct correlation to material degradation were not extensively conducted. Future research could incorporate behavioral impact assessments to refine material selection criteria.
To further enhance understanding and improve the technical performance of finishing materials in school buildings, future studies should explore the following areas:
Development of local performance standards: Establishing regional technical performance criteria for finishing materials tailored to local environmental and human factors would aid in better material selection and long-term sustainability.
Advanced material technologies: Investigating the potential of emerging materials, such as nanotechnology-based coatings, self-healing materials, and high-performance composites, could significantly improve material durability and maintenance feasibility.
Integration of smart monitoring systems: Future studies could explore the implementation of real-time monitoring systems embedded within building materials to track degradation patterns and predict maintenance needs more accurately.
Comparative analysis of finishing materials: Expanding the study to include a wider range of finishing materials across different building types and environments could provide a more comprehensive understanding of their performance.
Sustainable and eco-friendly alternatives: Exploring the viability of sustainable, locally sourced, and environmentally friendly materials could enhance both durability and environmental impact reduction.
Economic and cost-benefit analysis: Incorporating cost assessments into future research would help policymakers and building designers make informed decisions regarding material selection based on long-term cost efficiency and sustainability.
Human Behavior and material degradation: Conducting in-depth studies on how user behavior affects material longevity would contribute to better design strategies and material applications in high-traffic school environments.
By addressing these limitations and pursuing the outlined future research directions, further advancements can be made in optimizing the selection, application, and maintenance of finishing materials for school buildings, ultimately contributing to more durable, sustainable, and cost-effective educational infrastructure.
[1] Global Finishing Solutions (GFS). (2019). Understanding the importance of quality finishes. https://globalfinishing.com/2019/03/06/understanding-the-importance-of-quality-finishes/.
[2] A. Radhy, Introduction to finishing works. https://n9.cl/cui21.
[3] C. Dictionary, Performance meaning. https://dictionary.cambridge.org/dictionary/english/performance.
[4] C. Dictionary; Definition of performance. https://www.collinsdictionary.com/dictionary/english-thesaurus/performance.
[5] Wang, Y., Jiang, B., Pan, W. (2019). Towards an understanding of performance, reliability, and security. In Advanced Methodologies and Technologies in Network Architecture, Mobile Computing, and Data Analytics, pp. 1575-1587. https://doi.org/10.4018/978-1-5225-2255-3.ch660
[6] Mabaquiao, N.M. (2018). Speech act theory: From Austin to Searle. Augustinian, 19(1): 35-45.
[7] Yu, C.J., Ri, B.H., Kim, C.H., Hwang, U.S., Ri, K.C., Song, C.J., Kim, U.C. (2019). Formation and characterization of ceramic coating from alumino silicate mineral powders in the matrix of cement composite on the concrete wall. Materials Chemistry and Physics, 227: 211-218. https://doi.org/10.1016/j.matchemphys.2019.02.012
[8] Chatti, S., Laperrière, L., Reinhart, G., Tolio, T. (2019). CIRP Encyclopedia of Production Engineering. Springer.
[9] Rolstadås, A. (1998). Enterprise performance measurement. International Journal of Operations & Production Management, 18(9/10): 989-999. https://doi.org/10.1108/01443579810225577
[10] Dwight, R. (1999). Searching for real maintenance performance measures. Journal of Quality in Maintenance Engineering, 5(3): 258-275. https://doi.org/10.1108/13552519910282728
[11] Hauber, R. (2003). Performance Measurement in der Forschung & Entwicklung. Deutscher Universitätsverlag.
[12] Krause, O. (2007). Performance Management: Eine Stakeholder-Nutzen-orientierte und Geschäftsprozess-Basierte Methode. Springer-Verlag.
[13] Decocity-Why finishing materials are important in construction. https://www.decocity.com.ph/why-finishing-materials-are-important-in-construction/.
[14] Koca, G. (2016). Interior finishing materials. In Developments in Science and Engineering, pp. 588-601. https://www.researchgate.net/publication/320800578_Interior_Finishing_Materials.
[15] Lützkendorf, T., Speer, T., Szigeti, F., Davis, G., Le Roux, P., Kato, A., Tsunekawa, K. (2005). A comparison of international classifications for performance requirements and building performance categories used in evaluation methods. Performance Based Building, 61-80.
[16] Gharajedaghi, J. (2011). Systems Thinking: Managing Chaos and Complexity: A Platform for Designing Business Architecture. Elsevier.
[17] Khafajy, A., Hussain, A., Abod, A. (2011) Building performance A study for evaluate prefabricated residational buildings performance. Iraqi Journal of Architecture and Planning, 10(22): 255-277. https://iqjap.uotechnology.edu.iq/article_159616.html.
[18] van der Voordt, D.J.M., van Wegen, H.B. (2007). Architecture in Use. Routledge.
[19] Ibem, E.O., Opoko, A.P., Adeboye, A.B., Amole, D. (2013). Performance evaluation of residential buildings in public housing estates in Ogun State, Nigeria: Users' satisfaction perspective. Frontiers of Architectural Research, 2(2): 178-190. https://doi.org/10.1016/j.foar.2013.02.001
[20] Hamida, M.B. (2020). Development of a framework for the effective implementation of building adaptive reuse throughout the project Life-Cycle in Saudi Arabia. Doctoral dissertation, Architectural Engineering Department, King Fahd University of Petroleum & Minerals.
[21] Vischer, J.C. (2008). Towards a user-centred theory of the built environment. Building Research & Information, 36(3): 231-240. https://doi.org/10.1080/09613210801936472
[22] Meir, I.A., Garb, Y., Jiao, D., Cicelsky, A. (2009). Post-occupancy evaluation: An inevitable step toward sustainability. Advances in Building Energy Research, 3(1): 189-219. https://doi.org/10.3763/aber.2009.0307
[23] Khalil, N., Nawawi, A.H. (2008). Performance analysis of government and public buildings via Post Occupancy Evaluation. Asian Social Science, 4(9): 103-112. https://doi.org/10.5539/ass.v4n9p103
[24] Sharpe, T. (2013). Building performance evaluation. In Innovations for Sustainable Building Design and Refurbishment in Scotland: The Outputs of CIC Start Online Project, pp. 127-146. https://doi.org/10.1007/978-3-319-02478-3_8
[25] Preiser, W.F., Hardy, A.E., Schramm, U. (2017). From linear delivery process to life cycle phases: The validity of the concept of building performance evaluation. In Building Performance Evaluation: From Delivery Process to Life Cycle Phases, pp. 3-18. https://doi.org/10.1007/978-3-319-56862-1_1
[26] Waggener, L. (2014). Performance-based finishes. Health Facilities Management, 27(7): 35-39, https://www.hfmmagazine.com/articles/1321-performance-based-finishes.
[27] Marteinsson, B., Jónsson, B. (1999). Overall survey of buildings-performance and maintenance. In The 8th International Conference on Durability of Building Materials and Components, 8DBMCAt: Vancouver, Canada, pp. 1634-1654.
[28] Sherif, A.H. (2013). Finish materials of hospital operating rooms of the USA and Egypt: Selection and actual performance-in-use. In AEI 2013: Building Solutions for Architectural Engineering, pp. 145-154. https://doi.org/10.1061/9780784412909.015
[29] Zhang, T., Tan, Y., Yang, H., Zhang, X. (2016). The application of air layers in building envelopes: A review. Applied Energy, 165: 707-734. https://doi.org/10.1016/j.apenergy.2015.12.108
[30] Thomas, T.R. (1981). Characterization of surface roughness. Precision Engineering, 3(2): 97-104. https://doi.org/10.1016/0141-6359(81)90043-X
[31] Katar, I.M. (2017). Evaluate state-of-the-art carbon fibers’ composites (CFC) as finishing materials in building construction. International Journal of Applied Engineering Research, 12: 13826-13833.
[32] Walters, W.L. (1996). Determination of impact resistance by measurement of coefficient of restitution. British Ceramic Research Ltd. Qualicer.
[33] ISO 10545-14:2015. (2015). Determination of resistance to stains. https://www.iso.org/standard/60972.html.
[34] NF EN ISO 10545-6:2012. (2013). Ceramic tiles - Part 6: Determination of resistance to deep abrasion for unglazed tiles. https://shop.standards.ie/en-ie/standards/nf-en-iso-10545-6-2012-63023_saig_afnor_afnor_134726/.
[35] BS EN 13036-4:2011. (2011). Road and airfield surface characteristics. Test methods - Method for measurement of slip/skid resistance of a surface: The pendulum test. https://knowledge.bsigroup.com/products/road-and-airfield-surface-characteristics-test-methods-method-for-measurement-of-slip-skid-resistance-of-a-surface-the-pendulum-test.
[36] Pendulum Tester Training. https://www.munroinstruments.com/product/pendulum-tester-training/.
[37] ISO 10545-8:2014. (2014). Part 8: Determination of linear thermal expansion. https://www.iso.org/standard/60973.html.
[38] 7.0ft³ Bench Oven, 300°F Max (Digital Controller). https://www.globalgilson.com/70ft-bench-oven-with-digital-controller-300f-max.
[39] BSI. (2021). Ceramic tiles – Determination of moisture expansion. https://knowledge.bsigroup.com/products/ceramic-tiles-determination-of-moisture-expansion (accessed 30/4/2024.
[40] ISO 10545-4:2019. (2019). Part 4: Determination of modulus of rupture and breaking strength. https://www.iso.org/standard/69619.html.
[41] ISO 10545-3:2018. (2018). Part 3: Determination of water absorption, apparent porosity, apparent relative density and bulk density. https://www.iso.org/standard/68006.html.
[42] Glass Desiccators (Vacuum Type) NL 7006 G. https://nl-test.com/products/miscellaneous-testing-equipments/product/395-glass-desiccators-vacuum-type-nl-7006-g.
[43] BS EN 12004-2:2017. (2017). Adhesives for ceramic tiles Test methods. https://www.en-standard.eu/bs-en-12004-2-2017-adhesives-for-ceramic-tiles-test-methods/?srsltid=AfmBOorzESmP1NZPOhR5k37tmt6_bnKlxIMawuIzN2NkMXifiUpoy0RM.
[44] Pull-off Tester LR-P6. https://www.langryndt.com/pull-off-tester-lr-p6/#.