Safira Dina Febriana![]() | Giva Andriana Mutiara*
| Giva Andriana Mutiara*![]() | Bayu Erfianto
| Bayu Erfianto![]()
© 2025 The authors. This article is published by IIETA and is licensed under the CC BY 4.0 license (http://creativecommons.org/licenses/by/4.0/).
OPEN ACCESS
Traditional approaches to assessing meat freshness continue to depend on visual inspection, manual olfactory evaluation, or laboratory analyses that are often subjective, labor-intensive, and expensive. To address these gaps, this study developed E-Sniffer, an Internet of Things (IoT)-based meat freshness detection tool that identifies the freshness level of meat through odor analysis using SGP40, MQ-137, and DHT22 sensors. These sensors identify decay gases including Total Volatile Organic Compounds (TVOC), Ammonia (NH₃), Hydrogen Sulfide (H₂S), and Trimethylamine (TMA), temperature and humidity. The collected data is analyzed through an ESP32 microcontroller with Mamdani Fuzzy Logic algorithm to categorize the freshness of meat into three distinct levels: fresh, slightly spoiled, and not fresh. The analysis results display on a Nextion Touch Display and transmitted via Bluetooth, enabling monitoring through a Flutter-based app. Experiments conducted on beef, chicken, and fish revealed an impressive detection success rate of 80%, accompanied by an average response time of just 10 seconds. The accuracy of the results is ensured through a manual comparison method for validation. This innovation positions E-Sniffer as an objective, rapid, and portable solution for consumers, restaurants, and the food industry in assessing meat freshness, ultimately enhancing food safety and the quality of products consumed.
E-Sniffer, H2S, IoT, food safety, fuzzy logic, NH3, TMA, TVOC
Ensuring food safety is vital in the food industry, particularly when it comes to maintaining the freshness of ingredients like meat. Meat is a significant source of nutrition that contributes to meeting human dietary requirements. Meat serves as a crucial source of animal protein, playing an important role in the diets of individuals across different regions globally. The attributes of meat, such as its freshness, texture, flavor, and aroma, play a crucial role in influencing consumer acceptance of the product. Typically, fresh meat is noted for its vibrant hue, firm texture, and unique natural scent. Conversely, spoiled meat exhibits notable discoloration, heightened moisture levels, and releases foul odors as a result of microbial activity [1, 2]. This condition presents a significant challenge in maintaining the quality of the meat until it is delivered to consumers.
Conventional techniques employed to assess meat freshness encompass visual inspection, olfactory evaluation, and tactile examination. Nevertheless, this method is frequently viewed as subjective since it depends significantly on personal experience and perception [3]. Moreover, traditional approaches fail to deliver quantitative data suitable for subsequent analysis [4]. Furthermore, traditional approaches, particularly when subjective laboratory assessments are involved, tend to be both time-intensive and expensive. Consequently, advancements in contemporary technology, especially regarding sensors and the IoT, provide a more objective and efficient approach to assessing the freshness level of meat [5].
One of the latest technologies that is beginning to see widespread application is IoT-based devices like E-Sniffer. E-Sniffer is a device designed to identify a range of chemical compounds linked to the meat spoilage process, including Total Volatile Organic Compounds (TVOC), Ammonia (NH3), Hydrogen Sulfide (H2S), and Trimethylamine (TMA) [6]. The device features an array of sensors, including the SGP40 for detecting TVOC, H2S, and TMA, the MQ-137 for NH3 detection, and the DHT22 for measuring the temperature and humidity in the surrounding air of the meat [7, 8].
The SGP40 sensor utilizes Metal Oxide Semiconductor (MOS) technology that is able to measure changes in resistance due to interaction with certain gases, such as TVOC. This gas is often released during the spoilage process of meat, serving as a crucial marker for assessing its quality [9].
The MQ-137 sensor exhibits a notable sensitivity to NH3, a significant byproduct resulting from the decomposition of proteins in meat [10]. Thus, it provides a significant contribution to the identification process of Freshness levels based on biologically formed gas profiles.
Furthermore, this device employs an ESP32 microcontroller as the core for data processing. This microcontroller was selected due to its effective data processing capabilities from sensors, minimal power usage, and compatibility with Flutter-based applications through Bluetooth connectivity. Consequently, individuals can observe the detection outcomes in real-time through a mobile device [11, 12].
The integration of these sensors with machine learning enhances the precision of detecting volatile gases in spoiled food [13]. The study [14] demonstrated that machine learning algorithms facilitate quicker and more accurate gas detection, whereas volatile analysis can serve as a key indicator of meat quality [13]. Fuzzy logic is increasingly being adopted in meat detection systems due to its ability to handle various sensor parameters, resulting in more accurate predictions. Investigations have shown the efficacy of fuzzy-based systems in assessing the quality of fish and beef through the analysis of color and odor [15, 16]. Nonlinear fuzzy models have demonstrated their capability to forecast environmental changes impacting meat storage conditions [17]. Furthermore, a fuzzy logic-based image processing method has been utilized for detecting fish freshness and assessing meat marbling [18, 19].
The integration of IoT and mobile applications facilitates immediate oversight of meat quality. The system is capable of delivering automatic alerts when meat begins to spoil, thereby enhancing the food distribution chain and upholding food safety standard [3, 20]. Studies indicate that integrating IoT, fuzzy logic, and machine learning can lead to groundbreaking advancements in monitoring meat quality [21, 22]. The advancements in IoT technology and gas sensors have led to remarkable improvements in the detection of meat freshness. The implementation of devices like E-Sniffer enables consumers to more readily identify fresh meat, while the incorporation of machine learning and mobile applications enhances monitoring efficiency. These advancements are anticipated to enhance food safety and reduce the likelihood of consuming unfit meat [19].
Therefore, this study aims to develop and assess E-Sniffer, an IoT-enabled device designed to objectively measure meat freshness via volatile compound analysis. The goal is to explore potential applications of E-Sniffer and enhance food safety and the food industry through automated monitoring and early detection of meat spoilage. The system contributes a crucial role in ensuring food safety within the food industry, aiding in the prevention of unfit meat consumption and minimizing the risk of disease associated with spoiled meat consumption.
This paper will be outlined in a composition where the first chapter provides an overview of the study's introduction. Chapter 2 outlines the approach taken for the study. Chapter 3 presents the findings and engages in a discussion. Chapter 4 outlines the conclusions drawn and the directions for future research.
2.1 Methodology
This study employs an experimental methodology that encompasses several key phases, including system design, implementation, testing, and data analysis. Every phase is executed methodically to guarantee that the Internet of Things (IoT)-based meat freshness detection system operates at peak efficiency and delivers precise outcomes [6].
The initial phase involves the creation of both hardware and software designs. At this stage, the primary components, including the SGP40, MQ-137, and DHT22 sensors, along with the ESP32 microcontroller, were chosen and utilized as the central hub for data processing. Furthermore, a Mamdani Fuzzy Logic algorithm framework was developed to analyze sensor data in an accessible manner [7]. At this stage, a system interface was designed to connect the hardware with the Flutter-based application, enabling the real-time display of detection results.
After the design phase concludes, the implementation of the system takes place, involving the assembly of hardware components in line with the established design specifications. The ESP32 microcontroller is designed to handle data from the sensors, subsequently transmitting meat freshness information to the Nextion Touch Display and mobile application through Bluetooth connectivity [3]. Preliminary evaluations are conducted to verify that all sensors operate effectively and deliver accurate data in alignment with environmental conditions.
The subsequent phase involves testing and validation, focusing on assessing the system's effectiveness in precisely identifying the freshness of meat. During this phase, samples of beef, chicken, and fish are introduced into the detection system for a specified duration. Subsequently, variations in the levels of TVOC, NH3, H2S, and TMA gases are observed, along with environmental factors like temperature and humidity [12].
The data collected is compared with the results of conventional methods, such as visual and olfactory observations, as well as laboratory testing of the microbiological content of the meat. The findings from the testing phase are utilized to enhance the performance of the fuzzy logic algorithm, aiming for improved accuracy and efficiency in detection. Overall, this study aims to develop a system to detect meat freshness that is more objective and efficient than conventional methods. Through the integration of IoT technology, gas sensors, and fuzzy logic algorithms, this system aims to assist consumers and the food industry in preserving meat quality and enhancing food safety.
2.2 Proposed system
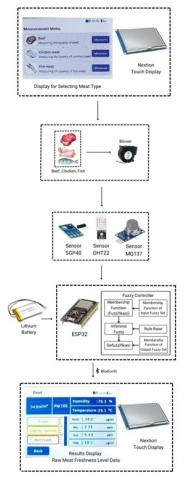
The background of the study has outlined various literature reviews that encompass an innovative meat detection system based on earlier investigations. The system outlined in this study is illustrated in the block diagram presented in Figure 1.
Figure 1. Flowchart of the proposed system
Figure 1 illustrates the operational framework of the E-Sniffer, an IoT-enabled tool designed for detecting meat freshness through the utilization of gas sensors and fuzzy logic. The figure offers a detailed depiction of the process flow, illustrating how it proceeds from the collection of sensor data to the generation of detection results. This system is composed of several key components, including the Nextion Touch Display, a gas sensor, the ESP32 microcontroller, a fuzzy logic algorithm for classifying freshness, and Bluetooth connectivity for monitoring data.
The process begins with the Nextion Touch Display, which provides a user interface for selecting the type of meat to be tested, including options such as fish, chicken, or beef. Upon selecting the meat type, sensors utilizing SGP40, MQ-137, and DHT22 commence monitoring the gases emitted during the decomposition process of the meat. The SGP40 sensor serves as a key component in detecting gaseous compounds such as Total Volatile Organic Compounds (TVOC), Hydrogen Sulfide (H2S), and Trimethylamine (TMA), which are released during the decomposition process of meat. The presence of TVOC serves as an early indicator of general spoilage, while H2S and TMA act as critical biomarkers, particularly associated with the degradation of fish meat. Accordingly, this sensor plays a crucial role in the classification system of freshness levels across various types of meat. The MQ-137 sensor is specifically designed to detect Ammnonia (NH3) concentrations, a compound produced through protein deamination reactions during the initial spoilage phase, especially in chicken and beef. Meanwhile, the DHT22 sensor is employed to monitor environmental parameters such as temperature and relative humidity, which significantly influence the formation dynamics of volatile compounds in meat, considering that high temperature and humidity levels can accelerate biological spoilage processes. To enhance the detection process, a blower or fan is employed to facilitate the movement of gas from the meat's surface towards the sensor.
The information collected from the sensors is subsequently transmitted to the ESP32, which serves as the primary processing unit. This Device was selected based on its capability to efficiently handle multi-channel data processing, low power consumption, and support for wireless connectivity, including Bluetooth. Within the ESP32, a Fuzzy Controller operates through three primary processes: Fuzzification, Fuzzy Inference, and Defuzzification. Fuzzy logic is considered more adaptive to the uncertainty of sensor data, as it accommodates inputs in linguistic forms such as “Fresh”, “Slightly Spoiled”, and “Not Fresh”. The objective of these processes is to transform sensor data into values indicative of meat freshness, utilizing membership functions and a set of fuzzy rules. The system categorizes meat freshness into three distinct classifications: fresh, slightly spoiled, and not fresh.
The analysis results are subsequently presented on the Nextion Touch Display, showcasing the freshness level of the meat through numerical data and classification. Furthermore, the system features Bluetooth connectivity, enabling the transmission of detection data to a mobile app for real-time monitoring. The presence of this display enables users to monitor the condition of the meat directly and efficiently, thereby supporting the decision-making process in the context of food safety.
To enhance mobility and power efficiency, the system incorporates a rechargeable lithium battery, enabling users to utilize the device with flexibility, free from reliance on a stationary power source. The E-Sniffer represents a groundbreaking advancement in the realm of meat freshness detection, offering a solution that is not only faster and more accurate but also user-friendly across diverse settings such as homes, restaurants, and the food sector.
2.2.1 Hardware installation
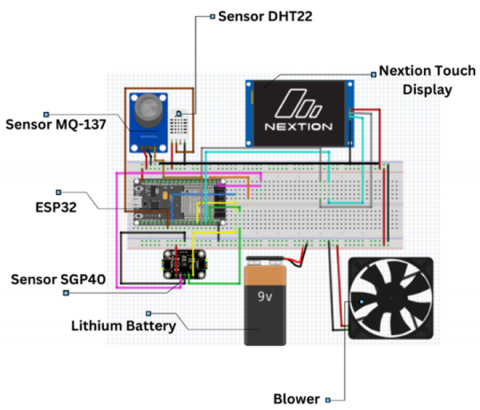
This system comprises essential elements such as sensors and microcontrollers that are specifically engineered to monitor environmental parameters instantaneously. The ESP32 microcontroller serves as a central hub for receiving and processing data from sensors in real-time [23]. Additional elements incorporated comprise the Nextion Touch Display module, serving as a user interface that presents the meat freshness status [24]. The diagram of the hardware circuit is presented in the figure below. This diagram illustrates the connections among the primary elements within the system, such as the sensors, microcontroller, and interface devices.
The e-sniffer hardware circuit image in Figure 2 features several key components, including the Nextion Touch Display, which serves to present gas measurement data and is linked to the ESP32 DevKit V1 through TX and RX serial communication. The SGP40 sensor is designed to identify TVOC, H2S, and TMA gases. The MQ-137 sensor is designed for the detection of NH3 gas. In the meantime, the DHT22 sensor captures the temperature and humidity of the environment, which influences gas measurements. In the preliminary study, spoiled meat that had been stored in a refrigerator for approximately 12 hours showed a reduction in gas emissions, which posed a risk of being detected as fresh. To prevent such misdetection, the DHT22 sensor is required as a corrective parameter that adjusts the gas detection thresholds based on environmental conditions, allowing the system to accurately assess meat freshness even at low temperatures. The ESP32 serves as the primary microcontroller, processing sensor data and managing the DC fan to enhance measurement accuracy through improved air circulation. All components are interconnected through a breadboard utilizing jumper cables, powered by a Lithium Battery that guarantees a consistent power supply to the entire circuit. This circuit enables the e-sniffer to function effectively in identifying and presenting air quality data.
Figure 2. Hardware installation
2.2.2 3D casing
The system features a ventilated casing to guarantee effective gas detection. The casing material consists of acrylic, known for its corrosion resistance and straightforward assembly process. The mechanical design takes into account the strategic positioning of sensors to reduce interference among them [11]. The 3D Casing Design illustrated in Figure 3 clearly demonstrates this concept.
Figure 3. Three-D casing design
According to Figure 3, the role of the 3D casing design serves as a vessel for the meat detection process. The separate chamber used in the E-Sniffer system functions as a simulated meat storage space, where volatile gases produced during decomposition can accumulate and be detected by the sensors. Inside this chamber, raw meat (such as beef, as shown in the image) is placed alongside three types of sensors: the SGP40 sensor, which detects TVOC, H2S, and TMA; the MQ-137 sensor, which is specifically designed to detect Ammonia (NH3); and the DHT22 sensor, which measures ambient temperature and humidity. The closed design of the chamber aims to create a stable microenvironment that closely mimics actual meat storage conditions, allowing for optimal gas diffusion toward the sensors.
Meanwhile, the bottom section of the E-Sniffer Device Box houses a breadboard, serving as the central connection hub between the sensors and the system’s main components. From the breadboard, all cables connect to the main device box containing the ESP32 microcontroller as the system’s core processor and the Nextion Touch Display as the local output screen. System evaluation can be carried out by observing gas diffusion efficiency, ensuring that the storage chamber is sufficiently sealed to retain the gases emitted by the meat for long enough periods to allow accurate detection. Sensor stability can be evaluated by performing repeated readings over a certain time frame on the same meat sample to check for result consistency and determine whether environmental factors such as temperature or humidity significantly affect the sensor outputs.
2.3 Research parameter fuzzy
This system is designed to analyze data obtained from sensors through the application of the Mamdani Fuzzy Logic Algorithm. Fuzzy logic is selected for its capacity to manage uncertain data and deliver more accurate decisions compared to traditional methods. [25, 26]. This algorithm aims to classify the freshness of meat by analyzing the detected parameter values. Classification is conducted under three conditions fresh, slightly spoiled, not fresh [15]. his algorithm transforms numeric data collected from sensors into linguistic output that is easily comprehensible for users [7]. The Fuzzy Controller illustrated in Figure 4 clearly demonstrates this.
Figure 4. Fuzzy controller
Table 1. Data membership function
|
GAS |
Fresh |
Slightly Spoiled |
Not Fresh |
|
TVOC |
0-75 |
100-150 |
200-300 |
|
NH3 |
0-50 |
75-125 |
150-250 |
|
H2S |
0-50 |
75-125 |
150-250 |
|
TMA |
0-75 |
100-150 |
200-300 |
The steps illustrated in Figure 4 represent the Mamdani Fuzzy algorithm, encompassing various processes such as the Fuzzification of input data (Membership Function), Fuzzy Inference, and Defuzzification to generate the final output. The Fuzzy rules are organized in a table format that incorporates a variety of parameters, as illustrated in Table 1. The system processes the data and subsequently transmits it through Bluetooth connectivity to a mobile application built on Flutter. Consequently, individuals have the capability to track the freshness of the meat in real-time through mobile devices [24, 27].
The membership function serves as a fuzzy parameter for each sensor, crafted to illustrate the connection between input values and the status of meat freshness. The Membership Function illustrated in Table 1 is clearly observable.
The calibration results presented in Table 1 aid in making the determination of fresh, slightly spoiled, and not fresh status.
2.3.1 TVOC
The fuzzy membership function TVOC (Total Volatile Organic Compounds) is utilized to assess the presence of volatile organic compounds in the meat quality detection system, which is classified into three categories: Fresh, Slightly Spoiled, and Not Fresh. In the fresh TVOC, within the Fresh category, the membership function is expressed as shown in Eq. (1). In the Slightly Spoiled category, the membership value is determined by Eq. (2). In the case of the Not Fresh category, the membership function is defined by Eq. (3).
$\mu_{{fresh }}(x)= \begin{cases}1 & { if~} 0 \leq x \leq 50 \\ \frac{75-x}{75-50} & { if~} 50<x \leq 75 \\ 0 & { if~} x>75\end{cases}$ (1)
$\mu_{ {slightldsagailed }}(x)= \begin{cases}0 & { if~} x<100 {~or~} x>200 \\ \frac{x-100}{125-100} & { if~} 100 \leq x \leq 125 \\ 1 & { if~} 125<x \leq 150 \\ \frac{200-x}{200-150} & { if~} 150<x \leq 200\end{cases}$ (2)
$\mu_{ {notfresh}}(x)= \begin{cases}0 & { if~} x<200 \\ \frac{x-200}{225-200} & { if~} 200 \leq x \leq 225 \\ 1 & { if~} 225<x \leq 250 \\ \frac{300-x}{300-250} & { if~} 250<x \leq 300\end{cases}$ (3)
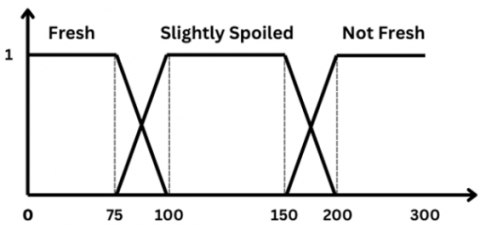
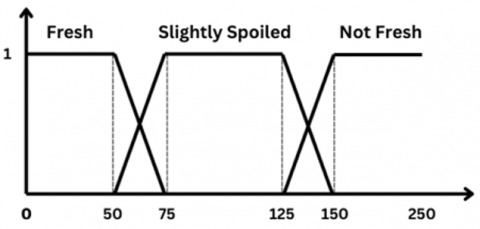
The fuzzy graph image illustrated in Figure 5 demonstrates the progression from fresh conditions on TVOC (0-75 ppm), to slightly spoiled on TVOC (100-200 ppm), and finally to not fresh on TVOC (>200 ppm), as derived from the Eqs. (1), (2), and (3).
Figure 5. TVOC fuzzy logic graph
2.3.2 NH3
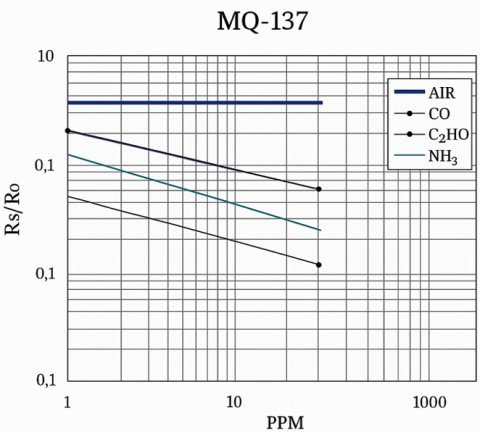
The calibration of the MQ-137 Ammonia gas sensor can be performed by referring to the information available in its datasheet, as illustrated in Figure 6 [28].
The first step begins with the process of acquiring analog data from the MQ-137 sensor, which is responsible for measuring the concentration of Ammonia (NH3) in the air. This sensor produces a signal in the form of an analog voltage (VRL), which is then read by the microcontroller (in this case, the ESP32) through an analog input pin
Figure 6. Datasheet calibration sensor
After obtaining the voltage value, the sensor’s resistance (Rs) is calculated using the technical Eq. (4):
$R_S=\left(\frac{V C}{V R L}-1\right) \times R_L$ (4)
where, Vc is the input voltage (typically 5V), and RL is the load resistor (for example, 47kΩ). With the obtained Rs Value and the Ro value (the sensor’s reference resistance after preheating), the Rs/Ro ratio is calculated, which indicates the degree of change in the sensor’s resistance relative to the concentration of NH3 gas [28].
This Rs/Ro ratio does not directly represent a value in ppm, so it must be converted using a logarithmic Eq. (5) derived from the datasheet graph:
$\log (p p m)=\frac{\log \left(\frac{R s}{R o}\right)-b}{m}$ (5)
With the constant values:
$m=-0.243~and~b=-0.323,$ the ppm value is then obtained by reversing the logarithmic equation, the final result of this process is a numerical value in ppm (parts per million), which represents the concentration of ammonia gas around the meat.
This ppm value is then used as input for the fuzzy logic system, specifically in the fuzzification stage. At this stage, the numerical value is fed into predefined membership functions. For example, if the NH3 value is 40 ppm, the system will calculate the degree of membership $(\mu)$ of that value in relation to the following three categories $\mu f r e s h(x), \mu s l i g h t l y s p o i l e d(x), \mu notfresh (x)$.
The fuzzy membership function of NH3 is utilized to assess the concentration of ammonia gas in the meat freshness detection system, categorized into three levels: fresh, slightly spoiled, and not fresh. In the Fresh category, the membership function is defined by Eq. (6). In the Slightly Spoiled category, the membership value is determined by Eq. (7). In the case of the Not Fresh category, the membership function is defined by Eq. (8).
$\mu_{\text {fresh }}(\mathrm{x})=\left\{\begin{array}{llc}1 & { if } & 0 \leq x \leq 25 \\ \frac{50-x}{50-25} & { if } & 25<x \leq 50 \\ 0 & { if } & x>50\end{array}\right.$ (6)
$\mu_{\text {slightlyspoiled }}(\mathrm{x})= \begin{cases}0 & { if~} x<75 {~or~} x>150 \\ \frac{x-75}{100-75} & { if~} 75 \leq x \leq 100 \\ 1 & { if~} 100<x \leq 125 \\ \frac{150-x}{150-125} & { if~} 125<x \leq 150\end{cases}$ (7)
$\mu_{\text {nottresh }}(\mathrm{x})= \begin{cases}0 & { if~} x<150 \\ \frac{x-150}{200-150} & { if~} 150 \leq x \leq 200 \\ 1 & { if~} 200<x \leq 225 \\ \frac{250-x}{250-225} & { if~} 225<x \leq 250\end{cases}$ (8)
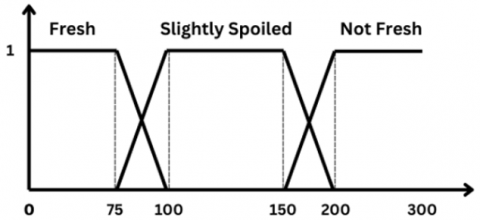
The fuzzy graph image in Figure 7 illustrates the progression from fresh conditions on NH3 (0-50 ppm), slightly spoiled on NH3 (75-150 ppm), to not fresh on NH3 (>150 ppm), as detailed by the outcomes of Eqs. (6), (7), and (8).
2.3.3 H2S
Fuzzy membership function H2S, is used to determine the level of presence of Hydrogen Sulfide (H2S) gas in the meat freshness detection system. H2S gas serves as a primary indicator of meat spoilage, arising from bacterial activity throughout the decomposition process. Elevated H2S levels suggest a decline in meat freshness. In the fresh category, the membership function is defined as shown in Eq. (9). In the slightly spoiled category, the membership value is determined by utilizing Eq. (10). In the case of the not fresh category, the membership function is represented by Eq. (11).
$\mu_{\text {fresh }}(\mathrm{x})=\left\{\begin{array}{llc}1 & { if } & 0 \leq x \leq 25 \\ \frac{50-x}{50-25} & { if } & 25<x \leq 50 \\ 0 & { if } & x>50\end{array}\right.$ (9)
$\mu_{ \text{slightlyspoiled }}(\mathrm{x})=\left\{\begin{array}{l}0 ~\quad \quad\quad { if~} x<75 {~or~ } x>150 \\ \frac{x-75}{100-75}\quad { if~} 75 \leq x \leq 100 \\ 1 ~\quad \quad\quad { if~} 100<x \leq 125 \\ \frac{150-x}{150-125} ~~{ if~} 125<x \leq 150\end{array}\right.$ (10)
$\mu_{\text {notfresh }}(\mathrm{x})=\left\{\begin{array}{l}0 ~~~\quad\quad\quad { if~} x<150 \\ \frac{x-150}{200-150} \quad { if~} 150 \leq x \leq 200 \\ 1 ~~\quad\quad\quad { if~ } 200<x \leq 225 \\ \frac{250-x}{250-225} ~~~ { if~} 225<x \leq 250\end{array}\right.$ (11)
Figure 7. NH3 and H2S fuzzy logic graph
As NH3, Figure 7, also illustrates a fuzzy graph that conveys details regarding the progression from fresh conditions on H2S (0-50 ppm), to slightly spoiled on H2S (75-150 ppm), and ultimately to not fresh on H2S (>150 ppm). The image is derived from the mapping outcomes of Eqs. (9), (10), and (11).
2.3.4 TMA
The fuzzy membership function for TMA (Trimethylamine) is utilized to assess the concentration of TMA gas in the system designed for detecting meat freshness. TMA gas is a volatile compound that arises from the breakdown of proteins, particularly in fish and meat from land animals. A significant contribution of TMA suggests an additional decay process, highlighting its importance as an indicator for evaluating meat quality. In the Fresh category, the membership function is defined by Eq. (12). In the Slightly Spoiled category, the membership value is determined using Eq. (13). In the case of the Not Fresh category, the membership function is defined by Eq. (14).
$\mu_{ {fresh }}(x)= \begin{cases}1 & { if~} 0 \leq x \leq 50 \\ \frac{75-x}{75-50} & { if~} 50<x \leq 75 \\ 0 & { if~} x>75\end{cases}$ (12)
$\mu_{ {slightlyspoiled }}(\mathrm{x})=\left\{\begin{array}{l}0 ~\quad \quad\quad { if~} x<100 {~or~ } x>200 \\ \frac{x-100}{125-100}\quad { if~} 100 \leq x \leq 125 \\ 1 ~\quad \quad\quad { if~} 125<x \leq 150 \\ \frac{200-x}{200-150} ~~{ if~} 150<x \leq 200\end{array}\right.$ (13)
$\mu_{ {notfresh }}(\mathrm{x})=\left\{\begin{array}{l}0 ~~~\quad\quad\quad { if~} x<200 \\ \frac{x-200}{225-200} \quad { if~} 200 \leq x \leq 225 \\ 1 ~~\quad\quad\quad { if~ } 225<x \leq 250 \\ \frac{300-x}{300-250} ~~~ { if~} 250<x \leq 300\end{array}\right.$ (14)
Figure 8. Fuzzy logic of TMA
Figure 8 illustrates a fuzzy graph that conveys transition information from Fresh conditions on TVOC (0-75 ppm), Slightly Spoiled on TVOC (100-200 ppm), to Not Fresh on TVOC (>200 ppm) as represented by Eqs. (12), (13), and (14).
2.3.5 Temperature and humidity
Two parameters that do not incorporate fuzzy logic are temperature and humidity. Temperature and humidity serve as critical factors in assessing the freshness of raw meat by identifying shifts in environmental conditions that may hasten bacterial proliferation and the generation of volatile compounds like TVOC, NH3, H2S, and TMA.
The limitations of using temperature and humidity as measures of meat freshness lie in their susceptibility to variations caused by external influences, including inconsistent storage conditions or temperature shifts that may not accurately represent the true state of the meat. Moreover, temperature and humidity merely offer a broad perspective without pinpointing the specific compounds responsible for decay.
Consequently, a robust approach involves integrating temperature and humidity data with the analysis of volatile compounds utilizing the TVOC module. This method enables the system to deliver enhanced accuracy in assessing the freshness of raw meat, considering both the physical and chemical elements that influence meat quality.
2.4 Fuzzy inference
Fuzzy inference generates output from a fuzzy system by utilizing the input membership values and the established fuzzy rules. This procedure is conducted utilizing fuzzy logic principles such as “AND”, “OR”, and “IF-THEN” rules.
2.4.1 Logika Fuzzy “AND” (Min)
Fuzzy logic “AND” combines multiple input conditions by identifying the smallest membership value. In this reasoning, if one of the inputs possesses a low membership value, then the output will correspondingly be low. The “AND” logic guarantees that all conditions are satisfied at the same time, as indicated by formula (15).
µoutput(x)=min(µinput1(x), µinput2(x),…) (15)
2.4.2 Logika Fuzzy “OR” (Max)
Fuzzy logic “OR” serves to identify the highest membership value from multiple inputs. In this framework, if one of the inputs possesses a significant membership value, then the output will similarly be elevated. The “OR” logic guarantees that a single condition is adequate to yield a significant value using formula (16).
µoutput(x)=max(µinput1(x), µinput2(x),…) (16)
2.4.3 Inference with “IF-THEN” Rules
Fuzzy inference utilizing the “IF-THEN” rule integrates the outcomes of multiple fuzzy rules. The inference process integrates the outcomes of multiple fuzzy rules by identifying the highest membership value from all pertinent rules, as illustrated in formula (17).
µoutputfinal(x)=max(µrule1(x), µrule2(x),…) (17)
2.5 System's defuzzification membership function
Defuzzification involves transforming fuzzy output (fuzzy membership values) into precise (numeric) values that can serve as conclusive decisions in a fuzzy system. The defuzzification formula is presented in formula (18).
$z=\frac{\int z .~\mu(z)~d z}{\int \mu(z)~d z}$ (18)
3.1 Calibration process
Prior to testing, calibration of the sensors is conducted to assess the freshness of meat, as the characteristics of the sensors play a crucial role in e-sniffers, ensuring precise and reliable gas detection linked to the freshness level of raw meat. The SGP40 sensor detects Total Volatile Organic Compounds (TVOC), Hydrogen Sulfide (H2S), and Trimethylamine (TMA) gas compounds. The release of these gases typically occurs during the decomposition of meat and serves as primary indicators of diminished meat quality. The MQ-137 sensor is designed to identify Ammonia (NH3) gas, a byproduct resulting from the breakdown of protein in meat. The detection of this gas signifies a further progression in the decomposition process. The DHT22 sensor measures the temperature and humidity of the air surrounding the meat, influencing the growth rate of microorganisms and the decay process.
Calibration of sensors involves establishing the range of values that indicate the freshness status of meat, categorized as "fresh", "slightly spoiled", and "not fresh". This calibration entails conducting laboratory tests with different meat samples to acquire precise reference data [29, 30]. The calibration process seeks to reduce detection errors stemming from environmental fluctuations and guarantees that the system delivers consistent and dependable outcomes [27].
3.2 Results
Testing was carried out to assess the system's capability in identifying the freshness level of raw meat by analyzing the concentration of TVOC, NH3, H2S, and TMA gases, alongside environmental factors like temperature and humidity. Samples of beef, chicken, and fish were introduced into the system for a designated duration to observe variations in the levels of gases generated [30, 31].
The test results from September to December 2024 revealed fluctuations in the ability to detect the freshness of raw meat through different sensors and storage conditions. In the initial experiment, raw meat was kept at refrigerator temperature and identified with the SGP40 sensor. The findings demonstrated that the graph exhibited consistency on a daily basis, suggesting that the meat's freshness was maintained at low temperatures. This indicates that refrigeration is effective in inhibiting bacterial growth and the development of volatile compounds.
A subsequent test was conducted on October 6, 2024, using the SGP40 sensor to identify meat kept at room temperature. The findings revealed that the graph exhibited a decline every 12 hours, signifying a reduction in the volatile compound content as a result of the decomposition process. The activity of microorganisms and chemical reactions that influence the gas composition detected by the sensor is enhanced at room temperature.
A subsequent test on October 29, 2024, was evaluations were conducted utilizing the MQ-135 sensor to assess the freshness of meat at ambient temperature. The findings illustrated a graph that rose every 12 hours, suggesting that the detected gas levels escalated with the extension of storage time. In the following trial, the MQ-135 sensor demonstrated significant sensitivity to gases generated during decomposition, including NH3 and H2S. The same phenomenon was observed in the test utilizing the MQ-137 sensor at room temperature, where the graph similarly displayed an upward trend every 12 hours, indicating a rise in volatile compounds as a result of decay.
Conducting tests with a combination of SGP40 and MQ-137 sensors utilizing a fuzzy logic approach. The findings indicate a rising pattern in the graph every 12 hours, supporting the conclusion that prolonged storage of meat at room temperature correlates with elevated levels of volatile compounds detected. Utilizing fuzzy logic allows for enhanced data processing from both sensors, leading to a more accurate classification of meat freshness.
The collected data underwent analysis through a fuzzy algorithm that integrates multiple sensor parameters to categorize the freshness condition of the meat as fresh, slightly spoiled, or not fresh. The test results indicate that the system achieves a success rate of 80% and maintains an average response time of 10 seconds for detecting meat freshness. The output range gas is illustrated in Table 2.
Table 2. Range gas output classification
|
Gas |
Output Range |
Classification |
|
TVOC |
0-100 |
Fresh |
|
NH3 |
0-75 |
|
|
H2S |
0-75 |
|
|
TMA |
0-100 |
|
|
TVOC |
100-200 |
Slightly Spoiled |
|
NH3 |
75-150 |
|
|
H2S |
75-150 |
|
|
TMA |
100-200 |
|
|
TVOC |
200-300 |
Not Fresh |
|
NH3 |
150-250 |
|
|
H2S |
150-250 |
|
|
TMA |
200-300 |
The measurement results from each sensor undergo analysis through fuzzy membership functions, transforming numerical data into linguistic output. This system employs the Mamdani fuzzy model, leveraging rules derived from parameter combinations to assess the freshness status of meat [5, 7]. The formulas employed in the fuzzy algorithm encompass membership functions, inference processes, and defuzzification stages. A clear formula calculation is illustrated with the categories of fresh, slightly spoiled, and not fresh, along with the membership function, fuzzy inference, and defuzzification detailed in Table 3.
Table 3 presents the fuzzy calculation utilized to assess the level of meat freshness through four gas parameters (TVOC, NH3, H2S, and TMA). The membership function outlines the degree to which a sample aligns with the Fresh, Slightly Spoiled, or Not Fresh classifications, featuring different membership values. The process of fuzzy inference categorizes based on established rules, and the subsequent defuzzification yields a final numerical value for decision-making purposes: 25 for fresh, 125 for slightly spoiled, and 250 for not fresh. This table demonstrates the operation of the fuzzy system in evaluating meat freshness levels using sensor data. In the interim, Table 4 presents the findings from the gas data analysis. Validation was performed through manual comparison techniques and laboratory assessments to confirm that the detection outcomes align with the true conditions of the meat [32].
Table 3. Fuzzy results
|
Classification |
Membership Function |
Fuzzy Inference |
Defuzzification |
|||||
|
TVOC |
NH3 |
H2S |
TMA |
Fresh |
Slightly Spoiled |
Not Fresh |
||
|
Fresh |
1 |
1 |
1 |
1 |
1 |
0 |
0 |
25 |
|
1 |
1 |
1 |
1 |
1 |
0 |
0 |
25 |
|
|
1 |
1 |
1 |
1 |
1 |
0 |
0 |
25 |
|
|
1 |
1 |
1 |
1 |
1 |
0 |
0 |
25 |
|
|
Slightly Spoiled |
0,588 |
0,96 |
1 |
0,764 |
0 |
0,764 |
0 |
125 |
|
0,588 |
0,96 |
1 |
0,764 |
0 |
0,764 |
0 |
125 |
|
|
0,588 |
0,92 |
1 |
0,764 |
0 |
0,764 |
0 |
125 |
|
|
0,588 |
0,96 |
1 |
0,776 |
0 |
0,776 |
0 |
125 |
|
|
Not Fresh |
1 |
0,517 |
0,397 |
0,844 |
0 |
0 |
1 |
250 |
|
1 |
0,517 |
0,397 |
0,844 |
0 |
0 |
1 |
250 |
|
|
1 |
0,517 |
0,397 |
0,844 |
0 |
0 |
1 |
250 |
|
|
1 |
0,507 |
0,397 |
0,844 |
0 |
0 |
1 |
250 |
|
Table 4. Gas threshold classification result
|
Classification |
TVOC |
NH3 |
H2S |
TMA |
|
Fresh |
34 |
2 |
8 |
16 |
|
35 |
3 |
8 |
16 |
|
|
34 |
0 |
8 |
16 |
|
|
35 |
5 |
8 |
16 |
|
|
Slightly Spoiled
|
60 |
26 |
22 |
94,1 |
|
60,3 |
26 |
22 |
94,1 |
|
|
60,3 |
27 |
22 |
94,1 |
|
|
60,3 |
26 |
22 |
94 |
|
|
Not Fresh |
264 |
188,8 |
179,8 |
242,2 |
|
264 |
188,8 |
179,8 |
242,2 |
|
|
264,1 |
188,8 |
179,8 |
242,2 |
|
|
264 |
188 |
179,8 |
242,2 |
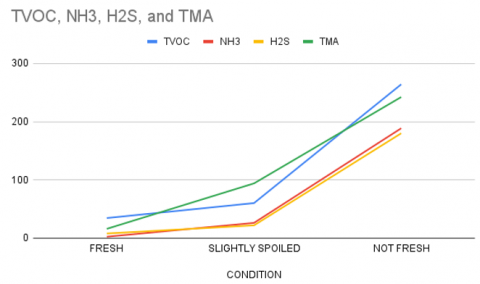
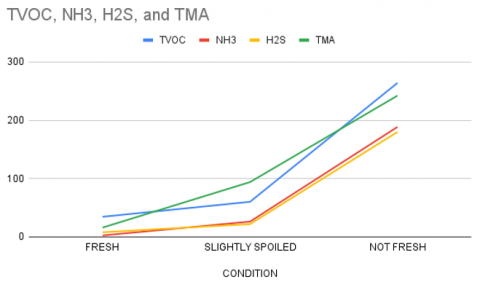
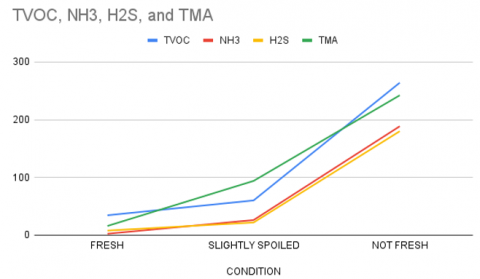
Figures 9, 10, and 11 display the outcomes of gas analysis conducted with the SGP40 and MQ137 sensors, highlighting the correlation between TVOC, NH3, H2S, and TMA parameters and the freshness status of the meat. This visualization enhances the understanding of the test data and offers a more profound perspective on the system performance. Figure 9 presents the gas analysis results for beef, Figure 10 illustrates the gas analysis for chicken, and Figure 11 depicts the gas analysis for fish.
Figure 9 indicates that, in their fresh state, the concentrations of TVOC, NH3, H2S, and TMA gases remain low. The transition to a slightly deteriorated state is accompanied by a notable rise in all compounds. As the meat deteriorates, there is a significant rise in gas levels, particularly in TVOC and TMA, indicating a pronounced prevalence of putrefaction processes.
Figure 9. Meat results graph measurement
Figure 10 indicates that under fresh conditions, gas levels are consistently stable and low. As conditions start to deteriorate, there is a noticeable rise in NH3 and TMA levels, signaling the onset of the rotting process. In deteriorating conditions, there is a marked increase in NH3 and TVOC levels, which is notably accompanied by a substantial rise in H2S.
Figure 10. Chicken results graph measurement
Figure 11 indicates that, in a fresh state, the concentration of gas compounds is at its minimum level. A change to slightly spoiled conditions results in a notable rise in H2S and TMA levels. The deterioration of fish leads to a significant rise in the concentrations of TVOC and H2S, indicating the accelerated decay process occurring at this stage.
Figure 11. Fish result graph measurement
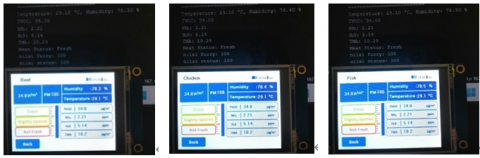
The detection results are presented on the Nextion Touch Display, enabling users to clearly observe the freshness status of the meat, as illustrated in Figure 12. This interface display provides data regarding gas concentration and the freshness status of the meat. A graph illustrating the changes in gas content is included to assist users in comprehending the pattern of meat spoilage over a specified timeframe.
Figure 12. Nextion touch display result
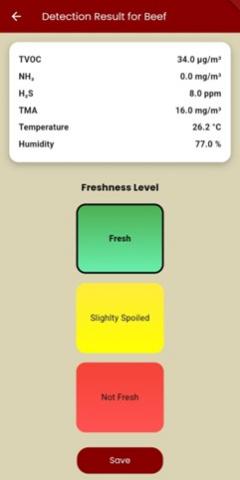
Figure 13. Mobile application display of beef detection results
The integration of the system with applications based on Flutter enables users to observe analysis results in real-time through mobile devices [30].
As illustrated in Figure 13, the E-Sniffer mobile application functions as a user interface that displays real-time freshness detection results based on sensor data. This application offers automatic notifications when the meat is no longer fresh, assisting users in making informed decisions about the storage or consumption of meat [33]. The application presents volatile gas parameters such as TVOC, NH3, H2S, and TMA in an informative and user-friendly format, automatically classifying the freshness level of the meat into three categories: Fresh, Slightly Spoiled, and Not Fresh. Its clean and structured visual layout enables users to monitor meat conditions quickly without requiring manual analysis, making it an efficient tool for on-site decision-making. This system integrates IoT technology, gas sensors, and fuzzy algorithms to deliver a novel approach for the food industry and consumers, ensuring the quality and safety of meat [30, 33].
3.3 Discussion
The test results indicated that the E-Sniffer achieved an accuracy rate of 80% in detecting meat freshness, accompanied by an average response time of 10 seconds. The results demonstrated that the integration of the SGP40 and MQ-137 sensors effectively identified the concentrations of spoilage gases, including TVOC, NH₃, H₂S, and TMA, which are associated with meat freshness. Testing conducted under cold storage conditions demonstrated that the gas levels-maintained stability, suggesting that lower temperatures effectively decelerated the spoilage process. Conversely, at room temperature, there was a notable rise in NH₃ and H₂S concentrations every 12 hours, suggesting an enhancement in microbial activity that expedited the decomposition of the meat.
Subsequent evaluations employing a combination of SGP40 and MQ-137 sensors alongside a fuzzy logic algorithm demonstrated that the system effectively categorized meat freshness into three primary classifications: Fresh, Slightly Spoiled, and Not Fresh. The observed trend of escalating volatile gases every 12 hours at room temperature substantiates the capability of the fuzzy logic mechanism to analyze sensor data effectively, yielding classification results that surpass those of traditional methods. This aligns with earlier research indicating that fuzzy logic enhances accuracy in gas sensor-based classification systems, particularly in the real-time evaluation of meat quality.
The system developed in this study demonstrates greater objectivity, speed, and reliability when contrasted with traditional methods like visual inspection and manual smelling. The test results indicated that the MQ-137 sensor exhibits a high sensitivity to NH₃, a crucial marker for protein spoilage. In contrast, SGP40 demonstrated a more consistent response to TVOC and TMA, both of which are critical for evaluating the spoilage rate of fish meat, known for its elevated TMA levels. The test results for beef, chicken, and fish exhibited a consistent pattern of increasing gas levels, albeit with varying spoilage rates. Notably, fish demonstrated a faster spoilage rate compared to beef and chicken, aligning with their inherent biological characteristics.
The tolerance limits for gas concentrations used in this study are not universal, as they were determined through calibration based on specific types of meat—namely beef, chicken, and fish—under particular storage conditions. For instance, TMA was found to be more dominant during the spoilage of fish, whereas NH₃ levels tended to be higher in chicken and beef. Certain parameters such as TVOC and NH₃ can be more flexibly applied across various types of meat, including beef, chicken, fish, and potentially lamb and turkey. However, compounds like TMA and H₂S are more specific, with TMA being a distinct marker of fish spoilage, and H₂S typically detected in higher concentrations in fish and chicken compared to red meat such as beef. Therefore, if the E-Sniffer system is to be applied to other types of meat or under different storage conditions—such as vacuum-sealed or frozen environments—recalibration is necessary to ensure the accuracy of freshness detection.
This research presents several important implications, impacting both the industrial sector and consumers alike. E-Sniffer can be utilized within the food industry and meat distribution sector, including restaurants, supermarkets, and meat distributors, to assess the freshness of meat prior to sale. The implementation of this system has the potential to mitigate the risk of unfit food products entering the market, as well as decrease the likelihood of financial losses associated with product spoilage during distribution. Household consumers perceive E-Sniffer as a tool that enables independent assessment of meat quality, offering timely alerts when meat begins to spoil. This could enhance food safety in households and mitigate the risk of disease associated with the consumption of contaminated meat. E-Sniffer serves a significant role in food safety and regulation, functioning as a valuable tool in the enforcement of food safety standards. It is particularly effective in standardizing the freshness of meat within the market and throughout the food distribution chain. This system can serve as an additional detection method for food health authorities, enabling them to inspect the quality of meat products using more objective data.
This system presents numerous advantages; however, it is essential to acknowledge certain limitations that warrant consideration. Extreme humidity as an environmental factor can influence sensor readings, particularly in the measurement of NH₃ and H₂S. Moreover, sensor calibration plays a vital role in achieving enhanced accuracy in results, particularly when operating under diverse conditions. Consequently, additional investigation should concentrate on the formulation of environmental compensation algorithms, alongside the incorporation of machine learning technology to enhance the precision of meat spoilage forecasting.
Considering the identified limitations, various future research avenues can be pursued to enhance the system's effectiveness. The E-Sniffer system is currently designed as a prototype with testing limited to three types of meat: beef, chicken, and fish. For application at an industrial scale-such as in national meat distribution centers-the system would require sensor replication and more advanced cloud integration to support mass monitoring and multi-location trackting. The device developed in this study remains at the prototype stage and is not yet fully ready for large-scale deployment in the food industry. This is due to hardware limitations and a system design that is not yet practical for high monility, thus restricting its use to laboratory settings or controlled small-scale scenarios. The development of a machine learning model involves integrating machine learning (ML) with fuzzy logic, which enhances classification capabilities and achieves higher accuracy. Machine learning can be employed to assess the shelf life of meat by analyzing the decay patterns identified by the sensor. Although the E-Sniffer system is more cost-effective than conventional laboratory testing, it still requires an initial investment for components such as gas sensors (SGP40, MQ-137), the ESP32 microcontroller, the Nextion Touch Display, and mobile application development. Costs also include the need for periodic replacement or calibration of sensors, as their sensitivity may degrade over time or after prolonged exposure to high gas concentrations. Testing can be expanded to encompass a wider range of conditions, including various storage environments such as freezers, open settings, or vacuum storage. Additional examination is required to understand the impact of humidity and extreme temperatures on sensor readings. Sensor like MQ-137 and SGP40 are sensitive to extreme humidity and temperature conditions, which can affect reading accuracy. Therefore, the development of environmental compensation algorithms is essential o maintain detection reliability under various storage conditions.
The findings of this study suggest that E-Sniffer presents an innovative and effective approach for the automatic and real-time detection of meat freshness. The system presents a viable opportunity for implementation within the food industry, restaurants, and among household consumers, aimed at enhancing food safety and mitigating the risk of unsafe meat consumption. Further development of E-Sniffer could facilitate its integration with cloud-based IoT technology, allowing for remote monitoring and thereby enhancing its advantages within the food industry supply chain.
This study proposed E-Sniffer, a device leveraging IoT and fuzzy logic to assess meat freshness, achieving an accuracy rate of 80% and an average response time of 10 seconds. This system combines SGP40 and MQ-137 sensors to quantify the levels of TVOC, NH₃, H₂S, and TMA, which serve as primary indicators of meat spoilage processes. Experiments were performed on beef, chicken, and fish across different storage conditions, revealing that both temperature and storage duration had a substantial impact on the rise in spoilage gas levels.
The findings indicate that integrating gas sensors with Mamdani fuzzy logic facilitates the categorization of meat freshness into three primary classifications: Fresh, Slightly Spoiled, and Not Fresh. The integration of Nextion Touch Display with Flutter-based applications facilitates real-time monitoring, thereby enhancing the ability to assess meat quality effectively. This system provides a quicker, more impartial, and more precise option compared to traditional techniques like visual inspection or manual olfactory assessment.
This system presents notable advantages in terms of accuracy and detection speed; however, it is not without its limitations. Environmental factors can impact sensor performance, there are constraints regarding the types of meat that can be tested, and certain conditions necessitate re-calibration of the sensor. Consequently, it is advisable for future research to focus on creating a machine learning-based model aimed at enhancing classification accuracy, examining a broader range of meat types and storage conditions, and incorporating the system with cloud-based IoT for remote monitoring capabilities. E-Sniffer demonstrates significant potential for enhancing food safety and can be effectively utilized within the food industry, restaurants, and households as an automated, real-time, and efficient tool for detecting meat freshness. With additional development, this system has the potential to serve as a groundbreaking solution for mitigating the risk associated with the consumption of unfit meat and enhancing the standardization of food safety in the future.
We would like to thank Telkom University's Directorate of Research and Community Service for funding the publication, as well as the Centre of Excellence Smart Technology and Applied Science STAS RG Faculty of Applied Sciences Telkom University for providing laboratory facilities to support this research.
|
µfresh(x) |
fresh membership status |
|
µslightlyspoiled(x) |
slightly spoiled membership status |
| µnotfresh(x) | not fresh membership status |
|
min(a,b,c,d) |
fuzzy minimum inference operator |
|
max(a,b,c,d) |
fuzzy maximum inference operator |
|
z |
crisp variable defuzzification result |
|
$\int z . \mu(z) d z$ |
Integral product of variables and membership functions |
|
Abbreviation |
|
|
ESP32 |
Microcontroller Board with Wi-Fi or Bluetooth |
|
TVOC |
Total Volatile Organic Compound |
|
NH3 |
Ammonia |
|
H2S |
Hidrogen Sulfida |
|
TMA |
Trimethylamine |
[1] Arcentales, G.A.T., Lucas, M.A.P., Guerrero, J.A.C., Gordín, R.G. (2017). Evaluation for the reduction of NH3 contamination risks. International Journal of Life Sciences (IJLS), 1(2): 10. https://doi.org/10.21744/ijls.v1i2.29
[2] Purwono, P., Hadiyanto, H., Budihardjo, M.A. (2023). Equilibrium of ammonia (NH3) and ammonium (NH4+) during microalgae harvesting using electrocoagulation. International Journal of Engineering, Transactions A: Basics, 36(3): 565-572. https://doi.org/10.5829/ije.2023.36.03c.17
[3] Waworundeng, J. (2023). Design prototype detector of temperature, humidity, and air quality using sensors, microcontrollers, solar cells, and IoT. Cogito Smart Journal, 9(2): 411-421. https://doi.org/10.31154/cogito.v9i2.542.411-421
[4] Wei, F.X., Hu, X.F., Sa, R.N., Liu, F.Z., Li, S.Y., Sun, Q.Y. (2014). Antioxidant capacity and meat quality of broilers exposed to different ambient humidity and ammonia concentrations. Genetics and Molecular Research, 13(2): 3117-3127.
[5] Van Haarlem, R.P., Desjardins, R.L., Gao, Z., Flesch, T.K., Li, X. (2008). Methane and ammonia emissions from a beef feedlot in western Canada for a twelve-day period in the fall. Canadian Journal of Animal Science, 88(4): 641-649.
[6] Matindoust, S., Farzi, A., Baghaei Nejad, M., Shahrokh Abadi, M.H., Zou, Z., Zheng, L.R. (2017). Ammonia gas sensor based on flexible polyaniline films for rapid detection of spoilage in protein-rich foods. Journal of Materials Science: Materials in Electronics, 28(11): 7760-7768. https://doi.org/10.1007/s10854-017-6471-z
[7] Rudrahari, S., Vigneswaran, R.R., Revathi, K. (2023). Machine learning algorithm based meat spoilage detection: To avoid foodborne infection. International Research Journal on Advanced Science Hub, 5(5): 314-320. https://doi.org/10.47392/irjash.2023.s042
[8] Damdam, A.N., Ozay, L.O., Ozcan, C.K., Alzahrani, A., Helabi, R., Salama, K.N. (2023). IoT-enabled electronic nose system for beef quality monitoring and spoilage detection. Foods, 12(11): 2227. https://doi.org/10.3390/foods12112227
[9] Nugraha, I.G.D., Wijaya, G.T., Ramli, K. (2022). Improving meat expiration time prediction using the Internet of Things and polynomial regression. ASEAN Engineering Journal, 12(1): 197-205. https://doi.org/10.11113/AEJ.V12.17340
[10] Preethichandra, D.M.G., Gholami, M.D., Izake, E.L., O'Mullane, A.P., Sonar, P. (2023). Conducting polymer based ammonia and hydrogen sulfide chemical sensors and their suitability for detecting food spoilage. Advanced Materials Technologies, 8(4): 2200841. https://doi.org/10.1002/admt.202200841
[11] Monteiro, M.L.G., Mársico, E.T., Junior, C.A.C. (2017). Procedimentos ômicos aplicados em qualidade e segurança de pescado. Brazilian Journal of Veterinary Research and Animal Science, 54(1), 1-17.
[12] Erna, K.H., Rovina, K., Mantihal, S. (2021). Current detection techniques for monitoring the freshness of meat-based products: A review. Journal of Packaging Technology and Research, 5(3): 127-141. https://doi.org/10.1007/s41783-021-00120-5
[13] Phan, N.T., Kim, K.H., Jeon, E.C., Kim, U.H., Sohn, J.R., Pandey, S.K. (2012). Analysis of volatile organic compounds released during food decaying processes. Environmental Monitoring and Assessment, 184(3): 1683-1692. https://doi.org/10.1007/s10661-011-2070-2
[14] Cho, J.H., Lee, H. (2020). Optimization of machine learning in various situations using ICT-based TVOC sensors. Micromachines (Basel), 11(12): 1092. https://doi.org/10.3390/mi11121092
[15] Slamet, M.I.P., Hindarto, H., Sumarno, S. (2023). Determining tilapia quality using the fuzzy logic. Journal of Computer Networks, Architecture and High-Performance Computing, 5(1): 67-74. https://doi.org/10.47709/cnahpc.v5i1.2016
[16] Sujono, H.A., Faris, A.S. (2024). Design of a beef freshness detector based on color and scent with the Mamdani fuzzy method. Przeglad Elektrotechniczny, 2024(2): 92-96. https://doi.org/10.15199/48.2024.02.18
[17] Syed Ahmad, S.S., Yung, S.M., Kausar, N., Karaca, Y., Pamucar, D., Al Din Ide, N. (2022). Nonlinear integrated fuzzy modeling to predict dynamic occupant environment comfort for optimized sustainability. Scientific Programming, 2022(1): 4208945. https://doi.org/10.1155/2022/4208945
[18] Anthonysamy, S.I. (2018). Fish freshness detector based on image processing and quality index method using fuzzy logic system. Bachelor thesis, Universiti Teknologi Mara.
[19] Andaya, A.E., Arboleda, E.R., Andilab, A.A., Dellosa, R.M. (2019). Meat marbling scoring using image processing with fuzzy logic based classifier. International Journal of Scientific & Technology Research, 8(8): 1442-1445.
[20] Allana, A., Chua, A. (2021). Fuzzy logic program for bus indoor environmental assessment. ASEAN Engineering Journal, 11(4): 129-142.
[21] Çelik, Ş. (2021). Detection of red meat consumption with fuzzy logic method. Journal of Multidisciplinary Engineering Science Studies (JMESS), 7(2): 3685-3690.
[22] Binson, V.A., Thomas, S. (2023). The development of a mobile e-nose system for real-time beef quality monitoring and spoilage detection. Engineering Proceedings, 56(1): 256. https://doi.org/10.3390/ASEC2023-15960
[23] Wijaya, D.R., Sarno, R., Zulaika, E., Sabila, S.I. (2017). Development of mobile electronic nose for beef quality monitoring. Procedia Computer Science, 124: 728-735. https://doi.org/10.1016/j.procs.2017.12.211
[24] Felias, D.J.B., Mondea, D.P., Dellosa, J.T., Mendoza, R.N. (2024). Design and development of an Internet of Things (IoT)-based air quality monitoring system for Libjo Mining Corporation. In International Exchange and Innovation Conference on Engineering and Sciences, Kyushu University, Japan, pp. 365-370. https://doi.org/10.5109/7323287
[25] Caglayan, N., Celık, H.K., Rennıe, A. (2017). Fuzzy logic based ventilation for controlling harmful gases in livestock houses. Tarım Makinaları Bilimi Dergisi, 13(2): 107-112.
[26] Erfianto, B., Rahmatsyah, A. (2022). Application of ARIMA Kalman filter with multi-sensor data fusion fuzzy logic to improve indoor air quality index estimation. JOIV: International Journal on Informatics Visualization, 6(4): 771-777.
[27] Sirni, D.Y.K., Nofriadi, N., Sahren, S. (2024). Implementation of air quality detection system for healthy environmental monitoring. Jurnal Rekayasa dan Teknologi Sistem Informasi, 11(1): 2407-1811. https://doi.org/10.33330/jurteksi.v11i1.3360
[28] Putri, A.A., Fuada, S., Setyowati, E. (2023). Sistem Pendeteksi Gas Amonia Menggunakan MQ-137 Pada Air Berbasis Internet of Things Dengan Aplikasi Blynk di Android. Techné: Jurnal Ilmiah Elektroteknika, 22(2), 285-304.
[29] Kok, C. L., Chew, B.K., Chan, Y.C., Ong, M.K., Toh, P.L., Teoh, S.K., Goh, H.G. (2025). Quality and shelf-life extension of vegetables using precision control storage system. International Symposium on Green and Sustainable Technology, 603: 01026. https://doi.org/10.1051/e3sconf/202560301026
[30] Anwar, H., Anwar, T. (2025). Quality assessment of chicken using machine learning and electronic nose. Sensors and Biosensing Research, 47: 100739. https://doi.org/10.1016/j.sbsr.2025.100739
[31] Chen, C.C., Chien, C.W. (2023). Integrating logistic regression and XGBoost to construct indoor air quality improvement research. E3S Web of Conferences, 396: 01021. https://doi.org/10.1051/e3sconf/202339601021
[32] Weng, K., Song, L., Bao, Q., Cao, Z., Zhang, Y., Zhang, Y., Chen, G., Xu, Q. (2022). Comparative characterization of key volatile compounds in slow- and fast-growing duck raw meat based on widely targeted metabolomics. Foods, 11(24): 3975. https://doi.org/10.3390/foods11243975
[33] Feyzioglu, A., Taspinar, Y.S. (2023). Beef quality classification with reduced e-nose data features according to beef cut types. Sensors, 23(4): 2222. https://doi.org/10.3390/s23042222