Yaolong Chen![]() | Abdul Rais Abdul Latiff*
| Abdul Rais Abdul Latiff*![]()
© 2025 The authors. This article is published by IIETA and is licensed under the CC BY 4.0 license (http://creativecommons.org/licenses/by/4.0/).
OPEN ACCESS
As the world's largest carbon emitter, China’s National Emissions Trading System (CN ETS) is a core policy instrument for achieving the "double carbon" objectives. This study employs the structural breaks test and GARCH models to thoroughly examine the influence of policy adjustments on the Carbon Emission Trading Price (CETP) within the CN ETS, as well as its fluctuation characteristics. The findings reveal that policy adjustments significantly impact China's national CETP, with all three structural breaks resulting from a combination of policies. Specifically, factors such as centralized trading before compliance deadline, delayed and uneven allocation of allowances, the introduction of an auction mechanism, enhancement of data quality and regulation, and sector expansion have been identified as key contributors to the CETP increases. Furthermore, the fluctuation of CETP exhibit characteristics such as clustering, leptokurtosis, explosiveness, long memory, and an " anti-leverage effect," where the market is more sensitive to positive news than to negative news. This behavior contrasts sharply with the European Union (EU) ETS, highlighting that CN ETS is still in its nascent stages. This system is characterized by a homogeneous structure dominated by regulated enterprises, with insufficient participation from financial institutions, indicating that the market mechanism has yet to be fully developed. Meanwhile, policy adjustments have a significant and long-lasting impact on market volatility, highlighting the policy-driven nature of CN ETS. By addressing the empirical gap between price volatility and policy effects in CN ETS. It provides a scientific basis for optimizing the market design and preventing abnormal price volatility. Additionally, it offers valuable insights for the construction of emerging carbon markets.
carbon emission trading price (CETP), policy impact, China, emissions trading system (ETS), fluctuation
1.1 Research background
The issue of climate change is becoming increasingly urgent, prompting governments worldwide to prioritize the mitigation of greenhouse gas emissions [1]. Among the various strategies employed, the Emissions Trading System (ETS) has emerged as a critical policy instrument in the fight against global warming, achieving notable success in many regions [2]. Since 2006, China has overtaken the EU ETS as the largest emitter of carbon dioxide globally [3, 4]. The implementation of a national ETS has become a crucial strategy for tackling the urgent issue of carbon emissions. This market is a vital tool for China to attain its low-carbon goals, and underscores the significance for carbon trading. In October 2011, the Chinese government approved the implementation of the Twelfth Five-Year Plan, which aims to establish a domestic ETS. Subsequently, in 2013, eight pilot ETSs programs were launched across various provinces and cities. By July 2021, a nationwide carbon trading market encompassing the entire country was officially launched for trading [5].
As of July 2024, the CN ETS encompasses 2,257 key emission entities, with annual emissions amounting to approximately 5.1 billion tons. This represents over 40% of China's total carbon dioxide emissions, positioning the country as a global leader in greenhouse gas emissions trading. However, despite this achievement, the CN ETS is still in its early stages, with the institutional framework, sectoral coverage, trading mechanisms, market functions, and data management systems all requiring further improvement. Accelerating and enhancing the development of the CN ETS is essential to fully leverage the critical role of market prices in resource allocation. This is crucial for meeting emission reduction commitments, achieving emission control targets, and minimizing the costs of emission reductions across various industries [6]. Consequently, a comprehensive analysis of the policy impacts and price fluctuation characteristics of the CN ETS can provide valuable insights for refining the trading system, optimizing the pricing mechanism, mitigating market risks, and encouraging greater corporate participation in carbon trading to achieve emission reduction goals.
Firstly, the Bai-Perron test for multiple structural breaks was utilized to identify the precise number and timing of structural breakpoints in the CETP within the CN ETS. Secondly, using the event study method, we comprehensively analyzed the impact of various policy types, such as centralized trading before the compliance deadline, improving data quality and regulation, and introducing the auction mechanism, on the price stability of CN ETS. Thirdly, to gain deeper insights into the characteristics of the CN ETS and the nature of price volatility, the GARCH family models were employed to analyze the fluctuation patterns of CETP. The contributions of this study are manifold. Primarily, the impact of policy and regulatory changes on CETP in CN ETS is examined in detail for the first time, demonstrating the nonlinear interaction between regulatory intervention and price dynamics. Secondly, it analyzes the volatility patterns of CN CETP to reveal the nonlinear dynamics of the policy-sensitive market. This analysis can help assess market risk and stability. This study provides regulatory reference for policy makers, helps market participants grasp the law of price volatility patterns, and provides important inspiration for the sustainable development of CN ETS and emerging carbon markets.
The structure of the remainder of this research is organized as follows: Section 2 provides an overview of the relevant literature; Section 3 outlines the research methodology employed; Section 4 details the data sources utilized and presents the empirical analysis results; and Section 5 concludes the paper by summarizing the key findings and offering corresponding policy suggestions.
2.1 Impact of policy adjustments on CETP
The existing literature has extensively explored the factors influencing CETP in earlier carbon markets. The most prominent studies focus on the volatility of CETP in relation to energy prices, macroeconomic variables, and environmental variables [7-12]. Several scholars have also examined the impact of CETP in other carbon markets and offset prices (mainly the Clean Development Mechanism (CDM)) on CETP [13-15]. The impact of policy adjustments in carbon markets on CETP has also attracted early attention from scholars. A broad array of policy aspects within carbon markets has been identified, and Christiansen et al. [16] were among the first to discuss the impacts of emission reduction targets and national allocation programs, offsets, and storage or borrowing on CETP through data comparison. Subsequent researchers have explored other policies [17]. Empirical research has investigated the effects of adjustments to factors such as carbon emission caps and allowances on CETP. A strict total cap on carbon emissions has been shown to lead to the CETP increase, thereby triggering additional emission reduction measures. This conclusion also applies to China's carbon pilot market, where the CETP is inversely proportional to the total cap. Similarly, a lower supply of carbon allowances relative to demand can lead to higher CETP. These researchers agree that free government-issued carbon allowances have a significant impact on CETP [18, 19].
Few studies have examined the impacts of emission reduction targets [20], coverage, auctioning, storage or borrowing [21], and other related policies on CETP. Among them, there is currently no uniform conclusion on the impact of the size of the sector scope covered by the ETS on CETP. Lin and Jia [22] assessed how sector coverage influences the CETP within China's pilot carbon markets. They found that an expansion in sector coverage leads to a reduction in CETP. They argued that sectors with lower mitigation costs emerge as suppliers in the carbon markets, whereas those with higher mitigation costs become buyers of allowances. When market supply surpasses demand, the demand side can acquire additional allowances, consequently resulting in a decrease in CETP.
Ji et al. [23] examined the factors influencing the CETP in China's pilot ETSs and found that expanding the scope of the ETS and adopting centralized trading mechanisms contributed to an increase in CETP. They also noted that an oversupply of carbon allowances and low auction prices significantly lowered CETP in China's pilot markets. Similarly, research by Wiese et al. [24] highlighted that reducing free allowance allocations and increasing the proportion of auctioned allowances were critical drivers of higher CETP in the EU ETS. Cantillon and Slechten [25] emphasized that the auction mechanism ensured allowances were allocated to those who valued them most, thereby enhancing market efficiency and facilitating price discovery. Additionally, Isah [26] observed that improving data quality and strengthening regulatory measures within the EU ETS had a notable positive impact on CETP. Some researchers have also analyzed that the EU introduced the Carbon Border Adjustment Mechanism (CBAM) in 2023, which aims to prevent carbon leakage through the imposition of carbon tariffs. This policy indirectly pushed up carbon prices within the EU by increasing the carbon cost of imported goods [27].
If the offset policy is also included in the policy changes, several studies have shown that the amount of offsets (mainly China Certified Emission Reductions (CCERs)) in China's pilot ETS in the same direction as CETP, i.e., A rise in the number of offset credits and a decline in their price will lead to a decrease in CETP [28, 29]. In general, it is complex to measure the impact of specific policy changes on CETP because quantitative data are difficult to obtain for some carbon policies. Moreover, due to the specificity and complexity of the ETS, the impact of individual policies on CETP of different carbon markets can vary greatly, and even opposite conclusions may emerge due to different econometric models. Therefore, the impact of individual policies on CETP in different markets needs further investigation, especially in emerging markets like CN ETS.
2.2 Fluctuation characteristics of CETP
The price fluctuation characteristics of the ETS, which serves as an environmental governance tool based on market mechanisms, have emerged as a pivotal domain of research. The fluctuation characteristics of CETP reflect not only the market dynamics, but also the complex interactions among policies, economics, and market behavior. Academic research on price volatility patterns in the carbon market has focused on market mechanisms, supply and demand dynamics, and the impact of external shocks on price formation, with some studies also focusing on the volatility characteristics of CETP, particularly in the EU ETS, the most mature in the world [30-33].
Lv and Shao [34] employed the GARCH model to examine the fluctuation characteristics of CETP in six pilot ETSs in China. They found that the development of pilot ETSs in different regions of China was imbalanced, with distinct fluctuation characteristics of CETP within each region. Furthermore, leverage effects were observed to be uneven across the country. Specifically, a weak asymmetric effect in the fluctuation of CETP was observed in Shenzhen, along with a weak leverage effect. In contrast, prominent asymmetric effects were identified in Shanghai and Guangdong. Zhang [35] also used the same methodology to empirically analyze CETP in seven pilot carbon markets. Zhang also found that the logarithmic returns of CETP in Shenzhen and Hubei are less volatile and less affected by other unpredictable factors. To a certain extent, these returns reflect market information and indicate a relatively mature development.
Cong and Lo [36] investigated the fluctuation characteristics of CETP in the Shenzhen pilot market. They found that returns were negatively correlated with the expected risk, as represented by the conditional variance. Zhou and Li [37] investigated the fluctuation characteristics of CETP in Hubei using a GARCH model. Their results revealed that the return series of CETP exhibited features reminiscent of financial time series, including fluctuation aggregation, sharp peaks, thick tails, and non-normal distribution. The study further revealed a positive leverage effect on the fluctuation of CETP in Hubei, indicating that external negative news has a more significant impact on the fluctuation of CETP in this region than positive news. Sheng et al. [38] used an ARMA-GARCH model to explore the fluctuation characteristics of CETP in seven pilot carbon markets. They argued that regional CETP in China are characterized by agglomeration, peaking, heavy tailing, memory, and inverse leverage.
In addition, Wei and Chen [39] investigated the CETP characteristics of China's pilot ETS through a threshold model and a mechanism switching model, and found that the CETP showed a nonlinear structure with three operating ranges: high, medium, and low, with a stabilizing mechanism that could return the price to a normal state, and with medium rise as the main form of fluctuation. The study reveals the three stages of development of China's pilot ETS and the differences among the pilots.
Most of extant studies have employed GARCH and its evolving correlation models to characterize the CETP fluctuation of China's pilot carbon markets. Moreover, extant studies on China's CETP have primarily focused on several pilot carbon markets. Given the recent opening of CN ETS and its status as the world's largest trading entity, it is imperative to employ relevant models to study its price fluctuation characteristics, which may differ significantly from those observed in the pilot carbon markets.
In summary, extant research has primarily focused on the causes of CETP volatility from the perspectives of energy prices, macroeconomics, and environmental variables. There is a paucity of in-depth exploration of policy and regulatory factors. Indeed, policy and regulatory shifts, including the extension of covered sectors, the implementation of auction mechanisms, and the reduction in allowance allocation, have been shown to exert a profound influence on the price volatility of ETS. This underscores the pressing need for further research in this area. Existing studies have predominantly centered on mature ETSs in Europe, and China's pilot ETSs. Moreover, the existing research mainly focuses on the mature carbon markets in Europe and the United States and the pilot carbon markets in China. As the most extensive ETS in the world, CN ETS was established relatively late. Consequently, there is little research in the academic community on the influencing factors and fluctuation characteristics of its CETP.
3.1 Structural breaks test model
Various structural breaks tests are available to identify changes in an econometric series. The Bai and Perron test can effectively identify multiple structural changes, which is essential for understanding how policies or events impact time series data. The model is primarily used to identify diverse breakpoints in a linear model, i.e., a significant change in the statistical properties of the time series at one or more points in time [40, 41].
The structural breaks test model assumes that the time series could be divided into multiple sub-intervals, with the data within each sub-interval following a different linear model. The Bai and Perron test methodology identifies the optimal number and location of breakpoints by comparing the model fit under different breaks assumptions. The CETP of CN ETS is known as the Chinese Emission Allowance (CEA). Drawing on structural breaks test conducted by previous researchers in other markets [8, 42], an equation is formulated to examine structural changes in the CEA.
$\begin{gathered}C E A_t=a_j+u_t \\ \left(t=T_j, T_{j+1}, \ldots, T_{j+1}-1 ; j=0,1, \ldots m\right)\end{gathered}$ (1)
We consider a time series containing m potential mean breakpoints, and this sequence results in m+1 different time states. For each observation $\left(T_j, T_{j+1}, \ldots, T_{j+1}-1\right), C E A_t$ represents CETP in CN ETS, where is the expected CETP under regime j, and is the error in period t; $a_j$ denotes the mean of the price series, while the error term $u_t$ denotes the heteroskedasticity or correlation series. By reducing the residual sum of squares of the model equations and applying a specified information criterion that accounts for the number of breakpoints, we computed and evaluated the associated statistics $supF_T^*(k ; q)$, Dmax statistic (UDmax and WDmax), and ${Sup}_T(i+1 \mid i)$ to achieve efficient localization of the breakpoints. Finally, combining the event study methodology, we analyze how changes in policies and regulations affect CETP, and summarize the specific impacts of these policies on CEA fluctuations. This study not only deepens our comprehension of the dynamics within the carbon market, but also offers valuable reference information for policymakers [43].
3.2 GARCH family models
To study the fluctuation characteristics of the CETP in CN ETS, this study employs the GARCH family models, including GARCH, TGARCH, and EGARCH. These approaches are constructed to characterized and forecast conditional variance. They have significant advantages in capturing the fluctuation characteristics of financial time series data. When using these models, the analysis typically utilizes the returns on financial prices, which are calculated as the first-order logarithmic differences of closing prices between consecutive trading days. This study uses the return on CEA (r) for analysis. First, the return (r) is defined as follows:
$r_t=\ln \left(\frac{C E A_t}{C E A_{t-1}}\right)$ (2)
where, $C E A_t$ represents the CETP at time t. In all GARCH family models, the basic yield model and error term model are as follows:
$r_t=\mu+\epsilon_t$ (3)
$\epsilon_t=\sigma_t z_t$ (4)
In this context, $r_t$ signifies the return of the CETP at time t. The parameter μ represents the mean of these returns, $\epsilon_t$ denotes the error term or residual, $\sigma_t$ is the conditional standard deviation, and $z_t$ follows a standard normal distribution, characterized by independence. Then, this study will construct the conditional variance equations for the three models and analyze the fit comparison, and finally adopt the model with the best fit.
3.2.1 GARCH
The Generalized Autoregressive Conditional Heteroskedasticity (GARCH) model represents an enhancement of the ARCH model, designed to more effectively capture the persistent volatility features, or long memory characteristics, inherent in financial time series data [44-46]. The conditional variance equation for the GARCH (p, q) model is as follows:
$\sigma_t^2=\alpha_0+\sum_{i=1}^p \alpha_i \epsilon_{t-i}^2+\sum_{j=1}^q \beta_j \sigma_{t-j}^2$ (5)
In this formulation, $\sigma_{t}^2$ represents the conditional variance. The term $\alpha_0$ denotes the constant component, while $\alpha_i$ and $\beta_j$ are the coefficients corresponding to the ARCH and GARCH terms, respectively. The variables p and q signify the orders of the error lag and the conditional variance lag, respectively. The parameters $\alpha_0, \alpha_i, \beta_j$ are subject to estimation.
3.2.2 TGARCH
The “Threshold GARCH” (TGARCH) model is frequently employed to capture the leverage effect in financial markets. This is achieved through the incorporation of a threshold mechanism that differentiates between the disparate impacts of positive and negative news on volatility. For the TGARCH(1,1), the conditional volatility is formulated as:
$\sigma_t^2=\alpha_0+\alpha_1 \epsilon_{t-1}^2+\gamma_1 \epsilon_{t-1}^2 I\left(\epsilon_{t-1}<0\right)+\beta_1 \sigma_{t-1}^2$ (6)
where, $\alpha_0, \alpha_1, \gamma_1, \beta_1$ are the parameters to be estimated. $\alpha_1$ is the coefficient of the lagged error squared term; $\gamma_1$ is the coefficient of the additional error squared term, which denotes the additional effect of the negative errors on the volatility; $\beta_1$ is the coefficient of the lagged conditional variance term. When I = 1, it signifies the influence of positive news, whereas I = 0 indicates the influence of negative news. The parameter $\gamma_1$ is utilized to capture the asymmetry in the effects of positive and negative news on the financial market's volatility. A notably non-zero coefficient for $\gamma_1$ suggests an asymmetric reaction of conditional variance to good and bad news. Specifically, a negative value for $\gamma_1$ implies that bad news has a more pronounced effect on volatility compared to good news, while a positive value for $\gamma_1$ indicates that positive news exerts a greater influence [37, 47].
3.2.3 EGARCH
The “Exponential GARCH” (EGARCH) model addresses the limitations of the GARCH model in detecting volatility asymmetries by modeling the logarithm of conditional variance [48-50]. Its equation is as follows:
$\ln \left(\sigma_t^2\right)=\omega+\beta \ln \left(\sigma_{t-1}^2\right)+\alpha z_{t-1}+\gamma\left[\left|z_{t-1}\right|-E|z|\right]$ (7)
where, ω, α, β and γ are the parameters to be estimated; ω is a constant term indicating the average of the long-run volatility level; β is the autoregressive coefficient of conditional variance reflecting the persistence of volatility; α captures the asymmetric effect (the different impacts of positive and negative shocks). When α < 0, $\ln(\sigma_t^2)$ rises (falls) in response to the price decline (rise) of the negative market shock z. $\gamma$ captures the symmetric volatility effect (the effect of the absolute value of the shock), $\gamma\left[\left|z_{t-1}\right|-E|z|\right]$ measures the magnitude effect of the innovation. If $\gamma$> 0, then $\gamma\left[\left|z_{t-1}\right|-E|z|\right]$ raises (lowers) $\ln(\sigma_t^2)$ when the extent of the market shock exceeds (is below) expectations [51].
3.3 Data description
This study analyzes the CETP using data on China Emission Allowance (CEA) from CN ETS, which launched on July 16, 2021. The daily average price of CEA was collected from July 16, 2021, to July 31, 2024, sourced from China's Wind database. Given that the vast majority of missing values in the data occur during holiday periods, we choose to delete these missing values to ensure data authenticity.
4.1 Structural changes analysis of CETP
4.1.1 Structural breaks test
We applied the Bai-Perron test to determine breakpoints, initially conducting the $sup F_T^*(k ; q)$ test. This test identified five statistically significant structural breaks (Table 1). It was noted that the confidence intervals for the coefficients corresponding to the second and third breaks exhibited considerable width, indicating an unstable estimation, likely due to the subtle effect of the breakpoint or insufficient variation in the surrounding data. Following the approach of the experts [52], we excluded these two breaks and performed the Dmax statistic (UDmax and WDmax) and ${Sup}F_T(i+1 \mid i)$ test for the remaining three breaks.
Table 1. Structural breaks initially tested
|
# |
Index |
Date |
[95% Conf. Interval] |
|
|
1 |
112 |
12/29/2021 |
111 |
113 |
|
2 |
297 |
10/10/2022 |
252 |
342 |
|
3 |
407 |
3/21/2023 |
354 |
460 |
|
4 |
517 |
8/30/2023 |
516 |
518 |
|
5 |
628 |
2/20/2024 |
627 |
629 |
T = 738; SSR = 14578.30; Trimming = 0.15
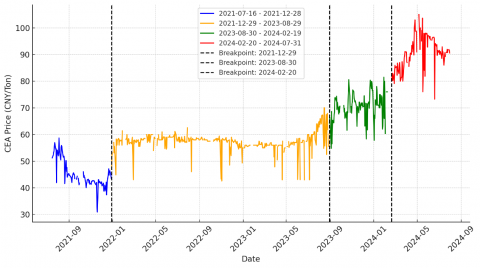
The results are displayed in Table 2. The t-statistics for all values are highly significant, indicating a strong statistical probability that the observed results are not merely due to chance. This finding suggests the presence of three distinct structural changes in the CEA sequence. The timing of these breaks is as follows: December 29, 2021; August 30, 2023; and February 20, 2024 (Table 1).
Table 2. Statistical test results for CEA structural breaks
|
Test |
Test Statistic |
1% Critical Value |
5% Critical Value |
10% Critical Value |
|
supW(tau) |
292335.91 |
7.6 |
5.96 |
5.21 |
|
UDmax(tau) |
292335.91 |
12.37 |
8.88 |
7.46 |
|
WDmax(tau) |
420845.99 |
13.83 |
9.91 |
8.2 |
|
F(s+1|s)* |
102.12 |
14.8 |
11.14 |
9.41 |
In the CEA time-series analysis plot, three key structural breaks have been clearly labeled. These breaks significantly and clearly divide the evolutionary trajectory of the CEA data into four distinct intervals. It is worth noting that after each of these breaks, the CEA trend exhibits significant variability, highlighting the complexity of the dynamics in the time series (Figure 1).
Figure 1. CEA time series with structural breaks
4.1.2 Policy analysis of structural breaks
Based on the dates of the breakpoints, we searched for the corresponding major impact policy events (Table 3), which were primarily sourced from the National Carbon Market Information Network, the Carbon Emissions Trading Network, and the Carbon Trading Network.
Table 3. Relevant policy events associated with CEA structural breakpoints
|
Structural Breaks Date |
Important Policy |
Date |
|
2022/12/29 |
The Ministry of Ecology and Environment (MEE) issued the "Notice on the Completion of Carbon Emission Allowance Compliance for the First Compliance Period of the National ETS." |
2021/10/23 |
|
The allocation of 2021 allowance s varied among provinces, with Hainan, Shanghai, and Jiangxi starting as early as November 24, while some provinces did not issue allowances until December, leaving less than a month before the compliance deadline. |
2021/11/1 |
|
|
The MEE released the draft for public consultation on the "Greenhouse Gas Emission Accounting Methods and Reporting Guidelines for Power Generation Facilities (2021 Revised Edition)." |
2021/12/2 |
|
|
Zhang, Director of the Energy and Environment Economics Research Institute at Tsinghua University, stated that future national carbon market allowance allocations will become stricter and include an auction mechanism. |
2021/12/2 |
|
|
2023/8/30 |
Liu, general manager of the Shanghai Environmental Energy Market, announced at the 2023 Zero Carbon Summit that during the “14th Five-Year Plan” period, high-emission sectors such as chemicals, construction and civil aviation will be included in the national ETS with an expected allowance issuance of 6.5-7.0 billion tons, covering more than 8,000 enterprises, and expanding trading volume and steadily rising prices. |
2023/8/9 |
|
Eight departments, including the MEE issued a notice on the building materials sector stabilized growth program, aiming to promote the implementation of the enterprise green energy reduction policy and to study and promote the inclusion of the cement sector in the CN ETS. |
2023/8/25 |
|
|
The MEE said it has recently launched the issuance of allowance s and compliance work in the CN ETS for the years 2021 and 2022. The sector is also planning to expand sector coverage to promote green and low-carbon technological innovation. |
2023/8/28 |
|
|
2024/2/20 |
The State Council has signed and issued the "Interim Regulations on the Management of Carbon Emission Trading." |
2024/2/4 |
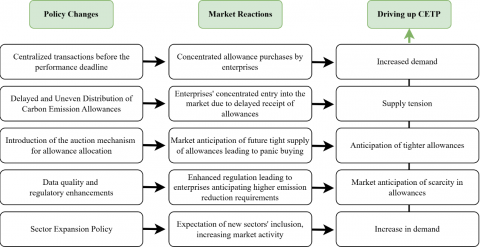
Figure 2. Market reactions triggered by carbon market policy changes
Policy adjustments alter the expectations of market participants regarding the future scarcity of allowances and the intensity of regulation, directly influencing their trading behavior. The impact of policies on CETP depends not only on their direct regulation (such as allowances allocation) but also on the intermediary role of market expectations. According to the Rational Expectations Theory [53], market participants will dynamically adjust their supply and demand expectations based on policy signals. When policy signals are clear (such as announcing sector expansion plan in advance), the market can quickly form an equilibrium price; conversely, policy ambiguity (such as delayed allowance issuance) triggers adaptive expectations [54], leading to short-term price over-adjustment. Furthermore, the "information cascade theory" in behavioral finance [55] can explain the phenomenon of centralized transactions before the compliance deadline. Enterprises mimic others' behavior due to information asymmetry, which intensifies price fluctuations. As an emerging market, the lack of policy transparency and market education in China's ETS further amplifies the volatility driven by expectations. Figure 2 summarizes how policy changes affect CETP by altering market expectations and triggering market reactions. Specifically, the reasons for the three structural breakpoints are as follows:
(1) The causes of the first structural breakpoint
i. Compliance mechanism: centralized trading before the compliance deadline
The notice on carbon allowance clearing issued on October 23, 2021, clarified that December 31, 2021, is the deadline for the first compliance cycle of CN ETS. This marks the first compliance period since the market's inception, covering carbon allowance clearing for the years 2019-2020. Covered companies were ill-prepared and urgently needed to purchase carbon allowances ahead of the compliance period in order to meet compliance requirements, leading to a surge in demand and a significant rise in CETP. This phenomenon has been observed in several pilot carbon markets.
ii. Delayed and uneven distribution of allowances
The tension between supply and demand is attributable to the uneven issuance of allowances. The inconsistent issuance of allowances across provinces has resulted in some regions issuing allowances less than a month before the compliance deadline. Enterprises in these provinces have had to purchase allowances in the market due to the delayed issuance, exacerbating the imbalance between supply and demand and driving up CETP, which ultimately reached a high point at the end of December.
iii. Data quality and regulatory enhancements
On December 2, 2021, the Ministry of Ecology and Environment (MEE) released the draft "Guidelines for the Accounting and Reporting of Greenhouse Gas Emissions from Power Generation Facilities (Revised Edition 2021)" for public comments. This policy adjustment directly impacted corporate compliance behavior and market expectations. The draft has led market participants to expect stricter regulation in the future, particularly with the introduction of more accurate accounting methods. Companies may face higher requirements for emission reductions, further highlighting the scarcity of carbon allowances and driving up CETP.
iv. Anticipation of the introduction of an auction mechanism
Panic buying, triggered by uncertainty about future policies and rumors of possible future allowance auctions, has increased market tension. The introduction of an auction mechanism will improve market efficiency and simultaneously signal allowance tightening to avoid the problem of excess allowances due to free allocation. The market expects a tighter supply of carbon allowances in the future, leading companies to significantly increase their purchases in a short period of time, thereby pushing up CETP.
Overall, from the end of 2021 to the beginning of 2022, several policy events gradually strengthened the market's expectation of a tight carbon allowance supply. These included concentrated trading before the compliance deadline, uneven and tightening changes in the allocation of allowances, and stricter greenhouse gas accounting and reporting methods. These factors led to structural changes in the national CETP. This abrupt change reflected the high sensitivity of market participants to future policy changes in the newly launched national carbon market, which had been operating for less than half a year. The uncertainty of policies led to panic reactions in the market, causing a significant surge in CETP during this period.
(2) The causes of the second structural breakpoint
The sudden structural change in the CETP of CN ETS on August 30, 2023, can be primarily attributed to the anticipated escalation in demand, consequent to the augmentation of sector coverage. On August 9, 2023, the Shanghai Environmental Energy market formally announced its plans to integrate high-emission sectors, including chemicals, construction, and civil aviation, into the national ETS during the "14th Five-Year Plan" period. Subsequently, on August 25, several ministries and commissions formally notified the inclusion of the cement sector in the CN ETS. Finally, on August 28, the MEE reiterated its plan to expand the coverage of the sector clear. These three events signify a further expansion of sector coverage, with allowance issuance expected to reach 6.5-7 billion tons, encompassing over 8,000 enterprises (excluding the cement sector). The inclusion of additional sectors is projected to substantially augment market demand for carbon allowances, thereby enhancing market activity and liquidity, and consequently driving up CETP.
(3) The causes of the third structural breakpoint
On February 4, 2024, the Interim Regulation on the Administration of Carbon Emissions Trading was released, marking a more standardized and institutionalized management of the ETS. The regulations include the following: clarifying that the sector coverage of the ETS will be gradually expanded to encompass high-emission sectors, including the iron and steel sector, petrochemicals, building materials, and chemicals; stipulating that the allocation of allowances will be gradually implemented by combining free allocation and auction allocation, with the proportion of paid allocation gradually increasing; establishing a trading method based on the transfer of agreements and one-way bidding, and clarifying that the main parties of the transaction include key emission units and other subjects; balancing supply and demand through the market adjustment mechanism to prevent CETP from getting out of control; imposing strict requirements on data quality and a mechanism to penalize illegal acts. In the short term, these factors are expected to lead to an increase in the CETP due to anticipated changes in supply and demand. In the long run, the improvement of market mechanisms will enable the CETP to more accurately reflect the costs of emission reduction, thereby promoting the sustainable development of the ETS.
Moreover, the elimination of policy uncertainty fosters a pronounced adjustment in the behavior of market participants. Prior to the release of the regulation, the market may have had some uncertainty and speculation regarding the specific details of the policy. Once the regulation was released, policy uncertainty was eliminated, clarifying the market participants' expectations of stricter future carbon market regulation. Firms may then reassess the value of their carbon assets. Some firms might preemptively adjust their market positions to cope with potential future compliance pressures. The concentrated outbreak of such behavior can easily lead to significant price fluctuations, resulting in structural changes in CETP. This abrupt change is both a rapid market response to new policies and a result of the market's self-adjustment mechanism during the policy implementation process.
4.2 The fluctuation characteristics of CETP
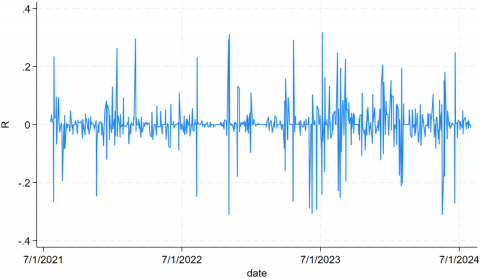
Since the return can better reflect the volatility of CEA, we analyze the return series of CEA. The return series for CEA, when plotted, suggests the presence of a certain degree of volatility aggregation (Figure 3).
Figure 3. CEA return volatility series
We subsequently analyzed the distributional properties of the CETP return series to determine if the CEA return series satisfies the prerequisites for fitting the GARCH model. As illustrated in Table 4, the mean of the return series is -0.0000765, a small positive value approximating zero. This finding suggests that the overall price of CEA has exhibited a slight upward trend over the period analyzed. For the daily returns, the standard deviation is substantial, and the variance is significant, indicating the presence of volatility clustering in the return series. The skewness of the return series is -0.1247416, indicating a slight left-skewness. The kurtosis of 9.758751 is significantly greater than 3, consistent with the distribution characteristics of "sharp peaks and thick tails." This suggests that the frequency of extreme values (i.e., significant rises or falls) in the CEA return series is much higher than that predicted by the normal distribution, indicating that the CETP of CN ETS is prone to sudden and substantial fluctuations. The p-value of the JB test, at 5.e-290 near zero, shows the return series is not normally distributed. In conclusion, the CEA return series exhibits the hallmark features commonly observed in financial time series, namely volatility, clustering, and explosiveness. The series is suitable for constructing a GARCH model for further analysis and forecasting.
Table 4. Distribution attributes of the CEA return series
|
Statistical Indicators |
Statistics |
|
Obs |
699 |
|
Mean |
-0.0000765 |
|
Std. dev. |
0.0755073 |
|
Variance |
0.0057014 |
|
Skewness |
-0.1247416 |
|
Kurtosis |
9.758751 |
|
JB test value |
1332 |
|
P-value |
5.e-290 |
The next step is to test for the ARCH effect in the regression series. We first examined the stationarity of the CEA return series. The results (Table 5) indicate that the unit root test statistic (-27.421) is significantly lower than the critical value (-3.43) at the 1% significance level, with a p-value of 0. Therefore, the null hypothesis of "existing unit root" can be rejected at the 1% level, indicating that the CEA return series is stable. Then, by comparing multiple information criteria under different lag orders, we determine the optimal lag order in the model is 4 (Table 6).
Table 5. Stability test results of the R series
|
Return Series |
Test Statistic |
1% Critical Value |
5% Critical Value |
10% Critical Value |
P |
|
R |
-27.421 |
-3.43 |
-2.86 |
-2.57 |
0 |
Table 6. Lag order selection criteria for R
|
Lag |
LL |
LR |
df |
p |
FPE |
AIC |
HQIC |
SBIC |
|
0 |
629.802 |
0.006297 |
-2.22979 |
-2.22679 |
-2.22211 |
|||
|
1 |
715.645 |
171.69 |
1 |
0 |
0.004661 |
-2.53066 |
-2.52466 |
-2.51528 |
|
2 |
736.614 |
41.938 |
1 |
0 |
0.004342 |
-2.60147 |
-2.59247 |
-2.57841 |
|
3 |
741.537 |
9.8459 |
1 |
0.002 |
0.004282 |
-2.61538 |
-2.60338 |
-2.58464 |
|
4 |
751.253 |
19.431* |
1 |
0 |
0.004152* |
-2.64629* |
-2.63128* |
-2.60786* |
We first fit the return series to a model with a fourth-order lag term and constant using ordinary least squares (OLS). Following this, we employed Engel's Lagrange Multiplier (LM) test to determine the existence of an ARCH effect. The ARCH-LM test results (Table 7), which reject the null hypothesis at the 5% significance level, offer evidence for the presence of an ARCH effect in the return series.
Table 7. ARCH-LM test results of the R series
|
lags(p) |
chi2 |
df |
Prob > chi2 |
|
1 |
9.034 |
1 |
0.0027 |
|
2 |
18.201 |
2 |
0.0001 |
|
3 |
19.961 |
3 |
0.0002 |
|
4 |
21.527 |
4 |
0.0002 |
Next, this study used a systematic approach to identify the optimal GARCH family model. First, after preliminary analysis of the return series, we examined the autocorrelation structure of the squared residual series. Using the VAR lag-order selection criteria, the optimal lag order for the squared residual series is determined to be 2, providing the basis for selecting the ARCH term order. Based on the analysis, we systematically estimated and compared various GARCH family models. We evaluate their log - likelihood, AIC, and BIC values. Log-likelihood reflects a model's explanatory power; a higher value means better fit. Lower AIC and BIC values indicate a better fit. The comparison results are shown in Table 8.
Table 8. Comparison of fitting results for different GARCH models
|
Model Specification |
Log-Likelihood |
AIC |
BIC |
Parameters |
|
GARCH (1,1) |
781.4998 |
-1547 |
-1512.319 |
8 |
|
GARCH (2,1) |
770.9966 |
-1525.993 |
-1491.313 |
8 |
|
GARCH (2,2) |
770.1543 |
-1524.309 |
-1489.628 |
8 |
|
TGARCH (1,1,1) |
784.263 |
-1550.526 |
-1511.511 |
9 |
|
TGARCH (2,1,1) |
771.0922 |
-1524.184 |
-1485.169 |
9 |
|
TGARCH (2,2,1) |
770.1545 |
-1522.309 |
-1483.294 |
9 |
|
EGARCH (1,1) |
- |
- |
- |
- |
|
TGARCH (2,2,2) |
- |
- |
- |
- |
The TGARCH(1,1,1) has the largest value of Log-likelihood and the smallest value of AIC, which is greater than 2 with the Suboptimal GARCH(1,1), although the BIC criterion weakly supports the GARCH(1,1), the γ parameter in the TGARCH model is significantly positive (p-value of 0.002), which suggests that there is a leverage effect, and at this point, even if BIC is slightly higher, the TGARCH(1,1,1) should still be chosen to capture the leverage effect properties of the data [56].
Next, we examined whether the residuals conformed to a normal distribution, and the Jarque-Bera test showed that the residuals did not obey a normal distribution and that the residual distribution had significant left skewness and sharp thick tails. In order to better capture the conditional heteroskedasticity properties of the return series, this study attempted the following different assumptions on the error distributions based on the TGARCH (1,1,1): including the Student's t-distribution (with degrees of freedom of 6, 5, 4, and 3, respectively) and the Generalized Error Distribution (GED, with shape parameter of 1.8, 1.5, 1.2, and 1.0, respectively), respectively.
Table 9. Model fitting results under different error distribution assumptions
|
Error Distribution |
Parameter |
Log Likelihood |
AIC |
BIC |
Convergence |
|
Student's t |
6 |
960.1281 |
-1902.26 |
-1863.24 |
Yes |
|
Student's t |
5 |
975.0483 |
-1932.1 |
-1893.08 |
Yes |
|
Student's t |
4 |
991.8959 |
-1965.79 |
-1926.78 |
Yes |
|
Student's t |
3 |
1010.652 |
-2003.31 |
-1964.29 |
Yes |
|
GED |
1.8 |
817.4561 |
-1616.91 |
-1577.9 |
Yes |
|
GED |
1.5 |
872.09 |
-1726.18 |
-1687.17 |
Yes |
|
GED |
1.2 |
929.3998 |
-1840.8 |
-1801.78 |
Yes |
|
GED |
1 |
Did not converge |
N/A |
N/A |
No |
As in Table 9, the model assuming that the error term obeys the Student's t-distribution (with 3 degrees of freedom) has the highest log-likelihood value (1010.652) and the lowest AIC and BIC values (-2003.305 and -1964.289, respectively). Therefore, this model is selected as the final best model that better captures the sharp peaks and thick tails characteristic of the return series and provides a solid foundation for further risk assessment and forecasting.
We conducted further ARCH effect and Ljung-Box tests on the residuals, and the results indicated that the ARCH effect has been eliminated (conditional heteroskedasticity), i.e., the variance of the residuals does not change over time; the white noise test showed that the residual series is white noise with no significant autocorrelation, suggesting that the model has fitted the data well. Finally, we specifically analyze d the simulation estimation results for the TGARCH (1,1,1) (Table 10).
Table 10. TGARCH(1,1,1) model estimation results (t = 3)
|
Variable |
Coefficient |
P>|z| |
|
Conditional Variance Equation |
||
|
Constant Term (ω) |
0.0002 |
0.000 |
|
ARCH Term (α) |
1.5254 |
0.000 |
|
Asymmetric Term (γ) |
-0.8457 |
0.023 |
|
GARCH Term (β) |
0.3363 |
0.000 |
|
Conditional Mean Equation |
||
|
Rt−1 |
-0.5265 |
0.000 |
|
Rt−2 |
-0.2241 |
0.000 |
|
Rt−3 |
-0.1411 |
0.000 |
|
Rt−4 |
-0.0946 |
0.000 |
|
_cons |
0.0003 |
0.754 |
From the above results we can get the mean equation and conditional variance equation of CEA return as follows:
$\sigma_t^2=0.0002+1.5254 \epsilon_{t-1}^2-0.8457 \epsilon_{t-1}^2 I_{t-1}+0.3363 \sigma_{t-1}^2$ (8)
$R_t=0.0003-0.5265 R_{t-1}-0.2241 R_{t-2}-0.1411 R_{t-3}-0.0946 R_{t-4}+\epsilon_t$ (9)
In the GARCH family of models, α+β is a crucial indicator of the persistence of volatility in return series. According to the latest TGARCH (1,1,1) model estimation results, the volatility persistence coefficient (α+β) for the return series is 1.8617 (1.5254+0.3363), which exceeds the constraint of 1. This suggests that the volatility of CEA returns in the CN ETS exhibits extremely high persistence. Such high persistence implies that the impact of market shocks on volatility will persist for a considerable period, with the market reacting strongly and retaining a strong memory to information.
From the perspective of market efficiency, the level of volatility persistence can reflect the speed of market absorption and reaction to information. This implies that CN ETS has not yet reached full weak-style effectiveness. This reflects the characteristics of the early stage of market development, and may also be related to factors such as frequent policy interventions, a single structure of market participants, insufficient liquidity and information asymmetry.
The coefficient of the asymmetric term γ is -0.8457, which is significant at the 5% significance level (p-value of 0.023). This negative γ coefficient indicates that there is a significant asymmetric effect, but contrary to the “leverage effect” in traditional financial markets, positive shocks have a greater impact on volatility than negative shocks in the CN ETS. Specifically, when there is a positive shock, the increase in volatility is α (1.5254); while when there is a negative shock, the increase in volatility is α+γ (1.5254-0.8457=0.6797), which is only about 44.6% of the positive shock. This “anti-leverage effect” phenomenon may reflect the specific nature of the carbon market, suggesting that market participants are more sensitive to information about CETP increases. This may be due to the structure of the carbon market, in which participants are mainly enterprises whose trading behavior is driven by policy rather than purely profit motives, making the market more sensitive to positive information. Positive shocks (e.g., sector expansion) are often associated with favorable policies, which increase market expectations of future CETP increases and trigger larger market reactions, with enterprises likely to purchase allowances in advance to avoid future costs, increasing volatility; whereas negative shocks are viewed as short-term adjustments, with enterprises reacting more moderately.
In addition, the results of the conditional mean equation indicate that there is a significant autocorrelation in the CEA return series, where the coefficients of $R_{t-1}$ to $R_{t-4}$ are -0.5265, -0.2241, -0.1411, and -0.0946. All these coefficients are statistically significant at the 0.1% level. These negative autocorrelation coefficients suggest that there is a significant mean reversion property of CEA returns, meaning that an increase (decrease) in returns in the current period is often followed by a decrease (increase) in returns in subsequent periods. The absolute values of the coefficients decline as the lag order increases, indicating that more recent returns have a greater impact on current returns. The constant term (0.0003) is statistically insignificant (p-value of 0.754), suggesting that in the absence of other information, the average level of returns is close to zero. This characteristic reflects the following features of CN ETS: The significant autocorrelation of CEA return indicates that the carbon market has not reached the weak-form efficiency, and investors can use historical information to predict the future returns and capture excess returns. This phenomenon reflects the inadequacy of the price discovery mechanism, which may be due to the limited market participants, the slow price adjustment caused by asymmetric information, and the policy-driven characteristics of the carbon market. The lag of policy implementation makes the change of return dependent on time, which further strengthens the autocorrelation performance.
5.1 Comparative analysis with the EU ETS
The EU ETS, launched in 2005, has gradually expanded to cover multiple high-emission sectors such as power generation, industry, and aviation, making it the most mature and representative carbon market globally. In contrast, CN ETS, at its initial stage, covers only the power sector, with a coverage of approximately 5.1 billion tons of CO2 emissions, accounting for over 40% of China's total emissions. This positions it as the largest carbon market globally.
5.1.1 Comparison of market design and operational mechanisms
As the two most prominent ETSs worldwide, the EU ETS and CN ETS share commonalities in their market design, operational mechanisms, and policy goals, while also displaying notable distinctions. Their similarities are primarily rooted in the adoption of a cap-and-trade framework, which imposes a cap on carbon emissions and allocates emission allowances to encourage enterprises to meet emission reduction targets through market-driven mechanisms. Furthermore, both markets have progressively expanded their sectoral coverage and placed significant emphasis on improving data quality and regulatory oversight. It is worth noting that the EU ETS experienced a similar pilot phase during its early stages, gradually incorporating more sectors and emission sources, mirroring the developmental trajectory of China's ETS as it transitioned from pilot programs to a nationwide market.
There are three main differences. First, the allocation of allowances. The EU ETS has gradually introduced the auction mechanism since the third phase (2013), while CN ETS is still dominated by free allocation. Second, the price mechanism. The EU ETS regulates CETP volatility by the establishment of the Market Stabilization Reserve (MSR), and has already established a future market, but the CN ETS has not yet established a similar price stabilization mechanism. Third, the data quality and compliance. While the EU ETS has strict data quality and compliance requirements with strong penalties for violations, the CN ETS still needs to be further improved in terms of data quality management and corporate compliance.
5.1.2 Comparison of the impact of policy changes on CETP
During its early development, the EU ETS underwent several major policy adjustments that significantly influenced CETP. This is comparable to the policy sensitivity observed in CN ETS, as highlighted in this study.
i. Concentrated trading before compliance deadlines
The 2024 Carbon Market Report emphasized that the surge in market demand prior to compliance deadlines often leads to an increase in CETP. By analyzing trading data from 2022 and 2023, the report found that the CETP increases observed in the first quarter of each year were directly linked to concentrated trading activity driven by compliance requirements [57]. This pattern closely aligns with the CETP growth observed in the CN ETS ahead of the deadline for its first compliance cycle, suggesting that this is a common characteristic of carbon markets rather than a phenomenon unique to the CN ETS.
ii. Delayed and Uneven Allowance Allocation
The European Parliament noted that uneven allocation of allowances could lead to market distortions, particularly when certain sectors receive more free allowances. Such policies may reduce market liquidity, thereby driving up CETP [58]. This is similar to the phenomenon observed in this study, where inconsistencies in allowance issuance timing across provinces in China led to supply-demand imbalances and CETP increases. However, due to the more mature market mechanisms and higher liquidity of the EU ETS, the impact of such issues is relatively smaller.
iii. The relationship between the auction mechanism and CETP
As highlighted in the literature review, some studies suggest that increasing the number of auctioned allowances is a key driver of rising CETP in the EU ETS [24]. However, the 2024 Carbon Market Report noted that the total volume of allowances auctioned in 2023 increased by 7%, reaching 523 million tons of CO2 equivalent. This rise was partially influenced by the renewable energy acceleration plan of EU, which prompted the early auctioning of certain allowances to facilitate the energy transition. This temporary increase in supply placed downward pressure on CETP [57]. This phenomenon illustrates the complexity of the auction mechanism's impact on CETP, as it depends on factors such as the specific implementation method, timing, and market expectations. When auctions are viewed as a long-term strategy to enhance market efficiency and improve price discovery, they tend to drive CETP upward. In contrast, when auctions are employed to temporarily boost the supply of allowances, they can exert downward pressure on CETP.
This complexity carries significant implications for China's ETS. When implementing an auction mechanism, it is crucial to thoroughly assess the objectives, timing, and prevailing market conditions to prevent excessive price volatility resulting from improper execution. The observed CETP increase in CN ETS, driven by expectations surrounding the introduction of an auction mechanism, likely reflects the market's optimistic anticipation of auctions as a component of long-term market-oriented reforms, rather than a response to short-term supply fluctuations.
iv. The impact of strengthening data quality and regulation
After the EU ETS implemented of several regulatory enhancements, such as new anti-fraud measures, registry regulations, and the Market Stability Reserve (MSR), the CETP increased from €25 per ton of CO₂ in 2020 to nearly €100 per ton of CO₂ in 2022 [26]. A similar CETP increase was observed in the CN ETS in response to policies focused on improving data quality and regulatory oversight, as identified in this study. This underscores the importance of a robust regulatory framework in fostering market confidence and enabling effective price discovery.
v. The impact of sectoral expansion
The effect of expanding sectoral coverage on CETP within the EU ETS reveals a complex and dynamic relationship. Hu et al. [59] found that integrating high abatement cost sectors with substantial allowance demand, such as the aviation industry, into the EU ETS led to increased allowance demand, thereby driving carbon prices higher. In contrast, Hintermann et al. [60] noted that incorporating Kyoto Protocol flexible mechanisms into the EU ETS introduced additional allowance supply, which lowered the market equilibrium price. This complexity differs from the upward price impact of sectoral expansion observed in the CN ETS in this study, potentially reflecting variations in the developmental stages and market structures of the two systems.
5.1.3 Comparison of the CETP fluctuation characteristics
Jiang et al. [30] showed that CETP fluctuations in the EU ETS display typical characteristics such as price spikes, fat tails, autocorrelation, volatility clustering, and conditional variance, reflecting significant risks of extreme price movements in carbon markets. These findings align closely with the CETP fluctuation patterns observed in the CN ETS, indicating that such traits may be universal features of carbon markets.
Nevertheless, there are notable differences in the specific manifestations of volatility between the two systems. Yu et al. [31] observed that CETP returns in the EU ETS exhibit a distinct non-normal distribution, marked by left skewness and high kurtosis, which points to the presence of extreme values and fat-tail phenomena in price fluctuations. In contrast, this study finds that the returns of CN ETS exhibit slight left skewness, with a kurtosis of 9.76, significantly higher than that of the EU ETS, suggesting that extreme fluctuations are more frequent in CN ETS.
Regarding market efficiency, the EU ETS demonstrated weak-form efficiency only during Phase II (2008-2012). In contrast, inefficiencies were evident in Phase I and Phase III, driven by factors such as high transaction costs, information asymmetry, and irrational investor behavior, which contributed to heightened price volatility. Similar findings are noted in this study for the CN ETS, where high volatility persistence and significant autocorrelation indicate that both markets encounter challenges related to market efficiency at various stages of development.
Moreover, Li et al. [32] identified that the EU ETS exhibits multifractal characteristics and nonlinear complex correlations, implying that price volatility possesses long-term memory and dependencies across multiple time scales. This aligns with the long-term memory traits of price volatility observed in the CN ETS in this study. However, this feature may be more pronounced in CN ETS, as evidenced by the TGARCH model, where the α+β value reaches 1.86, far exceeding the constraint condition of 1.
It is worth noting that the two markets exhibit significant differences in terms of the leverage effect. The EU ETS demonstrates a typical leverage effect, where negative news exerts a greater influence on price volatility compared to positive news [31, 33]. In contrast, the CN ETS displays an "anti-leverage effect." This distinction highlights a fundamental disparity in the composition of market participants between the two regions. The EU ETS includes a diverse array of participants, such as industrial enterprises, financial institutions, and professional traders. It possesses strong financial characteristics, with active derivatives trading, and market prices are primarily determined by supply and demand mechanisms. Conversely, the CN ETS is predominantly composed of allowance-regulated enterprises, with limited involvement from financial institutions. Transactions in this market are more policy-driven, rendering it particularly sensitive to favorable policy signals, while its financial attributes remain relatively weaker.
5.2 Policy implications
5.2.1 Improve the market mechanism and strengthen policy coordination
The Chinese government needs to design a market stabilization and reserve mechanism to prevent extreme volatility. At the same time, the compliance mechanism and allowance allocation should be optimized to ensure that the allowance issuance time for each province is consistent, as well as the timing and quantity of auctions should reasonably designed to avoid downward pressure on CETP caused by a large the number of short-term auctions. In addition, it is necessary to improve the transparency and predictability of policies to reduce the impact of sudden policy changes on the market. Ensure the consistency of carbon market policies with energy policies and industrial policies to avoid large price fluctuations caused by policy conflicts.
5.2.2 Improve data quality and supervision efficiency
A more rigorous and transparent Monitoring, Reporting and Verification (MRV) system is fundamental to improving market confidence, and the EU ETS experience should be used to improve data quality and reliability. Meanwhile, the CN ETS regulators should strengthen market supervision, increase the cost of violations, and strengthen the binding force of compliance. In addition, they should improve the information disclosure mechanism, regularly release market operation reports and policy interpretations, improve market transparency, and help participants form reasonable expectations.
5.2.3 Enrich market structure and functions
The CN ETS authorities should steadily promote the expansion of sectors, orderly include high-emission sectors in the CN ETS, and expand the scale of the market. According to the characteristics of "anti-leverage effect" found in this study, the scope of market participants should be expanded, financial institutions and individual investors should be introduced in an orderly manner, the current single market structure dominated by performing enterprises should be improved, and market liquidity should be increased. And the Chinese regulators should develop derivatives such as carbon futures and options, provide diversified risk management tools, and enhance market depth.
By implementing these measures, the issues of price volatility and policy sensitivity in the CN ETS can be effectively mitigated. This would facilitate the market's progression toward greater maturity, stability, and efficiency, while also offering valuable lessons for other emerging ETSs.
This study investigates the policy implications of the CN ETS and the fluctuation characteristics of its CETP. By systematically assessing the effects of various policies on CETP stability and deeply analyzing the traits and patterns of price volatility in the carbon market, the study reaches the following key conclusions:
Firstly, using the Bai-Perron multiple structural break test, the study identifies three significant structural breakpoints in the CETP dynamics of the CN ETS, all of which are closely linked to policy adjustments. Policies such as concentrated trading before compliance deadlines, delays and inequalities in allowance allocation, the introduction of auction mechanisms, enhancements in data quality and regulatory oversight, and the expansion of sectoral coverage have all exerted substantial influence on CETP.
Secondly, through the application of GARCH family models, the study finds that the CETP fluctuation of CN ETS exhibits characteristics such as clustering, leptokurtosis, explosiveness, and long memory. These findings indicate that the market is insufficiently responsive to information, suffers from low liquidity, and has a relatively homogeneous participant structure, suggesting that market mechanisms remain underdeveloped. Compared to the EU ETS, CN ETS demonstrates an "anti-leverage effect," whereby positive news exerts a greater influence on CETP volatility than negative news. This reflects the dominance of allowance-regulated enterprises in CN ETS and their heightened sensitivity to favorable policy signals, contrasting sharply with the diversified participant structure of the EU ETS.
Thirdly, the findings of this study on the operational characteristics of CN ETS can provide references for emerging carbon markets. The research shows that policy stability and transparency are critical to reducing CETP volatility. We find that compliance mechanisms, allowance allocation methods, data quality management, trading activity, and structure of market participants all influence CETP dynamics, and that emerging markets should optimize these aspects to improve market efficiency and avoid abnormal CETP fluctuations.
However, this study has certain limitations. First, although the data covers key policy windows during the initial phase of CN ETS, the sample period is relatively short, which may limit the ability to capture long-term trends or cyclical patterns in CETP. Second, the study primarily focuses on the direct impact of domestic policy adjustments on CETP, without fully exploring the potential effects of changes in the international policy environment, such as the EU’s Carbon Border Adjustment Mechanism (CBAM). Future research could further analyze the spillover effects of cross-border policies like carbon border taxes on CN ETS, such as the transmission of carbon cost pressures to export-oriented enterprises and the adaptive adjustments in domestic allowance allocation, providing references for the coordination of international carbon pricing mechanisms.
In addition, future studies could adopt more advanced methodologies (e.g., machine learning or alternative volatility models) to further investigate how macroeconomic factors, such as oil price fluctuations and economic cycles, interact with CETP volatility in CN ETS, offering more precise risk management tools for market participants. Finally, the identified characteristics of CETP volatility and policy sensitivity in this study provide important implications for ESG investment strategies. Investors could incorporate carbon price volatility patterns to evaluate corporate emission reduction costs and compliance risks, optimizing green asset allocation. Meanwhile, policymakers could enhance market stabilization mechanisms to strengthen the synergy between carbon markets and ESG financial products, thereby facilitating the transition to a low-carbon economy.
The authors sincerely thank Assistant Professor Jan Ditzen (Free University of Bozen-Bolzano) for his kind and patient guidance on applying the structural breaks test in STATA.
[1] Franzke, C.L. (2021). Towards the development of economic damage functions for weather and climate extremes. Ecological Economics, 189: 107172. https://doi.org/10.1016/j.ecolecon.2021.107172
[2] ICAP. (2023). ICAP Emissions Trading Worldwide 2023 Status Report.
[3] Dudley, B. (2018). BP Statistical Review of World Energy 2018.
[4] Sheng, B., Xu, B., Pan, Y., Chen, H. (2021). How to efficiently promote distributed energy resources in China: Using a nonparametric econometric method. Journal of Cleaner Production, 285: 125420. https://doi.org/10.1016/j.jclepro.2020.125420
[5] Deng, J., Zheng, Y., Zhang, Y., Liu, C., Pan, H. (2023). Dynamic spillovers between carbon price and power sector returns in China: A network-based analysis before and after launching national carbon emissions trading market. Energies, 16(14): 5578. https://doi.org/10.3390/en16145578
[6] Ministry of Ecology and Environment of the People’s Republic of China. (2024). Progress Report of China’s national carbon market (2024). https://www.mee.gov.cn/ywdt/xwfb/202407/W020240722528850763859.pdf.
[7] Dong, F., Gao, Y., Li, Y., Zhu, J., Hu, M., Zhang, X. (2022). Exploring volatility of carbon price in European Union due to COVID-19 pandemic. Environmental Science and Pollution Research, 29(6): 8269-8280. https://doi.org/10.1007/s11356-021-16052-1
[8] Liu, J., Hu, X., Yan, L. (2022). Structural change features and influencing factors of China’s carbon price. Emerging Markets Finance and Trade, 59(14): 3952-3967. https://doi.org/10.1080/1540496X.2022.2156280
[9] Lovcha, Y., Perez-Laborda, A., Sikora, I. (2022). The determinants of CO2 prices in the EU emission trading system. Applied Energy, 305: 117903. https://doi.org/10.1016/j.apenergy.2021.117903
[10] Shi, C., Zeng, Q., Zhi, J., Na, X., Cheng, S. (2023). A study on the response of carbon emission rights price to energy price macroeconomy and weather conditions. Environmental Science and Pollution Research, 30(12): 33833-33848. https://doi.org/10.1007/s11356-022-24577-2
[11] Song, X., Zhang, W., Ge, Z., Huang, S., Huang, Y., Xiong, S. (2022). A study of the influencing factors on the carbon emission trading price in China based on the improved gray relational analysis model. Sustainability, 14(13): 8002. https://doi.org/10.3390/su14138002
[12] Zeng, S., Fu, Q., Yang, D., Tian, Y., Yu, Y. (2023). The influencing factors of the carbon trading price: A case of China against a “Double Carbon” Background. Sustainability, 15(3): 2203. https://doi.org/10.3390/su15032203
[13] Wang, L., Yin, K., Cao, Y., Li, X. (2019). A new grey relational analysis model based on the characteristic of inscribed core (IC-GRA) and its application on seven-pilot carbon trading markets of China. International Journal of Environmental Research and Public Health, 16(1): 99. https://doi.org/10.3390/ijerph16010099
[14] Wang, Z.J., Zhao, L.T. (2021). The impact of the global stock and energy market on EU ETS: A structural equation modelling approach. Journal of Cleaner Production, 289: 125140. https://doi.org/10.1016/j.jclepro.2020.125140
[15] Yang, X., Zhang, C., Yang, Y., Wu, Y., Yun, P., Wagan, Z.A. (2020). China’s carbon pricing based on heterogeneous tail distribution. Sustainability, 12(7): 2754. https://doi.org/10.3390/su12072754
[16] Christiansen, A.C., Arvanitakis, A., Tangen, K., Hasselknippe, H. (2005). Price determinants in the EU emissions trading scheme. Climate Policy, 5(1): 15-30. https://doi.org/10.1080/14693062.2005.9685538
[17] Carraro, C., Favero, A. (2009). The economic and financial determinants of carbon prices. Finance Uver-Czech Journal of Economics and Finance, 59(5): 396-409.
[18] Riehl, B., Wang, G., Eshpeter, S., Zhang, H., Innes, J.L., Li, N., Li, J., Niles, J.O. (2016). Lessons learned in mandatory carbon market development. International Review of Environmental and Resource Economics, 10(3-4): 227-268. https://doi.org/10.1561/101.00000087
[19] Yang, B., Liu, C., Gou, Z., Man, J., Su, Y. (2018). How will policies of China’s CO2 ETS affect its carbon price: Evidence from Chinese pilot regions. Sustainability, 10(3): 605. https://doi.org/10.3390/su10030605
[20] Jiang, C., Yue, Y. (2021). Sensitivity analysis of key factors influencing carbon prices under the EU ETS. Polish Journal of Environmental Studies, 30(4): 3645-3658. https://doi.org/10.15244/pjoes/131083
[21] Mansanet-Bataller, M., Pardo, A., Valor, E. (2007). CO2 prices, energy and weather. The Energy Journal, 28(3): 73-92. https://doi.org/10.5547/ISSN0195-6574-EJ-Vol28-No3-5
[22] Lin, B., Jia, Z. (2019). What are the main factors affecting carbon price in emission trading scheme? A case study in China. Science of The Total Environment, 654: 525-534. https://doi.org/10.1016/j.scitotenv.2018.11.106
[23] Ji, C.J., Hu, Y. J., Tang, B.J., Qu, S. (2021). Price drivers in the carbon emissions trading scheme: Evidence from Chinese emissions trading scheme pilots. Journal of Cleaner Production, 278: 123469. https://doi.org/10.1016/j.jclepro.2020.123469
[24] Wiese, C., Cowart, R., Rosenow, J. (2020). The strategic use of auctioning revenues to foster energy efficiency: Status quo and potential within the European Union emissions trading system. Energy Efficiency, 13(8): 1677-1688. https://doi.org/10.1007/s12053-020-09894-0
[25] Cantillon, E., Slechten, A. (2023). Market design for the environment (No. w31987). National Bureau of Economic Research. https://doi.org/10.3386/w31987
[26] Isah, K.O. (2024). Analysis of the dynamics of carbon pricing: The role of speculation in the emissions trading system (ETS). Ph.D. Thesis, University of Kwazulu-Natal. https://doi.org/10.29086/10413/23089
[27] Zhu, J., Zhao, Y., Zheng, L. (2024). The impact of the EU carbon border adjustment mechanism on China’s exports to the EU. Energies, 17(2): 509. https://doi.org/10.3390/en17020509
[28] Chung, C.Y., Jeong, M., Young, J. (2018). The price determinants of the EU allowance in the EU emissions trading scheme. Sustainability, 10(11): 4009. https://doi.org/10.3390/su10114009
[29] Zhang, S., Ji, H., Tian, M., Wang, B. (2022). High-dimensional nonlinear dependence and risk spillovers analysis between China’s carbon market and its major influence factors. Annals of Operations Research, 345(2): 831-860. https://doi.org/10.1007/s10479-022-04770-9
[30] Jiang, J., Ye, B., Ma, X. (2015). Value-at-risk estimation of carbon spot markets based on an integrated GARCH-EVT-VaR model. Acta Scientiarum Naturalium Universitatis Pekinensis, 51(3): 511-517. https://doi.org/10.13209/j.0479-8023.2015.018
[31] Yu, H., Wang, H., Liang, C., Liu, Z., Wang, S. (2022). Carbon market volatility analysis based on structural breaks: Evidence from EU-ETS and China. Frontiers in Environmental Science, 10: 973855. https://doi.org/10.3389/fenvs.2022.973855
[32] Li, W., Li, J.P., Su, C. (2023). Are economic policy uncertainty and carbon futures price interacting? Evidence from the European Union. Heliyon, 9(10): e21132. https://doi.org/10.1016/j.heliyon.2023.e21132
[33] Yu, B., Chang, Z. (2024). Connectedness of carbon price and energy price under shocks: A study based on positive and negative price volatility. Sustainability, 16(12): 5226. https://doi.org/10.3390/su16125226
[34] Lv, Y., Shao, L. (2015). Price fluctuation characteristics research of China’s carbon emissions based on the analysis of the family of GARCH model. Price: Theory & Practice, 12: 62-64. https://doi.org/10.19851/j.cnki.cn11-1010/f.2015.12.019
[35] Zhang, Q. (2016). The Research of China's carbon market price change: Based on the observation of the seven pilot carbon market. Master’s thesis, Guangdong Academy of Social Sciences.
[36] Cong, R., Lo, A.Y. (2017). Emission trading and carbon market performance in Shenzhen, China. Applied Energy, 193: 414-425. https://doi.org/10.1016/j.apenergy.2017.02.037
[37] Zhou, K., Li, Y. (2019). Influencing factors and fluctuation characteristics of China’s carbon emission trading price. Physica A: Statistical Mechanics and Its Applications, 524: 459-474. https://doi.org/10.1016/j.physa.2019.04.249
[38] Sheng, Z., Han, Z., Yuwei, Q., Boya, Z. (2021). Study on price fluctuation and influencing factors of regional carbon emission trading in China under the background of high-quality economic development. International Energy Journal, 21(2): 201-211.
[39] Wei, J., Chen, J. (2024). Research on carbon allowance price non-linear structure characteristics and regime switching mechanism in China’s carbon market. Polish Journal of Environmental Studies, 33(2): 1375-1389. https://doi.org/10.15244/pjoes/172763
[40] Bai, J., Perron, P. (1998). Estimating and testing linear models with multiple structural changes. Econometrica, 66(1): 47. https://doi.org/10.2307/2998540
[41] Bai, J., Perron, P. (2003). Computation and analysis of multiple structural change models. Journal of Applied Econometrics, 18(1): 1-22. https://doi.org/10.1002/jae.659
[42] Diaz-Rainey, I., Tulloch, D.J. (2018). Carbon pricing and system linking: Lessons from the new zealand emissions trading scheme. Energy Economics, 73: 66-79. https://doi.org/10.1016/j.eneco.2018.04.035
[43] Karavias, Y., Narayan, P.K., Westerlund, J. (2023). Structural breaks in interactive effects panels and the stock market reaction to COVID-19. Journal of Business & Economic Statistics, 41(3): 653-666. https://doi.org/10.1080/07350015.2022.2053690
[44] Bauwens, L., Laurent, S., Rombouts, J.V.K. (2003). Multivariate GARCH models: A survey. Rochester, NY: Social Science Research Network (SSRN), CORE Discussion Paper No. 2003/31. https://doi.org/10.2139/ssrn.411062
[45] Bollerslev, T. (1986). Generalized autoregressive conditional heteroskedasticity. Journal of Econometrics, 31(3): 307-327. https://doi.org/10.1016/0304-4076(86)90063-1
[46] Diamantopoulos, K., Vrontos, I.D. (2008). A student-t full factor multivariate GARCH model. Rochester, NY: Social Science Research Network (SSRN). https://doi.org/10.2139/ssrn.1124400
[47] Glosten, L.R., Jagannathan, R., Runkle, D.E. (1993). On the relation between the expected value and the volatility of the nominal excess return on stocks. The Journal of Finance, 48(5): 1779-1801. https://doi.org/10.1111/j.1540-6261.1993.tb05128.x
[48] Islam, S. (2023). Asymmetric covariance, volatility, and time-varying risk premium: Evidence from the finnish stock market. Rochester, NY: Social Science Research Network (SSRN). https://doi.org/10.2139/ssrn.4413409
[49] Kat, H.M., Heynen, R.C. (2001). Volatility prediction: A comparison of the stochastic volatility, GARCH (1,1) and Egarch (1,1) models. Rochester, NY: Social Science Research Network (SSRN). https://papers.ssrn.com/abstract=265008.
[50] Nelson, D.B. (1991). Conditional heteroskedasticity in asset returns: A new approach. Econometrica, 59(2): 347-370. https://doi.org/10.2307/2938260
[51] Islam, S. (2023). Asymmetric covariance, volatility, and time-varying risk premium: Evidence from the Finnish stock market. NY: Social Science Research Network (SSRN). https://doi.org/10.2139/ssrn.4413409
[52] Ditzen, J., Karavias, Y., Westerlund, J. (2021). Testing and estimating structural breaks in time series and panel data in Stata. arXiv Preprint arXiv:2110.14550. http://arxiv.org/abs/2110.14550.
[53] Muth, J.F. (1961). Rational Expectations and the Theory of Price Movements. Econometrica.
[54] Nerlove, M. (1958). Adaptive expectations and cobweb phenomena. The Quarterly Journal of Economics, 72(2): 227-240. https://doi.org/10.2307/1880597
[55] Bikhchandani, S., Hirshleifer, D., Welch, I. (1992). A theory of fads, fashion, custom, and cultural change as informational cascades. Journal of Political Economy, 100(5): 992-1026.
[56] Petrova, M., Todorov, T. (2023). Empirical testing of models of autoregressive conditional heteroscedasticity used for prediction of the volatility of Bulgarian Investment Funds. Risks, 11(11): 197. https://doi.org/10.3390/risks11110197
[57] European Securities and Markets Authority. (2024). Carbon markets report 2024. https://www.esma.europa.eu/sites/default/files/2024-10/ESMA50-43599798-10379_Carbon_markets_report_2024.pdf.
[58] European Parliament. (2023). The EU emissions trading system: Method and effects of free allowance allocation. https://www.europarl.europa.eu/RegData/etudes/IDAN/2023/755098/IPOL_IDA(2023)755098_EN.pdf.
[59] Hu, J., Crijns-Graus, W., Lam, L., Gilbert, A. (2015). Ex-ante evaluation of EU ETS during 2013-2030: EU-internal abatement. Energy Policy, 77: 152-163. https://doi.org/10.1016/j.enpol.2014.11.023
[60] Hintermann, B., Peterson, S., Rickels, W. (2016). Price and market behavior in Phase II of the EU ETS: A review of the literature. Review of Environmental Economics and Policy, 10(1): 108-128. https://doi.org/10.1093/reep/rev015