Muhammad Rizal*![]() | Sigit Priyanto
| Sigit Priyanto![]() | Mukhammad Rizka Fahmi Amrozi
| Mukhammad Rizka Fahmi Amrozi![]()
© 2025 The authors. This article is published by IIETA and is licensed under the CC BY 4.0 license (http://creativecommons.org/licenses/by/4.0/).
OPEN ACCESS
This study aims to project the growth of the number of passengers at major ports in Indonesia during the period 2022 to 2032 using a time series approach based on the Compound Annual Growth Rate (CAGR). Historical data on sea passenger arrivals and departures from 2017 to 2021 obtained from the Directorate General of Sea Transportation and the Central Statistics Agency (BPS) are the basis for the analysis. The results of the study show a significant growing trend in several strategic ports, such as Tanjung Perak Port, which is projected to experience a growth of 169.91%, from 525,352 passengers in 2022 to 1,418,450 passengers in 2032. Likewise, Benoa, Balikpapan, and Kupang Ports also recorded substantial increases. The practical implications of these findings can be utilized by policymakers for better port infrastructure development planning, including increasing terminal capacity, supporting facilities, and land transportation connectivity. On the theoretical side, this study contributes to the development of maritime transportation demand modeling literature by integrating quantitative prediction methods based on historical data. Future research could explore the impacts of climate change on maritime transport operations, including disruptions from extreme weather and sea level rise. In addition, the role of digitalization, such as the implementation of smart ports, automation of loading and unloading, and integration of information systems across modes of transport, is also a relevant area of study.
passenger forecast, sea transportation, Indonesian ports, Compound Annual Growth Rate (CAGR), time series, transportation infrastructure
Transportation is the process of transporting people and goods (cargo) from one place to another [1]. Transportation consists of two important components, namely transfer or movement, which is the process of physically changing the location of goods and passengers [2]. Transporting people or goods by ship through shipping lanes is called sea transportation.
Indonesia is the largest archipelagic country in the world, with more than 17,504 islands [3]. With so many islands, sea transportation is needed to unite Indonesia's islands, regions, and territories. Sea transportation focuses on connecting the outermost and underdeveloped areas throughout Indonesia.
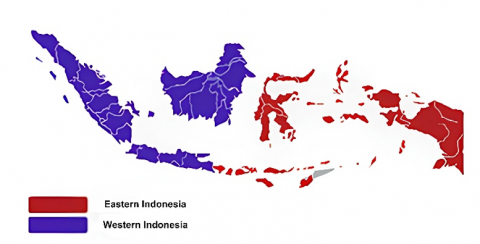
Indonesia has two parts: western Indonesia, which consists of the islands of Sumatra, Java, and Kalimantan, and eastern Indonesia, which consists of the islands of Bali, Nusa Tenggara, Sulawesi, Maluku, and Papua.
The Eastern Indonesian region has unique characteristics, with thousands of islands spread across the vast ocean, varied topography, and many large and small islands separated by vast oceans [4]. The limitations of land transportation infrastructure make sea transportation the main choice for moving goods and people.
This geographical condition makes sea transportation the main means for population mobility and distribution of goods. Over the past few decades, the government has attempted to improve maritime connectivity in this region through various programs and initiatives, such as the development of sea toll and port infrastructure [5]. Increased accessibility and population mobility have driven an increase in the number of ship passengers. Thus, a more in-depth study is needed to understand the distribution of this growth and support more effective transportation planning.
Various factors, such as increased economic activity, changes in migration patterns, and the development of the tourism sector, have played a role in the growth number of ship passengers in the eastern regions of Indonesia. Many areas in this region still have great potential for economic growth in the future. Therefore, estimating the distribution of increasing ship passengers is important to plan future infrastructure and sea transportation service needs. Several recent studies highlight issues related to port infrastructure planning and passenger growth. Research by Krile and Maiorov [6] proposes changes to ship passenger infrastructure based on a digital transportation model. Also, research by Bernacki and Lis [7] identifies and measures the direct economic impacts resulting from increased access to seaports by comparing transportation performance.
In addition to economic factors, social and demographic changes also increase the number of ship passengers. Population growth, urbanization, and changes in the community's lifestyle and transportation preferences also influence this increase [8]. Therefore, these demographic factors must be considered to provide a more comprehensive picture in estimating the distribution of ship passenger growth. Infrastructure and logistics also contribute to the distribution and growth of ship passengers in this region. Difficult geographical conditions, limited access to remote islands, and limited port capacity can reduce the number of passengers.
Figure 1 shows an illustration of a map depicting the division of western and eastern Indonesia.
Figure 1. Map illustration showing the division of western and eastern regions of Indonesia
Passenger growth prediction holds a crucial role in enhancing the efficiency and effectiveness of sea transportation in Indonesia, especially in its eastern regions. Yet, recent studies of sea transportation in eastern Indonesia are mainly focus on the benefits of sea transportation in maintaining the availability of goods [5, 9] the economics aspect of port infrastructure development in the regions [10, 11]. Despite its importance, passengers’ growth and its spatial distribution has not yet received sufficient attention that planning capacity for ships and port infrastructure development cannot be optimized. As a result, there is an imbalance between the demand and the supply of sea transportation services. Without an accurate passenger growth prediction, there is a risk for discrepancy between the routes and frequencies of the ship services and the needs of sea transportation for the people in either in the regions with more capacities or in the regions of which accesses are still insufficient. Furthermore, the development of ports tends to focus on the role of ports as trade and logistic nodes without considering the needs of passengers’ mobility which relies heavily on the sea transportation services. The lack of integration between sea transportation services and land transportation services have also impacted the connectivity in the regions.
With the availability of comprehensive passengers’ growth prediction models, sea transportation planning might be better conducted, especially in supporting interregional connectivity. This spatial modeling facilitates the identification of the growth numbers of passengers in each region that the capacity of the ships, the shipping routes, and the infrastructure development of the ports can be adjusted with the local demands and necessities. Understanding the movement patterns of the passengers may assist in enhancing the efficiency of sea transportation operation and services. Therefore, the orientation of port development will not only focus on the economic and logistic aspects but also consider the transportation needs of people in the regions with restricted connectivity.
This paper proposes the need to develop a more comprehensive passenger growth distribution model that is in accordance with the geographical characteristics and transportation connectivity in eastern Indonesia. Estimating the distribution of ship passenger growth can be an important tool in planning and developing port infrastructure and determining government and private sector investment priorities.
2.1 Ship passenger growth concept
The ship passenger growth concept refers to the increase in the total number of passengers using shipping services in a specific period. This growth is often driven by a growing tourism sector, better accessibility due to improved port infrastructure, and positive economic conditions that increase people's purchasing power [12]. In demand analysis, models that consider variables such as ticket prices, income, and alternative modes of transportation are often used to predict future total passenger [10]. The impacts of this growth can be felt socially and economically, including increasing local incomes and creating jobs [13]. However, challenges, such as port congestion and environmental issues, must be addressed. Government transport policies, such as subsidies and infrastructure investment, also play a crucial role in supporting this growth, ensuring that the shipping sector can develop well while maintaining safety and quality of service. Maritime shipping plays a vital role in maritime policy and economic development in each maritime country.
Research by Jugović et al. [14] analyzes the factors that influence demand and supply in the sea transportation market. The findings from this study show that five factors influence demand: global economic growth, international trade volume, fluctuations in goods prices, trade policies, and specific demand for shipping services. On the other hand, supply factors include ship operating and maintenance costs, fleet size and condition, technology and innovation, environmental regulations, and the availability of ports and related infrastructure. Understanding these factors thoroughly is essential for investors to make informed investment decisions and estimate future profits. Sea transportation is one of the main activities of the blue economy that plays a vital role in the European Union (EU). Research by Fratila et al. [15] emphasizes that sea transportation, air pollutants (NOx and SO2) from sea transportation, and investment in seaport infrastructure positively correlate with economic growth. In other words, a 10% increase in these factors has resulted in a corresponding rise in economic growth rates of around 1.6%, 0.4%, 0.8%, and 0.7%, respectively. The impact of maritime logistics on the economic development of the islands in eastern Indonesia is one of the determining factors in developing inter-regional trade cooperation. Research by Amin et al. [9] states that low port efficiency can disrupt the distribution of goods between islands, resulting in higher logistics costs.
2.2 Growth distribution model
Passenger growth distribution models require an understanding of distribution theory, including the normal, log-normal, or Poisson distributions [16]. These models can predict passenger growth patterns based on historical data and related variables.
2.2.1 Normal distribution
The normal or Gaussian distribution is a continuous random variable with a bell curve. Its probability function describes the data spread symmetrically, with a peak at the mean value and sloping to both sides [17, 18]. Figure 2 shows an example of a normal distribution curve graph.
Figure 2. Normal distribution
2.2.2 Log-normal distribution
The log-normal distribution is a probability distribution used to describe variables with positive results and values that tend to spread logarithmically [19, 20]. Figure 3 shows an example of a log-normal distribution curve.
Figure 3. Log-normal distribution
2.2.3 Poisson distribution
Poisson distribution is a distribution for events with a small probability of occurrence, where the event depends on a certain time interval or in a certain area, with observation results in the form of discrete variables, and predictor variables are mutually independent [21]. The time interval can be any length, e.g., a minute, a day, a week, a month, or even a year. Such a specific area can be a line, an area, or a volume. Figure 4 below shows an example of a poisson distribution curve graph.
Figure 4. Poisson distribution
2.3 Inferential method
Inferential methods are statistical approaches used to draw conclusions or generalizations about a population based on samples taken from that population [22, 23]. The main purpose of inferential methods is to estimate or test hypotheses about population parameters (such as means or proportions) based on data obtained from samples [24].
2.3.1 Linear regression
Linear regression is a statistical technique used to analyze the relationship between one dependent variable and one or more independent variables [25, 26]. The main goal of linear regression is to model this relationship so that we can predict the value of the dependent variable based on the values of the independent variables [27]. A simple linear regression model is expressed in the form of Eq. (1):
$Y=a+b X+\in$ (1)
where,
Y = dependent variable to be predicted;
X = independent variable;
a = intercept (the point where the regression line crosses the Y-axis);
b = regression coefficient (shows the average change in Y for every one-unit change in X);
ϵ = error term (the difference between the predicted and actual values).
2.4 Transportation demand theory
Transportation demand refers to the mobility needs of individuals or goods within a transportation system to reach specific destinations, such as work, education, recreation, or logistics distribution [28]. This demand is generally derived, meaning that travel is not undertaken as a primary goal but as a consequence of other activities, such as employment, commerce, or social interactions [29]. Several key factors influence transportation demand, including economic conditions, demographics, travel distance, availability of transportation modes, and government policies and infrastructure [30].
The transportation demand analysis framework consists of four key stages: trip generation, trip distribution, mode choice, and route choice. Trip generation determines the number of trips originating from a particular area, influenced by economic activity, urbanization, and population density. Trip distribution analyzes how trips are allocated between origins and destinations, reflecting accessibility and spatial interactions between different regions. Mode choice refers to the selection of transport modes (e.g., road, rail, sea, or air) based on cost, time, and convenience. Lastly, route choice determines the specific paths travelers take, which is influenced by infrastructure quality and network efficiency.
In the context of passenger growth in eastern Indonesia, transportation demand theory provides a framework for understanding why the number of passengers in this region continues to increase. Several interrelated factors contribute to the high demand for transportation. First, geographical constraints play a significant role, as eastern regions of Indonesia consist of numerous islands with limited road infrastructure, making sea and air transport the primary modes of mobility. This naturally leads to higher trip generation through ports and airports compared to regions with more developed road networks. Second, economic and demographic factors drive mobility demand in the region. The growth of industries such as fisheries, mining, and tourism increases the need for business travel, labor movement, and logistics transport, directly influencing trip generation and trip distribution. Additionally, population growth and urban expansion lead to increased travel demand for education, healthcare, and trade.
Third, the availability of transportation modes and government policies significantly impact passenger growth. Investments in port infrastructure, inter-island shipping routes, and aviation connectivity have improved accessibility, encouraging more people to travel. Government policies promoting regional development and tourism, such as initiatives to boost tourism in Labuan Bajo, Raja Ampat, and Wakatobi, have further stimulated passenger growth by increasing travel frequency and mode availability. Lastly, route choice is shaped by infrastructure improvements and transportation costs. With the expansion of ferry services and increased airline connectivity, passengers in eastern Indonesia have more options for inter-island travel. However, factors such as affordability and service reliability continue to influence route selection and overall passenger mobility trends.
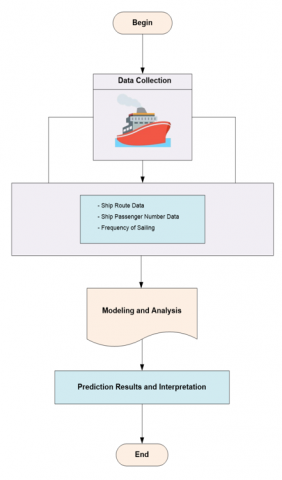
The research methodology designed in this study consists of several systematic steps. Figure 5 shows an overview of the research stages that will be used.
Based on the description of the research stages presented in Figure 5, five stages will be carried out to realize this study's results, starting from the problem identification stage, literature study, variable determination, data collection, and data processing and analysis.
In this study, the data collection process is obtained from PT. PELNI and the Directorate General of Sea Transportation of Kemenhub RI, especially related to data on the arrival and departure of sea passengers. Meanwhile, the data that will be used as independent variables in each province will be obtained from the BPS of each province.
In predicting the growth of the number of passengers in the eastern Indonesia region, the modeling process is carried out using a time series approach to identify growth patterns from historical data from 2017 to 2021. The formula used to project future passenger numbers at each port from 2022 to 2032 is shown in Eq. (2) below:
$\mathrm{Pt}=\mathrm{P} 0 \times(1+\mathrm{r})^{\mathrm{t}}$ (2)
where,
Pt = the number of passengers in year -t;
P0 = the initial number of passengers (2022);
r = the annual growth rate (17% or 0.17);
t = the number of years from the initial year (2022).
To ensure the accuracy of the prediction results, model validation is carried out by comparing predictions with historical data. Testing is carried out by calculating the Mean Absolute Percentage Error (MAPE) as an indicator of deviation between predictions and actual data. In addition, sensitivity analysis is also applied by varying the CAGR parameters based on scenarios in various economic and operational conditions. With this approach, the model can provide an accurate picture of the growth rate in the number of passengers and help identify areas that require enhancing sea transportation services in the eastern regions of Indonesia.
Figure 5. Research stages
4.1 Data of the total ships in the eastern Indonesia region
Based on the data collection results, 23 ships serve the eastern Indonesia region, as presented in Table 1.
Table 1. Data on total ships based on routes per region
|
Region |
Total Ships |
Percentage (%) |
|
Sulawesi |
16 |
69.57 |
|
Bali |
7 |
30.43 |
|
Nusa Tenggara |
7 |
30.43 |
|
Maluku |
11 |
47.83 |
|
Papua |
8 |
34.78 |
|
Total |
23 |
100 |
Table 1 shows that the Sulawesi region is the most served, namely 16 ships (69.57%). This shows a high level of services in this area. The Maluku and Papua regions have many ships, 11 (47.83%) and 8 (34.78%) ships, respectively. Furthermore, Bali and Nusa Tenggara have the same number of ships, namely seven ships, indicating that both have relatively comparable services. These data suggest that the Sulawesi region dominates the number of ships operating in eastern Indonesia. The handling and development of maritime services in areas with fewer ships must be considered to increase accessibility and support economic growth in each region.
4.2 Data on total passengers
The number of ships available in a region directly affects the passenger capacity [30]. The more ships operate, the greater the capacity to transport passengers.
The distribution of growth in ship passengers in the eastern Indonesia region illustrates the growth pattern of the number of passengers using ships to travel in this region.
The complex phenomenon of the increase in the number of ship passengers in eastern Indonesia involves various economic, demographic, and infrastructure aspects [31]. In recent years, there has been a significant spike in the number of ship passengers in this region. The following Eq. (3) is used to calculate the average annual growth rate of CAGR:
$C A G R=\frac{(P t) \frac{1}{n}}{(P 0)}-1$ (3)
where,
n = Total year (difference between initial and final years);
P0 = Total passengers in the initial year (2017);
Pt = Total passengers in the final year (2021).
Based on Eq. (3), the results of the CAGR are obtained, shown in Table 2.
Table 2 shows that in 2017-2019, most ships showed growth or consistency in the number of passengers. For example, Kelud grew from 181,277 (2017) to 421,659 (2019), and Labobar from 223,103 to 307,361. Meanwhile, in 2020, almost all ships experienced a significant decrease in the number of passengers; this was due to the COVID-19 pandemic. This is seen in Awu that experienced a decline from 125,406 (2019) to 52,090 (2020), and Sinabung that decreased from 367,044 (2019) to 114,903 (2020).
Table 2. Results of CAGR (2017-2021)
|
Ship Name |
Passenger Capacity |
Year |
||||
|
2017 |
2018 |
2019 |
2020 |
2021 |
||
|
Awu |
961 |
137,416 |
156,323 |
125,406 |
52,090 |
59,998 |
|
Binaiya |
962 |
101,522 |
122,915 |
140,780 |
43,018 |
52,114 |
|
Bukit Raya |
962 |
120,628 |
88,673 |
120,920 |
46,586 |
43,778 |
|
Bukit Siguntang |
1995 |
296,675 |
291,863 |
341,876 |
119,512 |
162,572 |
|
Ciremai |
835 |
175,027 |
186,936 |
226,211 |
73,810 |
77,386 |
|
Dobonsolo |
1300 |
150,168 |
179,211 |
220,801 |
89,786 |
97,354 |
|
Dorolonda |
2138 |
170,152 |
177,476 |
307,464 |
113,674 |
128,702 |
|
Egon |
544 |
491,36 |
65,786 |
80,711 |
47,143 |
50,605 |
|
Gunung Dempo |
1575 |
139,671 |
149,229 |
248,902 |
81,900 |
74,893 |
|
Jet Liner |
554 |
451,48 |
54,287 |
435,89 |
19,209 |
15,853 |
|
Kelimutu |
912 |
869,13 |
80,659 |
102,716 |
23,521 |
35,320 |
|
Kelud |
2605 |
181,277 |
205,371 |
421,650 |
114,065 |
103,238 |
|
Labobar |
3076 |
223,103 |
256,914 |
307,361 |
115,875 |
125,108 |
|
Lambelu |
1995 |
256,408 |
305,885 |
329,536 |
125,451 |
160,172 |
|
Lawit |
912 |
391,97 |
30,697 |
706,97 |
12,649 |
24,658 |
|
Leuser |
962 |
648,72 |
70,554 |
99,762 |
28,165 |
45,921 |
|
Nggapulu |
2138 |
219,749 |
248,283 |
327,350 |
93,239 |
138,790 |
|
Pangrango |
494 |
429,71 |
62,672 |
668,64 |
23,780 |
28,686 |
|
Sangiang |
548 |
184,15 |
185,02 |
20,318 |
4,659 |
10,641 |
|
Sinabung |
1774 |
189,233 |
222,110 |
367,044 |
114,903 |
111,351 |
|
Sirimau |
961 |
843,98 |
91,084 |
99,480 |
33,319 |
30,268 |
|
Tatamailau |
969 |
740,53 |
74,640 |
95,676 |
31,098 |
32,936 |
|
Tidar |
1904 |
195,254 |
193,554 |
271,241 |
107,849 |
86,991 |
|
Tilongkabila |
962 |
131,932 |
140,397 |
146,329 |
38,239 |
46,865 |
|
Umsini |
1721 |
130,472 |
110,383 |
186,980 |
45,904 |
47,413 |
|
Wilis |
548 |
249,93 |
32,798 |
48,701 |
17,363 |
19,913 |
This analysis shows that before the pandemic, most ships experienced positive growth. However, the COVID-19 pandemic significantly impacted with a sharp decline in 2020. Although there are signs of recovery in 2021, the total number of passengers has not yet reached the 2019 level.
4.3 Prediction of passenger growth
Total Passenger Prediction estimates future passengers based on historical data and existing growth patterns.
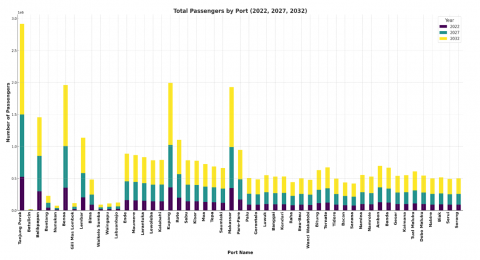
Table 3 shows the results of the time series analysis of passenger growth predictions for several ports in the Eastern Indonesia region.
Next, Figure 6 shows a graph of the predicted growth rate for each port from 2022 to 2032.
Based on Table 3, the analysis of passenger growth in ports in Indonesia shows a significant trend from 2022 to 2032. For example, Tanjung Perak Port has experienced a tremendous increase, with the number of passengers projected to increase from 525,352 people in 2022 to 1,418,450 people in 2032, reflecting an absolute growth of 893,098 people or around 169.91%. On the other hand, Benoa Port also showed positive growth, with an increase from 352,588 passengers in 2022 to 951,988 passengers in 2032, resulting in an absolute growth of 599,400 people or 169.91%. Other ports such as Balikpapan and Kupang also showed substantial growth, with projected passenger growth reaching 603,414 and 969,597 people respectively by 2032.
Table 3. Prediction of passenger growth in each port (2022-2023)
|
No. |
Port Name |
Total Passengers |
||
|
2022 (People) |
2027 (People) |
2032 (People) |
||
|
1 |
Tanjung Perak |
525,352 |
971,901 |
1,418,450 |
|
2 |
Batulicin |
3,605 |
6,670 |
9,735 |
|
3 |
Balikpapan |
298,720 |
552,632 |
603,414 |
|
4 |
Bontang |
41,084 |
76,005 |
110,926 |
|
5 |
Nunukan |
13,242 |
24,497 |
35,754 |
|
6 |
Benoa |
352,588 |
652,289 |
951,988 |
|
7 |
Gili Mas Lombok |
20,519 |
37,960 |
55,401 |
|
8 |
Lembar |
204,630 |
378,566 |
552,502 |
|
9 |
Bima |
87,025 |
160,996 |
234,967 |
|
10 |
Waikelo Sumba |
16,452 |
30,436 |
44,420 |
|
11 |
Waingapu |
19,630 |
36,316 |
53,001 |
|
12 |
Labuanbajo |
22,268 |
41,196 |
60,124 |
|
13 |
Ende |
159,662 |
295,374 |
431,086 |
|
14 |
Maumere |
155,655 |
287,962 |
420,289 |
|
15 |
Larantuka |
149,789 |
277,110 |
404,431 |
|
16 |
Lewoleba |
140,951 |
260,759 |
380,567 |
|
17 |
Kalabahi |
141,873 |
262,465 |
383,057 |
|
18 |
Kupang |
359,110 |
664,354 |
969,597 |
|
19 |
Rote |
198,619 |
367,445 |
536,271 |
|
20 |
Sabu |
140,911 |
260,685 |
380,459 |
|
21 |
Kisar |
139,528 |
258,127 |
376,726 |
|
22 |
Moa |
130,290 |
241,037 |
351,784 |
|
23 |
Tepa |
126,936 |
234,832 |
324,728 |
|
24 |
Saumlaki |
119,314 |
220,731 |
322,148 |
|
25 |
Makassar |
347,292 |
642,490 |
937,688 |
|
26 |
Average |
159,869 |
295,758 |
431,647 |
|
27 |
Pare-Pare |
170,095 |
314,676 |
459,257 |
|
28 |
Palu |
91,120 |
168,572 |
246,024 |
|
29 |
Gorontalo |
87,286 |
161,479 |
235,672 |
|
30 |
Luwuk |
99,111 |
183,355 |
267,599 |
|
31 |
Banggai |
94,885 |
175,537 |
256,189 |
|
32 |
Kendari |
95,250 |
176,213 |
257,176 |
|
33 |
Raha |
79,450 |
146,983 |
214,515 |
|
34 |
Bau-Bau |
90,331 |
167,112 |
243,893 |
|
35 |
Wanci Wakatobi |
85,845 |
158,813 |
231,781 |
|
36 |
Bitung |
113,046 |
209,135 |
305,224 |
|
37 |
Ternate |
120,750 |
223,388 |
326,026 |
|
38 |
Tidore |
89,111 |
164,855 |
240,599 |
|
39 |
Bacan |
78,739 |
145,667 |
212,595 |
|
40 |
Sanana |
75,873 |
139,365 |
203,857 |
|
41 |
Namlea |
99,445 |
183,973 |
268,501 |
|
42 |
Namrole |
95,110 |
175,953 |
256,796 |
|
43 |
Ambon |
125,451 |
232,084 |
338,717 |
|
44 |
Banda |
120,015 |
222,028 |
324,041 |
|
45 |
Geser |
97,490 |
180,357 |
263,224 |
|
46 |
Kaimana |
99,292 |
183,690 |
268,088 |
|
47 |
Tual Maluku |
109,525 |
202,621 |
295,717 |
|
48 |
Dobo Maluku |
97,915 |
181,143 |
264,371 |
|
49 |
Nabire |
90,173 |
166,820 |
243,467 |
|
50 |
Biak |
92,510 |
171,144 |
249,778 |
|
51 |
Serui |
88,660 |
164,021 |
239,382 |
|
52 |
Sorong |
90,354 |
167,155 |
243,956 |
|
53 |
Manokwari |
89,985 |
166,472 |
242,959 |
|
54 |
Fak-Fak |
92,236 |
170,637 |
249,038 |
|
55 |
Wasior |
82,665 |
152,930 |
223,195 |
|
56 |
Jayapura |
97,452 |
180,286 |
263,120 |
|
57 |
Agats |
85,760 |
158,656 |
231,552 |
|
58 |
Marauke |
86,563 |
160,142 |
233,721 |
Figure 6. Predicted growth rate of each port in 2022-2032
High growth rates at certain ports can be caused by a variety of interrelated factors. First, rapid regional economic growth, as seen at the ports of Tanjung Perak and Kupang, often drives increased passenger numbers due to the development of trade, industry and tourism sectors. These large ports play an important role as inter-island transportation hubs, increasing mobility for both trade and personal travel. Second, investment in port infrastructure development, as seen at the ports of Benoa and Makassar, increases capacity and efficiency, allowing these ports to accommodate more ships and passengers. In addition, tourism attractions also play a large role, with ports in Bali and East Nusa Tenggara experiencing a surge in passengers due to high international tourist arrivals. Connectivity between ports also contributes to accelerating passenger growth, as it facilitates travel between regions by more efficient sea vessels. Finally, the increase in the fleet of ships serving these routes also supports greater carrying capacity, facilitating an increase in the number of passengers that can be served by the port.
The practical implications of these findings are highly relevant for policymakers, port managers, and maritime transport operators. Predictions of passenger growth can be used as a basis for strategic planning for the development of port infrastructure, including the expansion of passenger terminals, improvement of supporting facilities, and integration of land and sea transportation systems. The government can utilize this information to formulate policies that support efficient public mobility, including increasing accessibility to ports and strengthening connectivity between regions. On the other hand, shipping operators can optimally adjust the frequency and capacity of ship services to anticipate spikes in demand, thereby avoiding capacity constraints during peak seasons.
Theoretically, this study contributes to the literature on maritime transport demand modeling by applying a time series approach and CAGR in projecting passenger growth. This approach does not only strengthen the understanding of passenger mobility patterns but also emphasizes the importance of utilizing historical data in supporting evidence-based decision-making. These findings can be a reference for the development of a more comprehensive transport demand model, which considers external variables such as changes in policy, technology, and socio-economic dynamics.
Based on the results of the analysis of estimated passenger growth in several ports, here are some recommendations that can be submitted:
Given the significant growth in passenger numbers, the government and related parties need to invest in developing port infrastructure. This includes expanding passenger terminals, improving parking facilities, and providing better transportation access to accommodate the surge in passenger numbers [32].
Port managers must consider increasing the frequency and capacity of transportation services, such as ferries or fast boat services, to meet the increasing needs of passengers. This also includes providing more flexible schedules and better services for passengers [33].
In developing ports, it is essential to adopt the principles of sustainable development. This includes considering the environmental impacts of port development and operations, as well as implementing environmentally friendly technologies [34].
The port can become a tourist gateway with the increasing number of passengers. Therefore, it is crucial to increase tourism promotion and tourism experiences around the port to attract more visitors and increase the regional economic contribution [35].
Developing an effective monitoring and evaluation system to assess the impact of passenger growth and the effectiveness of implemented initiatives will help in making data-driven decisions for continuous improvement.
This study successfully develops a distribution model of passenger growth in the Eastern Indonesia region, which is very essential considering the region's geographical and demographic characteristics.
The analysis of secondary data from BPS, PT. PELNI and Kementerian Perhubungan RI, over the past five years, has shown a significant increase in the number of passengers, specifically in major ports such as Surabaya, Benoa, Kupang, Makassar, and Ambon, with an average annual growth of 15-17%.
Factors contributing to this growth include increasing numbers of tourists, regional economic development, and improving sea transportation connectivity. Although ports in the region are experiencing passenger growth, infrastructure challenges and access to remote islands remain obstacles that must be overcome.
The limitations of this study include the use of historical data from 2017-2021 with the CAGR method, which does not take into account short-term fluctuations due to external factors, such as policies, the economy, or natural disasters. The analysis also only focuses on the number of passengers without considering other variables, such as ticket prices, land transportation connectivity, and preferences for alternative transportation modes. In addition, the limited detailed data, such as travel destinations and passenger demographics, can affect the accuracy of the predictions. Climate change and digitalization factors have also not been analyzed in the context of maritime transportation operations.
For future research, there are several areas that can be explored further. One is the analysis of the impact of climate change on maritime transport operations, including potential disruptions due to extreme weather and sea level rise. In addition, the role of digitalization in improving the efficiency of port services, such as the implementation of smart ports, automation of loading and unloading processes, and integration of cross-modal information systems, are also relevant areas to study. Further studies on the socio-economic impacts of increased passenger mobility, as well as scenarios for changes in transport policy, can also provide more comprehensive insights in supporting the development of a sustainable maritime transport sector.
This research is supported by the Indonesia Endowment Fund for Education (LPDP), the Ministry of Finance of the Republic of Indonesia under the Scholarship Recipient Decree number 0003941/TRP/D/AF-2021.
|
B |
regression coefficient |
|
Y |
dependent variable |
|
X |
independent variables |
|
n |
number of years |
|
Greek symbols |
|
|
$\alpha$ |
intercept |
|
ϵ |
error term |
[1] Ramstedt, L., Törnquist Krasemann, J., Davidsson, P. (2017). Movement of people and goods. In: Edmonds, B., Meyer, R. (eds) Simulating Social Complexity. Understanding Complex Systems. Springer, Cham. https://doi.org/10.1007/978-3-319-66948-9_26
[2] Jelti, F., Allouhi, A., Tabet Aoul, K.A. (2023). Transition paths towards a sustainable transportation system: A literature review. Sustainability, 15(21): 15457. https://doi.org/10.3390/su152115457
[3] Iqbal, L.M., Tsilimigkas, G., Kizos, T. (2024). Decoding the image of island urban sprawl: Insights from the Indonesian archipelago. Planning Practice & Research, 39(4): 636-664. https://doi.org/10.1080/02697459.2024.2342756
[4] Cribb, R.B., Ford, M. (Eds.). (2009). Indonesia Beyond the Water's Edge: Managing an Archipelagic State. Institute of Southeast Asian Studies Publishing.
[5] Pambudi, M.A.L., Handayani, T. (2023). Application of sea toll as a means to maintain the availability of goods in the 3T Area (Lagging, Frontier and Outermost). Maritime Park: Journal of Maritime Technology and Society, 2(2): 37-45. https://doi.org/10.62012/mp.v2i2.26360
[6] Krile, S., Maiorov, N. (2021). Infrastructure changes of the sea passenger port based on a digital transport model. Transport Problems, 16(4): 207-216. https://doi.org/10.21307/TP-2021-072
[7] Bernacki, D., Lis, C. (2021). Investigating the sustainable impact of seaport infrastructure provision on maritime component of supply chain. Energies, 14(12): 3519. https://doi.org/10.3390/en14123519
[8] Haustein, S., Siren, A., Framke, E., Bell, D., Pokriefke, E., Alauzet, A., Marin-Lamellet, C., Armoogum, J., O'Neill, D. (2013). Demographic change and transport (Doctoral dissertation, DTU; TRL; IFSTTAR; UVEG; VTI; CDV), 94: hal-00867029f. https://hal.science/hal-00867029.
[9] Amin, C., Mulyati, H., Anggraini, E., Kusumastanto, T. (2021). Impact of maritime logistics on archipelagic economic development in eastern Indonesia. The Asian Journal of Shipping and Logistics, 37(2): 157-164. https://doi.org/10.1016/j.ajsl.2021.01.004
[10] Zachariah, R.A., Sharma, S., Kumar, V. (2023). Systematic review of passenger demand forecasting in aviation industry. Multimedia Tools and Applications, 82(30): 46483-46519. https://doi.org/10.1007/s11042-023-15552-1
[11] Duffield, C., Hui, F.K.P, Wilson, S. (eds). (2019). Infrastructure Investment in Indonesia: A Focus on Port. Open Book Publishers. https://doi.org/10.11647/OBP.0189
[12] Baran, K., Neumann, T. (2023). A comparative analysis of seaports in terms of the development of maritime tourism in the area of the Baltic Sea. Water, 15(21): 3721. https://doi.org/10.3390/w15213721
[13] Wibowo, T.A., Hamzah, M.Z. Sofilda, E. (2024). Economic impacts of port development on coastal communities: A vocational education perspective. International Journal of Economics, Management and Accounting, 1(3): 128-138. https://doi.org/10.61132/ijema.v1i3.159
[14] Jugović, A., Komadina, N., Perić Hadžić, A. (2015). Factors influencing the formation of freight rates on maritime shipping markets. Pomorstvo, 29(1): 23-29. https://hrcak.srce.hr/140203.
[15] Fratila, A., Gavril, I.A., Nita, S.C., Hrebenciuc, A. (2021). The importance of maritime transport for economic growth in the European Union: A panel data analysis. Sustainability, 13(14): 7961. https://doi.org/10.3390/su13147961
[16] Musadi, M., Kurniawati, I. (2023). Normal distribution approximation through binomial and poisson distribution. Journal of Mathematics and Mathematics Education, 13(1): 108-122. https://doi.org/10.20961/jmme.v13i1.75051
[17] Frey, B.B. (2018). Normal distribution. In: The SAGE Encyclopedia of Educational Research, Measurement, and Evaluation. Thousand Oaks: SAGE Publications, Inc. https://doi.org/10.4135/9781506326139.n476
[18] Benzon, B. (2021). The normal distribution, an epistemological view. ST Open, 2: 1-16. https://doi.org/10.48188/so.2.6
[19] de la Rubia, M. (2024). J. Lognormal distribution for social researchers: A probability classic. International Journal of Psychology and Counselling, 16(2): 10-25. https://doi.org/10.5897/IJPC2024.0702
[20] Singh, G., Mantri, A., Sharma, O., Kaur, R. (2021). Virtual reality learning environment for enhancing electronics engineering laboratory experience. Computer Applications in Engineering Education, 29(1): 229-243. https://doi.org/10.1002/cae.22333
[21] Zhao, J., Zhang, F., Zhao, C., Wu, G., Wang, H., Cao, X. (2020). The properties and application of poisson distribution. Journal of Physics: Conference Series, 1550(3): 032109. https://doi.org/10.1088/1742-6596/1550/3/032109
[22] Wilcox, R. (2019). Logistic regression: An inferential method for identifying the best predictors. Journal of Modern Applied Statistical Methods, 17(2): eP3061. https://dx.doi.org/10.22237/jmasm/1551906905
[23] Mondal, S., Mondal, H., Panda, R. (2022). How to conduct inferential statistics online (Part 2): A brief hands-on guide for biomedical researchers. Indian Journal of Vascular and Endovascular Surgery, 9(1): 63-69. https://doi.org/10.4103/ijves.ijves_130_21
[24] Starbuck, C. (2023). The Fundamentals of People Analytics: With Applications in R. St. Louis: Springer. https://doi.org/10.1007/978-3-031-28674-2
[25] Schneider, A., Hommel, G., Blettner, M. (2010). Linear regression analysis: Part 14 of a series on evaluation of scientific publications. Deutsches Ärzteblatt International, 107(44): 776-782. https://doi.org/10.3238/arztebl.2010.0776
[26] Maulud, D., Abdulazeez, A.M. (2020). A review on linear regression comprehensive in machine learning. Journal of Applied Science and Technology Trends, 1(2): 140-147. https://doi.org/10.38094/jastt1457
[27] Rosenthal, S. (2017). Regression analysis, linear. The International Encyclopedia of Communication Research Methods, 1-15. https://doi.org/10.1002/9781118901731.iecrm0208
[28] Mwale, M., Luke, R., Pisa, N. (2022). Factors that affect travel behaviour in developing cities: A methodological review. Transportation Research Interdisciplinary Perspectives, 16: 100683. https://doi.org/10.1016/j.trip.2022.100683
[29] Mokhtarian, P.L., Salomon, I., Redmond, L.S. (2001). Understanding the demand for travel: It's not purely 'derived'. Innovation: The European Journal of Social Science Research, 14(4): 355-380. https://doi.org/10.1080/13511610120106147
[30] Jakovljević, M., Vertlberg, J.L., Šoštarić, M., Ševrović, M. (2025). Determination of factors influencing road transport demand: Evidence from Croatia. Applied Sciences, 15(4): 2238. https://doi.org/10.3390/app15042238
[31] Munim, Z.H., Schramm, H.J. (2018). The impacts of port infrastructure and logistics performance on economic growth: The mediating role of seaborne trade. Journal of Shipping and Trade, 3(1): 1-19. https://doi.org/10.1186/s41072-018-0027-0
[32] Zen, F., Yudhistira, M.H. (2022). Maritime highway and eastern Indonesia development. ERIA Research Project Report 2021, No. 24. Joint Study by ERIA, Ministry of Transport and LPEM, University of Indonesia.
[33] Mathisen, T.A., Solvoll, G. (2010). Service quality aspects in ferry passenger transport – Examples from Norway. European Journal of Transport and Infrastructure Research, 10(2): 142-157. https://doi.org/10.18757/ejtir.2010.10.2.2879
[34] Hossain, T., Adams, M., Walker, T.R. (2021). Role of sustainability in global seaports. Ocean & Coastal Management, 202: 105435. https://doi.org/10.1016/j.ocecoaman.2020.105435
[35] Apriyanti, M.E., Sumaryoto, Meirinaldi. (2024). The importance of tourism infrastructure in increasing domestic and international tourism. International Journal of Research in Vocational Studies, 3(4): 113-122. https://doi.org/10.53893/ijrvocas.v3i4.46