Jamal S. Makki*![]() | Ahmed A. Dakheel
| Ahmed A. Dakheel![]() | Basim M. Al-Zaidi
| Basim M. Al-Zaidi![]()
© 2025 The authors. This article is published by IIETA and is licensed under the CC BY 4.0 license (http://creativecommons.org/licenses/by/4.0/).
OPEN ACCESS
Sediment deposition upstream of hydraulic structures such as weirs is a particular problem in fluvial rivers that has to be adequately managed. In this work, a new technique was proposed for flushing out sediment downstream of weirs and hydraulically removing the flow using a jet of compressed air in the channel floor close to the structure where excessive sediment is deposited. A flume experiment was used to simulate the flow properties and sediment transport in a low-slope sand bed river that ended with a weir downstream. Three scenarios for water discharge and sediment rate were proposed based on the available field data. In each scenario, the sediment feed rate varied with the proposed water discharge. For each case in the experiment runs, two air feeding scenarios were considered: one with no air feed; and the other with air feeding. The sediment concentration was measured downstream of the weir for each scenario. Further, in each case, the change in sediment rate downstream of the weir was measured over time. The results of the study showed that for a given amount of water discharge, the rate of flushed sediment decreases with time. The amount of the flushed sediment dropped by 60% during the test’s second time increment, and more than 30% during the final time increment. The results also showed that the variation in the amount of flushed sediment reduced with time for all studied cases of water discharge and sediment feeding rate, the variation which was dependent on the operation of the pressurized air technique used for the upstream boundary conditions. The operation of each of the scenarios does not require the flow regime and sediment properties in the system to be changed, and this makes this technique more suitable for safe use in water resource management. Therefore, the proposed method is essential and sustainable for determining sediment removal efficiency in reservoirs upstream of hydraulic structures, and sediment management in reservoirs themselves.
flushing, sediment, weirs, pressurized air
Controlling rivers using hydraulic structures such as dams and weirs significantly changes the flow and sediment regime in many rivers worldwide. In circumstances where sediment is deposited upstream of such structures, this can reduce storage capacity, which in turn can reduce the lifespan of the reservoir created by such structures and the time before their consequent failure. Moreover, reducing the amount of sediment downstream can lead to erosion in the stream downstream of the dam, coastal erosion, habitat deterioration, contamination, loss of wetlands, and ultimately changes to the environment of the aquatic ecosystem [1-3]. Degradation below dams has also had a significant impact on river structures downstream of the dam [4]. As soon as the sediment fills the pool upstream of the barrages, degradation will begin downstream [5]. One of the most striking failures due to degradation was that of the Islam weir in the Sutlej River, India, which was used as a diversion structure for the canal associated with an irrigation project. The bed downstream of the barrage dropped about 2 m, and the water level in the river lowered 1.2m below the floor of the structure. This drop resulted in enormous scouring at the base of the structure, leading ultimately to its collapse [6]. A typical example of the degradation below dams is the erosion of the Nile riverbed at Isna Barrage 167 km downstream of the High Aswan Dam [7]. Thus, the transport of sediment downstream of the structure can help to prevent, or indeed even control, all such problems that result from the construction of hydraulic structures, and then create natural riverine conditions.
Several strategies have been presented to control sedimentation in reservoirs and manage sediment transport, such as dredging, bypassing, sluicing, flushing, and sediment trapping behind structures [8-11]. Sediment flushing is an essential means of preserving the storage capacity of dam reservoirs, and takes the forms of either pressure flushing or free-flow flushing. Thus, many experimental works have also reported on the sediment flushing method, various measurement methods have been performed to provide sediment data, and several studies have already investigated pressure flushing techniques at reservoirs [12-15]. The first known use of the flushing sediment technique was in the 16th century, in Spain [16]. In a study presented by Lai and Shen [17] about flushing sediment through reservoirs, it was reported that the flushing method is an efficient way to remove sedimentation, reduce reservoir sedimentation, and increase a reservoir's useful life, not only for small reservoirs but also for large, and indeed that applying flushing methods over the long term can significantly reduce the amount of sediment deposits [17]. Dreyer et al. [18] conducted a series of experiments on sediment flushing using bottom outlets, the purpose of which was to protect the hydropower intake, where a flushing outlet placed below the hydropower intake can be used to scour out deposited sediment under pressure. The study concluded that this represents a suitable approach to sediment management via the periodic removal of sediment upstream of hydropower facilities. Xu and Cao [19] presented an experimental study to investigate flushing sediment in a reservoir using a tunnel at the reservoir bottom. Their study found that the flushing sediment process is affected by the type of sediment, where non-cohesive sediment is easier to flush than cohesive, which they attributed to the impaction of seepage on cohesive sediment. The study estimated the change in sediment position around the tunnel with time using an empirical model. Emangholizadeh et al. [20] conducted an experimental study on a method of flushing sediment that uses the pressure technique, noting that the flushing of sediment results in an increase in the discharge from the outlet by lowering the level of the reservoir while still maintaining the bottom outlet system at reservoir capacity. Moreover, the efficiency of the method used increased for fine sediment under otherwise identical flow conditions.
An efficient method for reservoir sediment management is commonly used in Japan using hydropiper sediment removal technology, in which sediment is degraded from the dam reservoir and transported downstream, below the dam, without reduction in the reservoir water level. Also, in Egypt, for the High Aswan Dam reservoir, the application of the method of flushing sediment used for the Xiaolangdi Reservoir on the Yellow River, China, that of density flow formulation to flush the sediment downstream, has been recommended [21]. For large-scale applications, Al-Zaidi [22] proposed a numerical model that provided a method to restore the Nile River, Egypt, and the Nile Delta by mining the sediment via dredging from Lake Nassir upstream of the High Aswan Dam, requiring the use of a slurry pipeline over a distance of more than 600 km. The study results showed that the erosion downstream of the dam was controlled and the river began to be restored after a short period; it also showed that the erosion in the Nile Delta could be eliminated and controlled, and further that the ecosystem in the river and delta could be restored.
The pressure flushing technique was experimentally studied by Shahmirzadi et al. [23] in reservoir storages to take sediment off intakes. The study experimentally investigated the impact of the area of the bottom outlet on the size of the cone of flushed sediment. The study also estimated the volume of sediment removed from a reservoir during pressure flushing, noting that the size of the flushing cone depended on the size of the bottom outlet. White and Bettess [24] studied the relation between water depth in the reservoir and discharge released according to the scour range to predict the impact of releases on the sediment deposits. They illustrated the relationship between these factors, showing that for a given discharge the scouring cone increases with decreasing water height in the reservoir. Fathi-Moghadam et al. [25] also analyzed the parameters that affected the scour, such as the water depth above the orifice and outlet flow velocity, when examining the pressurized flushing of non-cohesive sediment. Laksitaningtyas et al. [26] presented an experimental work on reservoir sediment flushing using a system of tanks and a simple pipeline. The sediment deposited in the reservoir was flushed using a bottom outlet with a hole controlled by a valve. The valve was working a sluice gate that could be operated manually. The results showed that the sediment needs to be flushed to maintain a stable water depth in the reservoir, operation of sluice gates, and the generating of scour cones in the sediment. Petkovsek et al. [27] reviewed the limitations of sediment flushing techniques in reservoirs. The study stated that seven factors improve reservoir sustainability: water availability, sediment properties, cost, reservoir geometry, control operation, and downstream impacts of flushing. Mahmood [28] reported several criteria through which to ensure the efficiency and effectiveness of the sediment flushing technique. The study indicated that these strategies can only be achieved after the reservoir has been emptied, however, and thus cannot be applied to read flushing performance. Atkinson [29] also reported the feasibility of applying sediment-flushing techniques in reservoirs. The study provided recommendations for using the sediment flushing technique from reservoirs, stating that to ensure effective flushing, the quantity of sediment removed during operation must at least equal the amount of sediment deposited in the reservoir in the interval between flushing operations. Moreover, the useful storage capacity of the reservoir can be maintained at a level greater than 50% of the original capacity. The method was applied to fourteen reservoirs, where 43% provided the 50% capacity criterion, while the remaining 57% provided less than 30% of the original capacity. This led to the conclusion that the used method could be flushed effectively based on the reservoir and conditions. Bottom outlets under pressure flushing conditions are a proven technique for removing deposition in dam reservoirs. An experimental installation was employed by Paulo et al. [30] to assess the operation of the sediment flushing method using a new type of structure. The effectiveness of the method depends on flow properties, sediment characteristics, and the variation of the structure diameter. The study stated that to avoid clogging the system and to allow for deposit consolidation, the structure needs to be operated and regulated using larger hydraulic heads. Beyvazpour et al. [31] investigated the efficiency of pressurized flushing using a single pile case and a set of different shapes installed close to the orifice in different locations upstream. Their results demonstrated that the method is more efficient when the piles were installed at some minimum distance from the orifice, and by increasing the output discharge the flushing cone increased in volume. In recent years, a focus on issues related to the sediment flushing upstream of weirs has been increasing as this avoids certain hydraulic challenges since the discharge capacity decreases due to the rise of the riverbed, e.g., a study provided by Zulfan et al. [32] to discuss the effects of operating three sluice gates of the Bekasi Weir to flush deposited sediments. The study simulated an approach to one of the more straightforward ways of sediment flushing, that is, by using a sluice gate. It was found that without any manual excavation, the flushing method with one fully opened gate was the best solution due to the resultant significant upstream bed degradation and its ability to maintain the upstream and downstream water levels. In conclusion, this method requires that the sluice gate be fully open and that in the absence of sediment bypass or pass-through structures (e.g. flushing gates), this method is not suitable for all cases of flow conditions in rivers.
Impeding the movement of sediment by control structures such as weirs has specific challenges associated with the sediment deposition upstream of the structures, these challenges have distributed over several aspects take the forefront in consideration of adverse effects of construction of hydraulic structures on rivers such river morphology and hydrology, hydraulic features, habitat, contamination, wetland, and the environment. River managers have proposed several methods to mitigate the problem, but the degree of that response has not been established. As may be noticed, in the majority of studies reviewed, the methods presented for removing upstream sediment structures are not effective in flushing sediment, as these methods do not work properly if excess sediment is deposited, and in any case are not widely practiced since they require large amounts of water to pass through the structure, to the point of even emptying the reservoir. The present study aims to cover the research gap in solving the problem. Therefore, the purpose of this work is to propose a new technique to remove existing sediment upstream of hydraulic structures, such as weirs, without changing the flow regime and properties and sediment characteristics and then keep the hydraulic structure free from sediment without emptying their reservoir. To achieve this, a simulation using an experimental flume with a weir downstream is presented. Moreover, one of the intended purposes of this work is that the new method would not affect the flow regime and sediment properties in aquatic ecosystems and would allow for good management of water resources.
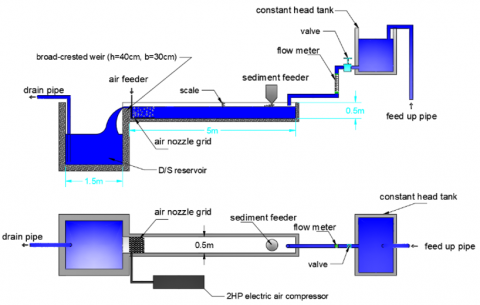
All the experiments were performed in a flume constructed for the purposes of the present study. The experimental installation, as shown in Figure 1, is a rectangular flume constructed from a brick material. The inside surfaces of the channel are finished with a cement layer to reduce the roughness height (i.e., neat surface with n about 0.011). The flume is designed to be 0.5 m wide, 0.5 m deep, and 5 m long. The flume experiments were guided by field measurements conducted at rivers with low-slope sand bed streams in the southern region of Iraq. Thus, the design slope of the channel is 0.01. A weir of broad crest type was placed at the downstream end of the flume. The weir dimensions are as follows: height of 0.4 m, crest width of 0.2 m with an upstream and downstream rounded edge. The reason for using this type of weir in these experiments was that it has an almost horizontal long (broad) crest in the direction of the flow [33]. Thus, this resulted in parallel streamlines to the crest invert and great hydrostatic pressure distribution above the crest. Moreover, the rationale behind the selection of the broad-crested weir and its relevance to real-world scenarios is this kind of weir has several advantages such as flexible in design to fit with the channel cross-section and it works properly with a wide range of changes in flow measurements (i.e., flow and head). Thus, it is widely used as flood control reservoirs and as measuring structures [34].
Clear water was used in all experiments and the flow was steady, turbulent, and subcritical. The inflow to the flume was maintained using a constant head reservoir upstream. The discharge was measured using a fitted flowmeter with an accuracy of ±4%, installed at the inlet pipe to the canal that outlet from the reservoir. The accuracy of the flowmeter was verified by calculating the volume of the flow for a set time for five different discharges. The sediment was fed upstream using a sediment feeder sited at the upstream end to ensure a well-mixed current upstream. The sediment feeder was calibrated at the Engineering Consultant Bureau's lab building at the University of Thi-Qar, and this was achieved by measuring the average rate of sediment (i.e., sediment weight with time) for each selected opening size of the hose during the operation of the sediment feeder.
The volume of water discharge was controlled using a gate valve installed on the inlet pipe (see Figure 1). The water depth was measured at different locations along the flume using a measuring scale attached to the inside wall of the channel. The air was fed through a perforated (holed/slotted) mesh of suitable distribution on the flume floor close to the weir using a 2HP electric air compressor. The diameter of the holes in the mesh was 1.5mm and spanned an area of 10mm by 10mm. The mesh extended for a sufficient distance upstream of the weir where sediment was deposited excessively to ensure coverage of the majority of the sediment deposited in the structure reservoir (see Figure 2). The flushed sediment was then collected in the trapping reservoir downstream, and the collected sediment was dried for later use in another experiment. The samples collected during the experiments were tested based on methods provided in the previous study [35] to determine sediment concentration data. The experiments were conducted at the Hydraulic Experimental Laboratory of Engineering Consulting Bureau E.C.B Building at the University of Thi-Qar.
Figure 1. Experimental setup
Figure 2. Snapshot of air nozzle grid and electric air compressor
With the bottom of the flume closed downstream by the weir, the water was discharged through the flume until it reached a certain level, slightly higher than the weir crest, and started flowing to the outlet tank. The conditions downstream of the weir are non-submerged. This boundary condition downstream of the water level was required to initiate the experiment. Then, the inflow was adjusted properly, and the inflow restarted, but this time with the intended discharge for the experiment, which resulted in the water reaching the intended level. The flow was assumed to be uniform, where the water depth was deemed stable along the channel. The upstream and downstream boundary conditions were the water discharge and sediment feeding rate. Steady-state was thus accomplished, and the final measures of discharge and water level were taken following the upstream boundary conditions provided.
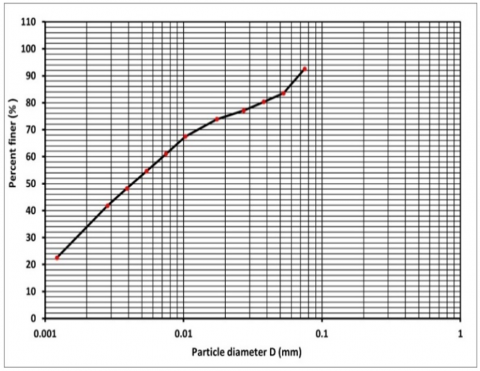
The sediment used in the experiments was a mixture of 38% silt, 8% sand, and 54% clay, with grain sizes ranging between 0.00122 and 0.075 mm. The median diameter, D50, was 4.1 μm, and the D90 was 73 μm (see Figure 3). The sediment was mined from the Main Outfall Drain MOD at Thi-Qar Governorate, located in the southern region of Iraq, the density of which was 2650 kg/m3.
Figure 3. Grain size distribution of the sediment used in the experiments
Figure 4. Snapshot of the air feeding upstream the weir
Table 1. Summary of the conditions used for each of the experiments
|
Experiment No. |
Discharge (L/min) |
Area (m2) |
Sediment Discharge (gm/sec) |
Air Scenario |
|
1A |
15 |
0.1245 |
1666 |
No Feed |
|
1B |
15 |
0.1245 |
1666 |
Feed |
|
2A |
15 |
0.1245 |
833 |
No Feed |
|
2B |
15 |
0.1245 |
833 |
Feed |
|
3A |
22 |
0.130 |
1666 |
No Feed |
|
3B |
22 |
0.130 |
1666 |
Feed |
|
4A |
22 |
0.130 |
833 |
No Feed |
|
4B |
22 |
0.130 |
833 |
Feed |
|
5A |
28 |
0.1325 |
1666 |
No Feed |
|
5B |
28 |
0.1325 |
1666 |
Feed |
|
6A |
28 |
0.1325 |
833 |
No Feed |
|
6B |
28 |
0.1325 |
833 |
Feed |
Sediment was fed to the upstream end of the flume using a sediment feeder with adjustable speed, which can thus feed material at a specified rate. The experimental procedure also required measuring the rate at which the sediment passed the weir. The rate of sediment discharge was measured downstream in two scenarios: without air feeding (no feed); and with air feeding. Table 1 summarizes the various experiments conducted, where the sediment feed rate was reduced to half for each experiment and, thus, in total, twelve runs were performed. For simplification, the effects of water temperature on sedimentation during the experiment were neglected, and the head losses were due to minor losses in the inlet pipe (i.e., short length). To run the experiment, three discharge rates were considered: 15 L/min, 22 L/min, and 28 L/min. For each water discharge rate, the sediment was fed in at either 1666 gm/sec or 833 gm/sec. Similarly, for each discharge and sediment rate, two conditions were applied with and without air feeding. For simplification, also side wall and vortex current effects that might have occurred during the air-feeding process were neglected.
The flow washes the sediment up from the flume, i.e., in this technique, the deposited sediment is hydraulically removed by the provided flow. Also, it is important to note that when the sediment particles start to move, the flow conditions correspond to the initiation of motion. If the flow rate increases, more sediment particles will be moving. For each experimental run necessary to ensure that the sediment moved by the effect of the air jet, not due to the water discharge only (Figure 4). Therefore, it is essential in this experiment that the conditions of initiate sediment motion were tested. Thus, in the experimental run, the sediment before and after feeding the air was measured. Also, the change in concentration of the flushed sediment was measured over time for each proposed experimental scenario.
Two scenarios were considered in the experiments (see Table 1): in scenario A, the air was not fed; in scenario B, air was fed into the system. The provided scenarios were applied for each experimental run with the same applied pressure from the compressor, i.e., the energy of the air supplied to the system was approximately constant since all slots were equally spaced in the mesh and had the same geometry (see Figure 1). There were six different cases for the runs that made up the entirety of the experimental work. The cases differed according to the water discharge and sediment input rates. For the water discharge, three rates were proposed, 15 L/min, 22 L/min, and 28 L/min. For each water discharge rate, sediment was fed in at two rates of 1666 gm/sec and 833 gm/sec. The data collected was represented according to the measurement of the sediment rate downstream, i.e., at the nappe of the weir. These measurements were taken every minute.
Figure 5. The sediment flushed with water discharge after 1 min for a sediment rate of 1666 gm/sec
Figure 6. The sediment flushed with water discharge after 2 min for a sediment rate of 1666 gm/sec
Figure 7. The sediment flushed with water discharge after 3min for a sediment rate of 1666 gm/sec
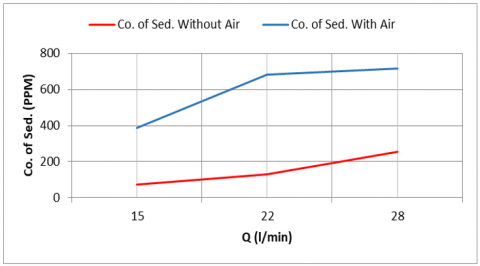
Figures 5 to 7 show the results of the experiments for the case of a sediment feed rate of 1666 gm/cm with time, where the results for 1min, 2min, and 3 min are shown, respectively, in Figures 3, 4, and 5. The blue line represents the measured sediment (concentration of sediment Co. of Sed.) in ppm in the case of no air being fed, whilst the red line indicates the concentration of the measured sediment in the case of air being fed. The results clearly showed that for a given volume of water discharge, the rate of flushed sediment decreased with time. This indicates the new technique is highly efficient at removing sediment, where the amount of the flushed sediment dropped by ~60% during the second minute and more than ~30% during the final minute. The concentration of sediment for the no-air scenario was proposed to vary with the water discharge rate and constant with time. It was shown that the higher flushing range occurred during the first minute, the results for which indicated that the variation in the flushed sediment was high at the beginning time of the run and then decreased with time, which was attributed to the decrease in the amount of sediment deposited behind the weir with time. If the increase in water discharge reached 87%, the amount of sediment flushed from the system could increase by 1.3-fold compared to the beginning of the time (i.e., after one minute) compared to when the flushing mode was initiated. This variation changed with flow values for the rest of the measured time.
Figure 8. The sediment flushed with water discharge after 1min for a sediment rate of 833 gm/sec
Figure 9. The sediment flushed with water discharge after 2min for a sediment rate of 833 gm/sec
During the second set of experimental runs, the sediment feed rate was reduced by 50% in the upstream boundary conditions. The reason for introducing this variation was to reduce the deposition in the channel for the case of low sediment feed and then to check the feasibility of the sediment flushing technique since known that erosion increases with increasing discharge. Figures 8, 9, and 10 represent the experimental results for the case of the sediment feed of 833gm/sec. The results also show the time in three steps, 1, 2, and 3mins. The red line represents the results for the no air feed scenario, whilst the blue line indicates the results for the air feed scenario. The results indicated that the rate at which sediment was flushed changed greatly with discharge, showing no certain trend; this indicates that the technique is efficient even with the low rate of water discharge. In contrast, the results for the no-air scenario followed the same trend as that provided during the first set of experiments, but in this instance, the sediment feed rate dropped according to the upstream boundary conditions.
Figure 10. The sediment flushed with water discharge after 3min for a sediment rate of 833 gm/sec
Figure 11. The average sediment flushed with water discharge over time for a sediment rate of 1666 gm/sec
Figure 12. The average sediment flushed with water discharge over time for a sediment rate of 833 gm/sec
To ensure the reasonable operation of the proposed technique, it is necessary to estimate the quantity of sediment flushed using average values, thus the results are also presented in terms of the average amount of sediment flushed over time. Figures 11 and 12 show the results for an average amount of sediment flushed over time for the two sediment feed rates (1666 and 833 gm/sec). The red line represents the no air feed scenario, while the blue line is for the air feed scenario. These averages also indicated that the rate at which sediment was flushed followed the same trend as the discharge. The amount of sediment flushed increased with the upstream sediment feed rate based on the upstream boundary conditions applied in the experiments.
Figures 13 and 14 show the variation with time of the flushed sediment, ΔQs, for the two cases of sediment feed rates. It was found that the variation in the amount of sediment flushed reduced with time for all the studied cases of discharge and sediment feeding. In particular, as a comparison with the water discharge, it was observed that the variation in flushed sediment was high and varied considerably with time in the case of a high change in discharge. The variation in the amount of sediment flushed changed dramatically with time for both sediment feed rates, though with different trends. For the high rate of discharge, the rate at which sediment was flushed changed only slightly with time in the case of the high sediment feed rate; for the low sediment feed rate, the variation in sediment flushed increased with increasing water discharge. These findings were in agreement with the principle of sediment transport balance and theory, where more sediment deposits with a low rate of water discharge with the same amount of sediment. Thus, in this experiment, more sediment has to be flushed with a low water flow rate at a given sediment feed rate. This criterion is dependent on the upstream boundary conditions during the experimental runs.
The flushed sediment in the flow at each run of the experiments was close to the threshold value (proposed level), i.e., there is no long time required for processing to get on the threshold values of the flushed sediment in the flow. Nevertheless, the threshold conditions required for sediment flushing were not taken into account since the technique is efficient at its removal. The study indicated that the proposed technique for flushing sediment is effective since there was no change in flow conditions. This was in agreement with a previous study [33].
Figure 13. The change in sediment flushed with time for the case of a sediment feed rate of 1666 gm/cm
The success of the proposed technique can be improved by simulating a large-scale channel (i.e., world real-world applications) with a wide range of flow initial conditions and sediment rates and using different capacities of air compressors to avoid the static pressure of large water depth in the reservoir. Moreover, the characteristics of the used sediment are similar in properties to those in rivers in the real world.
Figure 14. The change in sediment flushed with time for the case of the sediment feed rate of 833gm/cm
To minimize the environmental impacts of the pressurized air technique and any adverse consequences, such as the effects on aquatic organisms, water quality, and downstream sediment transport. The proposed method suggests to use of clear air filled with Oxgene to prevent reducing the water quality in the reservoir. For sediment transport, it is recommended to measure the sediment rate downstream to get the same rate of sediment as that on the river upstream from the reservoir, i.e., the same sediment rate that was transported in the river in pre-weir conditions. This gives the proposed method rationale for using and implementing real-world applications.
In this study, a new technique that can remove the sediment deposited upstream of a weir was proposed and implemented. The proposed technique of flushing sediment involved introducing a jet of pressurized air into the bed of the flume using a well-distributed mesh hole, which takes place close to the weir where the majority of the sediment is deposited. Several water discharge and sediment feed rate scenarios were proposed to study the efficiency of the method. The flushed sediment was measured as a function of time downstream of the system, namely at the nappe of the weir.
The main findings of the study are as follows:
• The rate at which sediment was flushed decreased with time for a given rate of water discharge;
• The amount of the sediment flushed dropped by 60% during the second time increment, and by more than 30% during the final time increment;
• The variation in sediment flushed is initially quite high and then decreases with time. This can be attributed to the decrease in the amount of sediment deposited behind the weir with time due to flushing the sediment;
• The proposed method is efficient in supporting reservoir capacity and informing reservoir operation concerning rivers carrying fine sediment.
For further research and practical applications related to the study, it is recommended to propose a numerical model with several scenarios that can apply to any situation of flow and sediment rate with air feeding to prevent the accumulation of sediment upstream of the hydraulic structures.
The authors thank all personnel involved in the Engineering Consultant Bureau's lab at the University of Thi-Qar.
[1] Kondolf, G.M., Gao, Y., Annandale, G.W., Morris, G.L., Jiang, E., Zhang, J., Cao, Y., Carling, P., Fu, K., Guo, Q., Hotchkiss, R., Peteuil, C., Sumi, T., Wang, H.W., Wang, Z., Wei, Z., Wu, B., Wu, C., Yang, C.T. (2014). Sustainable sediment management in reservoirs and regulated rivers: Experiences from five continents. Earth's Future, 2(5): 256-280. https://doi.org/10.1002/2013EF000184
[2] Morris, G.L., Fan, J. (1998). Reservoir Sedimentation Handbook: Design and Management of Dams, Reservoirs, and Watersheds for Sustainable Use. McGraw-Hill: New York, NY, USA.
[3] Schleiss, A.J., Franca, M.J., Juez, C., De Cesare, G. (2016). Reservoir sedimentation. Journal of Hydraulic Research, 54(6): 595-614. https://doi.org/10.1080/00221686.2016.1225320
[4] Massoudi, H. (1981). Hydraulics of river bed degradation, Willow Creek, Iowa. Iowa State University.
[5] Galay, V.J. (1983). Causes of river bed degradation. Water Resources Research, 19(5): 1057-1090. https://doi.org/10.1029/WR019i005p01057
[6] Lane, E.W. (1934). Retrogression of levels in riverbeds below dams. Engineering News Record, 112(838): 1957.
[7] Al-Zaidi, B.M., Viparelli, E., Moussa, A. (2016). Preliminary morphodynamic results on the impact of the High Aswan Dam on the Nile River, Egypt. In the International Conference on Fluvial Hydraulics, pp. 1166-1174. https://doi.org/10.1201/9781315644479-185
[8] Isaac, N., Eldho, T.I. (2019). Sediment removal from run-of-the-river hydropower reservoirs by hydraulic flushing. International Journal of River Basin Management, 17(3): 389-402. https://doi.org/10.1080/15715124.2019.1583667
[9] Esmaeili, T., Sumi, T., Kantoush, S.A., Kubota, Y., Haun, S., Rüther, N. (2021). Numerical study of discharge adjustment effects on reservoir morphodynamics and flushing efficiency: An outlook for the Unazuki Reservoir, Japan. Water, 13(12): 1624. https://doi.org/10.3390/w13121624
[10] Haghjouei, H., Rahimpour, M., Qaderi, K., Kantoush, S.A. (2021). Experimental study on the effect of bottomless structure in front of a bottom outlet on a sediment flushing cone. International Journal of Sediment Research, 36(3): 335-347. https://doi.org/10.1016/j.ijsrc.2020.11.002
[11] Sumi, T., Kantoush, S.A. (2010). Integrated management of reservoir sediment routing by flushing, replenishing, and bypassing sediments in Japanese river basins. In Proceedings of the 8th International Symposium on Ecohydraulics, Seoul, Korea, pp. 12-16.
[12] Esmaeili, T., Sumi, T., Kantoush, S. (2014). Experimental and numerical study of flushing channel formation in shallow reservoirs. Journal of Japan Society of Civil Engineer, 70(4): I_19-I_24.
[13] Madadi, M.R., Rahimpour, M., Qaderi, K. (2016). Sediment flushing upstream of large orifices: An experimental study. Flow Measurement and Instrumentation, 52: 180-189. https://doi.org/10.1016/j.flowmeasinst.2016.10.007
[14] White, R. (2001). Review of sedimentation in reservoirs. Thomas Telford, London. http://doi.org/10.1680/eosfr.29538
[15] Brown, C.B. (1944). The control of reservoir silting. In Silting and Desilting of Reservoirs. Miscellaneous Publication. Washington, D.C.
[16] Liu, J., Minami, S., Otsuki, H., Liu, B., Ashida, K. (2004). Prediction of concerted sediment flushing. Journal of Hydraulic Engineering, 130(11): 1089-1096. https://doi.org/10.1061/(ASCE)0733-9429(2004)130:11(1089)
[17] Lai, J.S., Shen, H.W. (1996). Flushing sediment through reservoirs. Journal of Hydraulic Research, 34(2): 237-255. https://doi.org/10.1080/00221689609498499
[18] Dreyer, S., Basson, G. (2018). Investigation of the shape of low-level outlets at hydropower dams for local pressure flushing of sediments. In International Conference of Sustainable Dam Engineering in An Ever-Charging World.
[19] Xu, H., Cao, Z. (2024). Experimental study of reservoir flushing through a bottom tunnel initially covered by cohesive sediment. International Journal of Sediment Research, 39(3): 327-339. https://doi.org/10.1016/j.ijsrc.2024.03.004
[20] Emamgholizadeh, S., Bina, M., Fathi-Moghadam, M., Ghomeyshi, M. (2006). Investigation and evaluation of the pressure flushing through storage reservoir. ARPN Journal of Engineering and Applied Sciences, 1(4): 7-16.
[21] Abdel-Fadil, M. (2005). Sediment as a resource for development of Eastern Nile countries. International Water Management Institute. Conference Papers, No. h037506.
[22] Al-Zaidi, B.M.N. (2018). The restoration of the Nile River and its delta, Egypt. Numerical Modeling (Doctoral Dissertation, University of South Carolina). https://scholarcommons.sc.edu/etd/5003.
[23] Shahmirzadi, M.E.M., Dehghani, A.A., Sumi, T., Mosaedi, A., Meftahh, M. (2010). Experimental investigation of pressure flushing technique in reservoir storages. Water and Geoscience, 1: 132-137.
[24] White, W.R., Bettess, R. (1984). The feasibility of flushing sediments through reservoirs. IAHS-AISH Publication, (144): 577-587.
[25] Fathi-Moghadam, M., Emamgholizadeh, S., Bina, M., Ghomeshi, M. (2010). Physical modelling of pressure flushing for desilting of non-cohesive sediment. Journal of Hydraulic Research, 48(4): 509-514. https://doi.org/10.1080/00221686.2010.491691
[26] Laksitaningtyas, A.P., Legono, D., Jayadi, R. (2022). Preliminary experiment on reservoir sediment flushing. IOP Conference Series: Earth and Environmental Science, 1105(1): 012031. https://doi.org/10.1088/1755-1315/1105/1/012031
[27] Petkovšek, G., Roca, M., Kitamura, Y. (2020). Sediment flushing from reservoirs: A review. Dams and Reservoirs, 30(1): 12-21. https://doi.org.10.1680/jdare.20.00005
[28] Mahmood, K. (1987). Reservoir sedimentation: Impact, extent, and mitigation. Technical Paper (No. PB-88-113964/XAB; WORLD-BANK-TP-71). International Bank for Reconstruction and Development, Washington, DC (USA).
[29] Atkinson, E. (1996). The feasibility of flushing sediment from reservoirs.
[30] Paulo, F.A., Abreu, A.S., Prá, M.D., Endres, L.A.M., Ferla, R., Teixeira, E.D. (2021). Experimental study of pressure flushing of non-Cohesive sediment through slotted pipe bottom outlet. RBRH, 26: e01. https://doi.org/10.1590/2318-0331.262120200076
[31] Beyvazpour, A., Daryaee, M., Kashefipour, S.M. (2021). Improvement of pressurized flushing efficiency by installing a single pile upstream of the orifice. Ain Shams Engineering Journal, 12(1): 47-55. https://doi.org/10.1016/j.asej.2020.08.011
[32] Zulfan, J., Ginting, B.M., Hidayat, M.N. (2023). Effects of sluice gate operation on sediment flushing in Bekasi weir using a 1D numerical model. E3S Web of Conferences, 429: 02006. https://doi.org/10.1051/e3sconf/202342902006
[33] Powell, D.N., Khan, A.A. (2015). Flow field upstream of an orifice under fixed bed and equilibrium scour conditions. Journal of Hydraulic Engineering, 141(2): 04014076. https://doi.org/10.1061/(ASCE)HY.1943-7900.0000960
[34] Nouri, M., Sihag, P., Kisi, O., Hemmati, M., Shahid, S., Adnan, R.M. (2022). Prediction of the discharge coefficient in compound broad-crested-weir gate by supervised data mining techniques. Sustainability, 15(1): 433. https://doi.org/10.3390/su15010433
[35] ASTM Standard D3977‐97. (2013). Standard test methods for determining sediment concentration in water samples. No. D 3977-97, pp. 6.