Diaa Salman*![]() | Yonis Khalif Elmi
| Yonis Khalif Elmi![]() | Abdullahi Mohamed Isak
| Abdullahi Mohamed Isak![]() | Abdillahi Sheikh-Muse
| Abdillahi Sheikh-Muse![]()
© 2025 The authors. This article is published by IIETA and is licensed under the CC BY 4.0 license (http://creativecommons.org/licenses/by/4.0/).
OPEN ACCESS
Optimizing the performance of photovoltaic (PV) systems, which are a key component of renewable energy systems, is highly dependent on efficient maximum power point tracking (MPPT) algorithms, particularly under varying operating conditions such as fluctuating irradiance and temperature. This study contributes to the field by presenting a comprehensive comparative analysis of conventional, hybrid, and machine learning (ML)-based MPPT techniques, identifying their strengths, limitations, and suitability for enhancing PV performance. The evaluation was based on critical performance metrics, including maximum current Imax, maximum voltage Vmax, and maximum power Pmax. The results highlight the superiority of hybrid and ML-based methods over conventional approaches, demonstrating their ability to achieve greater optimization and efficiency. For example, the ANN-GA algorithm achieved the highest Pmax of 99.2186 W, showcasing the effectiveness of combining neural networks with evolutionary algorithms. Other hybrid methods, such as RF-PSO and ANN-GA-PSO, also demonstrated high levels of performance, successfully optimizing both current and voltage for improved power quality. These findings underscore the importance of selecting MPPT algorithms based on the specific operational requirements and characteristics of PV systems. The study also emphasizes the need for continued development and refinement of hybrid and ML-based MPPT techniques, as they have demonstrated exceptional potential for achieving optimal PV efficiency under diverse conditions. This work advances the understanding of MPPT algorithms and provides valuable insights for improving PV technology. By facilitating the transition to more effective and environmentally friendly energy systems, the findings contribute to global efforts toward sustainable energy solutions.
maximum power point tracking (MPPT), optimization, metaheuristic, machine learning, hybrid algorithms, photovoltaic systems
As the global demand for sustainable energy continues to rise, photovoltaic (PV) systems have become an essential element of renewable energy infrastructure. The performance of these systems is closely tied to the efficiency of maximum power point tracking (MPPT) algorithms, particularly in dynamic environmental conditions such as fluctuating irradiance and temperature. Although significant advancements have been made, a key gap persists in the development of hybrid MPPT algorithms that effectively combine machine learning (ML) techniques with metaheuristic approaches to overcome limitations like slow convergence and local optima. This study directly addresses this gap by evaluating novel combinations of algorithms under varying environmental conditions. This review aims to synthesize various studies exploring the application of conventional and hybrid machine learning (ML) approaches—including genetic algorithms (GAs), artificial neural networks (ANNs), and particle swarm optimization (PSO)—to improve MPPT in PV systems. By grouping the studies based on similar objectives, methods, and results, a clearer understanding of the advancements in MPPT optimization and solar energy forecasting can be achieved.
Several studies have investigated the use of artificial intelligence (AI) in the optimization of renewable energy systems for numerous purposes, to improve the efficiency and sustainability of renewable energy systems. Abisoye et al. [1] detailed an extensive review of AI techniques applied to renewable energy system predictions. The reported experiment showed that hybrid AI has the positive aspect of being effective in improving the prediction accuracy of solar and wind energy. Similarly, Çırak et al. [2] discussed the application of different MPPT algorithms for PV systems under varying conditions and stated that for global maximum power point (GMPP) tracking, AI-based approaches always outperform conventional techniques. Al Garni et al. [3] likewise discussed competitive hybrid and metaheuristic algorithms in analyzing MPPT techniques for the optimization of power generation in solar PV systems. The results correspond to the goals of other works, which delve into the studies of solar energy extraction in environmental conditions. Research that goes much deeper into solar energy optimization is one that evaluates MPPT techniques, more so under partial shading, by Arockiasamy and Kuppusamy [4]. Their investigation further showed how important AI inclusion in MPPT was in attaining better efficiency. Also, Mohamed Hariri et al. [5] elaborated on the elements and complications associated with grid-connected PV systems, highlighting MPPT techniques and synchronization into the grid. The approaches have run parallel, having both the objectives of trying to further the efficiency of the system.
Yap et al. [6] have also presented a review on AI-based MPPT techniques with a strong focus on the GMPP detectivity of the partial shading condition by using AI. They have stated that fast convergence and reduced steady-state oscillation were the realized benefits of the AI algorithm. Similarly, Abdolrasol et al. [7] conducted a cross-sectional review of optimization techniques combined with ANN, including GA, PSO, and artificial bee colony (ABC). They demonstrated how such techniques optimize parameters such as the number of neurons and learning rates to improve energy management. Seyedmahmoudian et al. [8] also utilized a metaheuristic-based approach by hybridizing differential evolution (DE) and PSO to forecast the power performance of PV. Their model exhibited a significant enhancement in forecasting accuracy that will only compete with similar ones that use AI techniques. Further, Jumani et al. [9] discussed AI techniques using a computational intelligence-based optimization approach, such as the application of ANN, fuzzy logic, and GA in realizing optimization of the alternating current (AC) microgrid power quality. These represent hybrid techniques applied in previous research.
The study carried out by Radhi et al. [10], for solar power generation in Iraq using neural networks (NN) showed that there was a great improvement in the accuracies in power prediction, while NN outperformed conventional forecasting techniques. The values obtained reflected a 39.1% improvement for the root mean square error (RMSE) in September, which agrees with the findings of Tina et al. [11], emphasizing how significant ML models are in developing better PV performance through accurate solar irradiance forecasting. While these studies highlight the effectiveness of individual ML or metaheuristic algorithms, limited research has explored their synergistic potential in hybrid models. This study aims to bridge that gap by evaluating novel hybrids like ANN-GA and RF-PSO, demonstrating their advantages in real-world conditions. Abdolrasol et al. [7], on revisiting some optimization techniques by taking the use of ANNs, have shown how this combination of widely used optimization methods such as GA and PSO can help in improving the performance of ANNs in energy management. This agrees with the results of other studies, which have also highlighted the need for hybrid AI models in the quest for maximum utilization of renewable energy systems. Results conducted by Yap et al. [6] indicated that the AI-based MPPT techniques had fast convergence and high efficiency, while in Eltamaly et al. [12], results indicated that in 17 MPPT techniques that were studied, including hybrid methods, were performing significantly well in real-life applications.
The work by Seyedmahmoudian et al. [8], performing a short-term PV power forecast, proposes to do so through a metaheuristic approach using DE and PSO. These findings underline the importance of hybrid approaches in addressing practical challenges like fluctuating environmental conditions and maximizing energy output. The application of AI techniques does not stop at energy generation, while He et al. [13] discussed AI-driven optimization in a desalination system powered by renewable energy. This paper also drew greater attention to the fact that ANN and GA techniques greatly enhanced the effectiveness of water treatment processes, underlining the versatility of the AI technique toward nonlinear problem management. Similarly, Le et al. [14] considered that AI-embedded systems connected with internet of things (IoT) and cloud computing increase solar energy applications by resiliency and efficiency. Babatunde et al. [15] performed the survey in the area of hybrid renewable energy systems (HRES) regarding systems operation and planning in sub-Saharan Africa by placing emphasis on integrations with renewable and fossil-powered systems. The study also emphasized hybrid systems to achieve the energy demand of low-electrification areas for sustainable economic development. This goes in conjunction with those studies that have been attempting to optimize the AI techniques in hybrid systems of energy. The reptile search optimization, bettered by the incorporation of sine cosine algorithms and levy flight, to handle regression and classification tasks, was proposed by Khan et al. [16]. The improved reptile search algorithm (IRSA)-trained NN models were used in this work for solar power forecasting along with some significant improvements in the prediction accuracy. Currently, the method is in tune with other AI-based hybrid techniques used for forecasting and optimization.
The current body of research has made considerable progress in optimizing MPPT algorithms for PV systems, particularly under dynamic environmental conditions such as varying irradiance and temperature. However, most traditional MPPT algorithms face deficiencies like suboptimal convergence rates, high sensitivity to initial conditions, and failure to escape local optima. By designing and studying advanced hybrid MPPT algorithms, this work seeks to address these issues and demonstrate their robustness in practical scenarios. The purpose of this work is to design and study hybrid MPPT algorithms, such as ANN-GA, random forest (RF)-PSO, and ANN-GA-PSO, along with traditional techniques, such as PSO and GA, in the selection of the most efficient technique in the optimization of the output of PV power. The research findings highlight that the hybrid models offer better results than the traditional techniques developed using evolutionary algorithms in the selection of NNs. ANN-GA yields a Pmax of 99.2186 W. Results obtained depict that the hybrid MPPT approaches could provide significant improvement in system efficiency while operating under variable irradiance and temperature conditions, hence representing robust optimization regarding PV performance.
Three categories of MPPT algorithms were developed and implemented to optimize the performance of the PV system. These categories include conventional optimization techniques, hybrid metaheuristic algorithms, and ML-based methods.
2.1 Conventional optimization algorithms
Some of the traditional MPPT approaches studied in the work include the Genetic Algorithm (GA), PSO, Bat Algorithm (BA), and Grey Wolf Optimizer (GWO). These MPPT algorithms were developed to find the GMPP, subject to changing environmental conditions—namely, irradiance and temperature levels [17]. In conclusion, maximum current (Imax), maximum voltage (Vmax), and Pmax are among the parameters used to evaluate the algorithms' performances.
In this regard, the performance of the GA can be deemed a fitness function in optimizing the produced Pmax:
$f_{\mathrm{GA}}=\sum_{i=1}^n\left(\frac{P_{\max , i}}{P_{\mathrm{opt}, i}}\right)^2$ (1)
$P_{\max }=I_{\max } \times V_{\max }$ (2)
The fitness function in Eq. (1) represents the convergence of the GA toward the present value of $P_{\max , i}$ compared to the optimal power $P_{\mathrm{opt}, i}$ under ideal conditions. The objective is to minimize this fitness function to ensure convergence at the GMPP, avoiding local optima.
Further refinement of the GA model includes mutation and crossover rates that control the diversification of the population across iterations. The mutation rate is defined as $r_{\text {mut}}$, while the crossover rate is $r_{\text {cross}}$. Both rates are critical for choosing a solution that prevents early convergence and ensures a broad search space is covered:
$r_{\mathrm{mut}}=\frac{\Delta P_{\max }}{P_{\max }} \cdot\left(1-\frac{I_{\max }}{I_{\operatorname{mut}}}\right)$ (3)
$r_{\text {cross }}=\frac{V_{\max }-V_{\text {cross }}}{V_{\max }} \cdot\left(1+\frac{P_{\text {cross }}}{P_{\mathrm{opt}}}\right)$ (4)
where,
$\Delta P_{\max}$ represents the change in Pmax during mutation;
$I_{\text {mut}}$ and $V_{\text {cross}}$ are the mutation current and crossover voltage thresholds, respectively;
$P_{\text {cross}}$ is the power contribution during crossover.
These equations further enhance the convergence capability of the algorithm toward global optimums. Specifically, Eq. (4) provides a critical drive in the convergence of the algorithm for optimal power output at each iteration.
2.2 Hybrid metaheuristic algorithms
This category includes hybrid models such as GA-PSO, ANN-GA, RF-PSO, and ANN-GA-PSO, which combine the strengths of multiple optimization algorithms. These hybrid models are developed to address local optima, enhance overall MPPT performance, and reduce power losses [18]. The selection of these hybrid methods is justified by their ability to balance global exploration and local exploitation, as demonstrated in recent literature. For example, GA's global optimization is complemented by PSO's fine-tuning capabilities.
The balance mechanism is assured by defining the fitness function of the hybrid GA-PSO algorithm as the weighted sum of the individual fitness functions of GA and PSO:
$f_{\text {hybrid }}=\alpha \cdot f_{\mathrm{GA}}+(1-\alpha) \cdot f_{\mathrm{PSO}}$ (5)
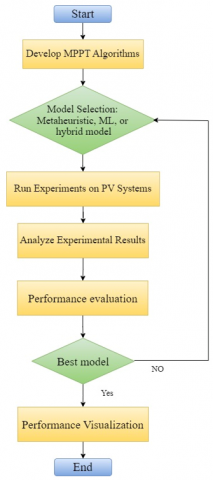
where, α balances, respectively, the global exploration ability of GA and the local exploitation strength of PSO. This hybridization ensures better performance by adapting dynamically to varying conditions, as shown in Figure 1, which illustrates the hybrid algorithm's flowchart.
Figure 1. Work flow of the study
In the PSO part of this hybrid model, the position for each particle belonging to the search space is guided by the rule of updating the velocity. This hybrid model presents an adjustment in the classical PSO velocity equation for a more precise convergence:
$\begin{aligned} v_{i+1}= & \omega \cdot v_i+c_1 \cdot r_1 \cdot\left(p_{\text {best }}-x_i\right) +c_2 \cdot r_2 \cdot\left(g_{\text {best }}-x_i\right)\end{aligned}$ (6)
where, $v_i$ and $x_i$ represent the velocity and position of the particle in the iii-th iteration, and $\omega$ is the inertia coefficient. The terms $c_1$ and $c_2$ adjust the cognitive and social influence of the particle's personal best $p_{\text {best}}$ and the global best $g_{\text {best}}$. The random variables $r_1$ and $r_2$ introduce stochasticity in the updating process.
A further refinement is made by dynamically adjusting the inertia coefficient ω, which decreases linearly with each iteration, balancing exploration and exploitation:
$\omega(t)=\omega_{\max }-\frac{\left(\omega_{\max }-\omega_{\min }\right) \cdot t}{T_{\max }}$ (7)
where, $\omega_{\max }$ and $\omega_{\min }$ are the maximum and minimum inertia values, ttt is the current iteration, and $T_{\max }$ is the total number of iterations. The equation decreases the value of inertia with time gradually, which balances the exploration and exploitation during optimization. Equation shows the adaptability of the hybrid algorithm since inertia decreases gradually to minimize the movement of the particles in the latter stages of the optimization process. This, in fact, allows the algorithm to perform a local search in promising regions once global exploration has narrowed down and identifies candidate solutions.
Further refinement may also be done by incorporating the gradient of the fitness function into the hybrid algorithm for more accurate updates of the particle's position:
$\nabla f_{\mathrm{hybrid}}=\left(\frac{\partial f_{\mathrm{GA}}}{\partial x}+\frac{\partial f_{\mathrm{PSO}}}{\partial x}\right) \cdot\left(\alpha \cdot \nabla f_{\mathrm{GA}}+(1-\alpha) \cdot \nabla f_{\mathrm{PSO}}\right)$ (8)
where,
$\nabla f_{\text {hybrid}}$ represents the gradient of the hybrid fitness function with respect to the particle position x,
$\frac{\partial f_{\mathrm{GA}}}{\partial x}$ and $\frac{\partial f_{\mathrm{PSO}}}{\partial x}$ are the partial derivatives of the fitness functions for GA and PSO, respectively.
Eq. (8) depicts the gradient-based optimization that further improvises the capability of the hybrid algorithm to fine-tune the particle positions, in an integrated effect incorporating both components of GA and PSO.
2.3 Machine learning models
ML methods, including ANN, RF, and XGBoost, are applied to forecast GMPP with its past environmental information encompassed in irradiance, temperature, and power output from the PV system. These models are particularly well suited for capturing nonlinear and complex patterns in the data and so are best for the prediction of Pmax outputs under varying environmental conditions. The ANN model, in particular, is advantageous for its ability to approximate complex relationships between inputs and outputs, as demonstrated in Eq. (9) [19-21].
$h_j=\sigma\left(\sum_{i=1}^n w_{i j} \cdot x_i+b_j\right)$ (9)
$\hat{P}_{\max }=\sigma\left(\sum_{j=1}^n w_{\mathrm{out}, j} \cdot h_j+b_{\mathrm{out}}\right)$ (10)
$J(\theta)=\frac{1}{2 m} \sum_{i=1}^m\left(\hat{y}^{(i)}-y^{(i)}\right)^2$ (11)
$w_{i j}^{\mathrm{new}}=w_{i j}^{\mathrm{old}}-\eta \cdot \frac{\partial J(\theta)}{\partial w_{i j}}$ (12)
$\hat{P}_{\max }=\frac{1}{T} \sum_{t=1}^T \hat{P}_{\max , t}$ (13)
$\mathcal{L}(\theta)=\sum_{i=1}^m \ell\left(\hat{y}^{(i)}, y^{(i)}\right)+\sum_{k=1}^K \Omega\left(f_k\right)$ (14)
In this respect, namely, ANN, RF, and extreme gradient boosting (XGBOOST) ML-based methods were undertaken to predict the GMPP of the PV system based on historical data like variable features: irradiance, temperatures, and power output. The ANN model accounts for multilayer neurons to model complex and non-linear relationships between the input features and the output power. The activation of each neuron in the hidden layer is computed as in Eq. (9), where $h_j$ represents the activation of the j-th neuron, $w_{i j}$ are the weights between the input features and the neurons, $x_i$ represents the input feature, while $b_i$ represents the bias term. This information forms the final prediction of the maximum output of the network, $\hat{P}_{\max }$, in accordance with the weighted sum of neuron activations in the output layer, given by Eq. (10), where $w_{\text {out }, j}$ are the weights connecting the hidden neurons to the output layer, and $b_{\text {out }}$ is the bias for the output layer.
The Mean Squared Error (MSE)-based cost function in Eq. (11) minimizes prediction error relative to the actual outputs, thus optimizing the performance of the ANN model. Here, $J(\theta)$ is the cost function, while $\hat{y}^{(i)}$ and $y^{(i)}$ denote the predicted and actual corresponding model output, respectively. During the training process, the correction of the weights of the model is done by the gradient descent rule shown in Eq. (12), where $w_{i j}^{\text {new }}$ and $w_{i j}^{\text {old }}$ refer to the new and old weights, respectively, while $\eta$ is the learning rate that determines the size of the update step.
Power output $\widehat{P}_{\max }$ predicted under the RF model is taken to be the average across all trees in the forest, where in Eq. (13), $T$ is the total number of trees, and $\hat{P}_{\text {max}, t}$ is the prediction from the ttt-th tree. The predictions of the XGBoost model are further fine-tuned by minimizing a more complex objective function, given by Eq. (14), which is a combination of a loss function and a regularization term to avoid overfitting. In Eq. (14), $\ell\left(\hat{y}^{(i)}, y^{(i)}\right)$ is the loss function, measuring the deviation between the prediction and the actual outputs, and $\Omega\left(f_k\right)$ is the regularization term, which was introduced to control the model complexity of the k-th tree. K is the total number of trees used in XGBoost.
The workflow of this study is developed to ensure that the performance of various MPPT algorithms is evaluated and compared based on the environmental conditions to achieve the best efficiency of the PV systems as illustrated in the flowchart of Figure 1. The process starts by the creation of several MPPT algorithms, meta-heuristic algorithms such as GA, PSO, BA, GWO, and Ant Colony Optimization. Besides, the following ML-based techniques were used: RF, XGBoost, ANN, and Decision Tree along with the integration of different features of the techniques that are GA-PSO, ANN-PSO, PSO-BA, RF-PSO, ANN-GA, and ANN-GA-PSO. Such diversity in the choice of algorithms provides a wide ranging search for strategies to improve the performance of PV systems.
Once the algorithms are developed, model selection is conducted by categorizing the algorithms into three groups: metaheuristic, ML and hybrid models. This step made it possible to differentiate between different algorithmic strategies and thus it was possible to have a complete assessment of the algorithms’ performance. All the selected algorithms were then applied to a PV system under simulated conditions that closely resembled the changes in environmental parameters such as irradiance and temperature. These simulations were important in determining the algorithms capacity to track the Pmax point of the PV system, which is very important in the generation of power.
As for the experiments, the results were evaluated according to fundamental indicators which are Imax, Vmax, and Pmax. These metrics established a quantitative measure that could be used for the evaluation of each of the algorithm. The obtained results were analyzed in more detail to determine how effectively each algorithm maximized the PV system’s performance. The assessment pointed out the speed, accuracy, and level of computation of each approach, which helped to compare the strength and weaknesses of the two techniques.
After the performance evaluation, the superior algorithms were determined by the capacity to optimize the PV performance all the time. In a case where a chosen model failed to meet the set performance, then it had to be sent back to the selection process either for fine-tuning or rejection. The last phase of the workflow comprised of the data visualization of the performance results by the use of different methods including scatter plots, box plots and comparative performance curves. These visualizations compared the performance of each algorithm and brought out the variations in Imax, Vmax, and Pmax of each method clearly. The visualization stage gave a clear picture on the performance of each algorithm in relation to the other and it was evident that the hybrid algorithms had higher overall power output.
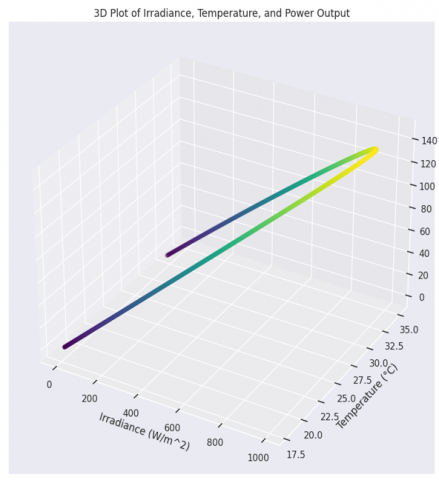
The plot in 3D shown in Figure 2 demonstrates the interaction between irradiance, temperature and power output in a PV system.
Figure 2. 3D visualization of the impact of irradiance and temperature on PV system power output
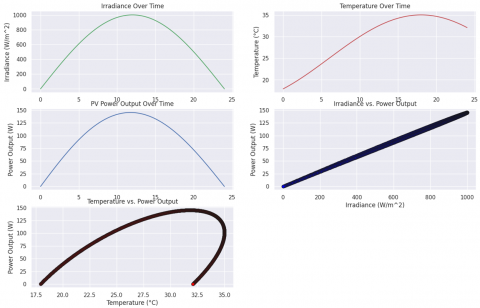
Figure 3. Comprehensive analysis of irradiance, temperature, and power output dynamics in a PV system
This is evident from the graph where it shows that irradiance and power output move in the same direction where the output power of the PV system shoot up with a corresponding increase in the irradiance level. This is due to increased energy from the sun which in turn increases the electricity generating ability of the solar cells. On the other hand, the effect of temperature on power output is more protracted. Looking at the temperature curve, it is clearly seen that the power output decreases as the temperature increases though the change is not steep as in the case of irradiance curve. This inverse relationship could be explained by the fact that the efficiency of the solar cells decreases with increased temperatures and therefore the output power drops slightly. In general, the flow of the plot highlights the fact that irradiance is the major factor that defines the power produced by a PV system, while temperature can be considered as the factor, which influences the power result, albeit not as significantly as irradiance.
These multiple plots of Figure 3 help to understand relations between irradiance, temperature, and power of the PV system. The top left plot shows the normal trends of irradiance whereby irradiance increases from morning, has the maximum value at midday and then decreases as the day progresses. The same can be observed in the top right graph depicting temperature trends where the temperature is gradually increases in the morning, peaks in the afternoon and then gradually decreases in the evening. This is evidenced by the middle left plot displaying the PV power output in time in which the power output is highly related to the irradiance curve and is also directly proportional to it. However, in the bottom left graph, there is a more complicated relation between temperature and the output power, as with the increase in temperature the output power rises but then starts to fall as the efficiency decreases in PV cells. Finally, the bottom right figure brings the irradiance and the power output in correlation where it stipulates that the Pmax output is realized when irradiance is at its maximum. Altogether, these plots reveal the significant role of irradiance and temperature in the operation of PV systems.
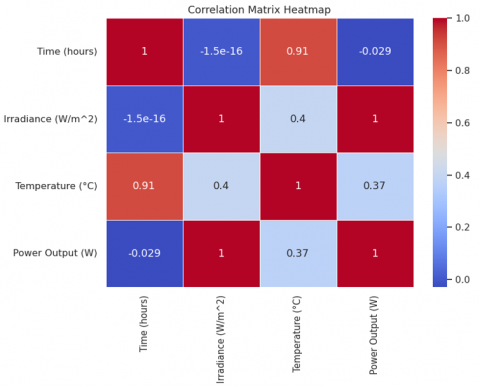
The correlation matrix heatmap of Figure 4 provides a clear visualization of the relationships between key variables in the PV system: time, irradiance, temperature and power output. The values and saturation of colours of the correlation coefficients confirm the strength and direction of these associations. The heatmap shows that time has a positively correlated to temperature with a correlation of 0.91 which looks like a normal curve of the day as the temperature increases as the day progresses. Likewise, irradiance has a positive correlation coefficient of 0.4 with both temperature and power output, however, moderate correlation indicates that while irradiance brings about temperature increase, it is not the only reason for same. Yet the most important relationship shown is between irradiance and power output, wherein they are directly proportional to each other: a perfect positive correlation (r=1). The high degree of coherency is an affirmation that irradiance is the main determinant of the power output in the PV system as was hypothesised. On the other hand, the relationship between temperature and power output is less pronounced with a coefficient of 0.37 meaning that though temperature affects the power output its impact is not as strong as that of irradiance. Remarkably, the obtained value of negative correlation between time and power output (-0.029) approaches zero, which implies that time does not affect power output independently of irradiance and temperature. This heatmap therefore serves as a helpful representation of the interactions between the variables and proper emphasis on irradiance as the key factor that influences the performance of PV system.
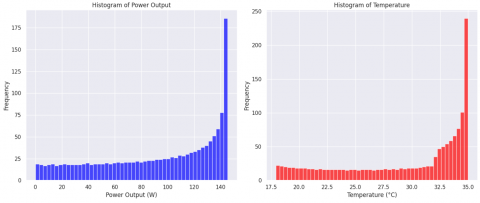
The histograms of Figure 5 represent distribution of power output and temperature of the PV system. The histogram of the power output (left panel) reveals that the density of sampled data is skewed towards the higher value of power output, particularly in the range of 120 W to 150 W showing that the PV system often works at Pmax point particularly under high irradiance conditions. The relatively even distribution across lower power outputs indicates that the system also suffers lower efficiency during low intensity irradiation like early morning or evening. On the other hand, the histogram of temperature (right panel) shows a shift towards the right towards the higher temperatures and particularly between 30℃ and 35℃ which is roughly in the middle of the day peak irradiance. Temperatures below 25℃ are far much less frequent, this is because of normal daytime heating patterns. Altogether, these histograms give an idea of the condition of the PV system and distribution of the power output and temperature highlight the effect of environmental parameters on the system performance.
Figure 4. Correlation matrix heatmap of key variables affecting PV system performance
Figure 5. Histograms of power output and temperature in a PV system
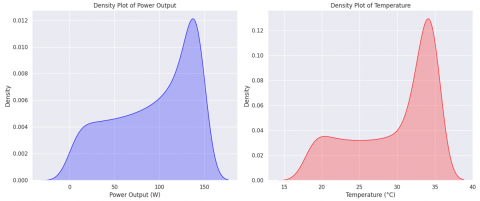
Figure 6. Density plots of power output and temperature in a PV system
Figure 6 is used to show the density plots that reveals the distribution of the power output and the temperature of the PV (PV) system. The density plot of the power output (Figure 2, left panel) shows that most of the time the PV system is operating close to its power limit with a highly significant peak at 140 W. The distribution is characterised by an increase in density from no power output and a steep surge to the maximum density at the higher power levels. This seems to indicate that the right conditions for power production are most of the times realized as suggested by the system efficiency on the available irradiance. The density plot of the temperature (right panel) shows a clear maximum at around 35℃ which suggest that this range of temperature is most frequent within the operating environment of the PV system. Distribution of data points plotted in this case appears to be fairly uniform across the lower temperatures but then there is a steep rise as the temperatures rise towards the peak. This pattern corresponds with the normal heating effect of the sun during the day whereby temperatures are higher and more constant during the afternoon as compared to earlier in the day. In general, these density plots give an insight of the working conditions of the PV system by revealing that both; high power and high temperatures are common. The plots relate the performance of the system to temperature conditions and it shows how the system is capable of delivering high performance under normal operating temperatures.
Table 1 presents a comprehensive comparison of the MPPT algorithms based on three critical performance indicators: Imax, Vmax and Pmax. These indicators are critical in assessing the performance of various algorithms in determining the optimal power output of solar PV systems when exposed to various conditions.
Table 1. Comparative performance of MPPT algorithms in solar PV arrays
|
No. |
Method |
Imax |
Vmax |
Pmax |
|
1 |
GA |
3.4974 |
25.89 |
90.55 |
|
2 |
PSO |
3.4974 |
25.89 |
90.55 |
|
3 |
BA |
3.4974 |
25.89 |
90.55 |
|
4 |
GWO |
3.4974 |
25.89 |
90.55 |
|
5 |
Ant Colony |
3.5079 |
25.81 |
90.54 |
|
6 |
RF |
3.4792 |
27.531 |
95.7867 |
|
7 |
XGBoost |
3.3814 |
28.216 |
95.4105 |
|
8 |
ANN |
3.5055 |
27.321 |
95.7740 |
|
9 |
Decision Tree |
3.5803 |
26.666 |
95.4737 |
|
10 |
GA-PSO |
3.4623 |
27.973 |
96.8526 |
|
11 |
ANNPSO |
3.5811 |
25.348 |
90.7751 |
|
12 |
ANN-GA |
3.3926 |
29.245 |
99.2186 |
|
13 |
PSO-BA |
3.5919 |
26.729 |
96.0084 |
|
14 |
RF-PSO |
3.6227 |
25.837 |
93.6017 |
|
15 |
ANN-GA-PSO |
3.6193 |
25.753 |
93.2095 |
The results show a significant gap between basic optimization methods and advanced ML methods, as well as combined methods. The standard algorithms like GA, PSO, BA, and GWO performed the same as conventional algorithms, which Imax found to be 3. 4974 A. The optimum velocity or Vmax was observed at 25.89 V at 90.55 W Pmax. This makes one presume that there is a limit in optimization potential when these methods are employed in isolation, and such may be caused by similar convergence characteristics or the existence of local optima in the search domain.
However, if these algorithms are used in conjunction with other methods or replaced by ML models, then there is a considerable improvement in the performance indicators. For example, the proposed hybrid GA-PSO method yielded slightly higher Pmax of 96.8526 W, which means that integration of GA exploration aspect with PSO exploitation aspect can eliminate the weakness of single method. Likewise, the Pmax output of 99.2186 W was obtained by the ANN-GA hybrid, indicating the ability of NNs in modeling nonlinear relationships that are difficult to model using the conventional algorithms.
The use of the RF, XGBoost, and ANN models yields impressive results. The proposed RF model gave a Pmax of 95.7867 W and this was much higher compared to the traditional algorithms. From this it can be inferred that ensemble learning techniques can handle feature importance and interaction in an optimal manner thus enhancing the performance of the model.
The other advanced ensemble method, XGBoost also performed well with a Pmax of 95.4105 W The ANN model being used in isolation yielded a Pmax of 95.7740 W, which showed that the model is capable of generalizing and learning the intricate relationships between the input and output of the PV system.
The table shows that in most cases hybrid algorithms are more effective than their non-hybrid counterparts. For instance, the ANN-GA-PSO method which integrates GAs, PSO and ANNs attained a Pmax of 93.2095 W, although slightly less than other methods, this is an indication that integrating different optimization methods can lead to better robustness and accuracy.
The second hybrid, called PSO-BA, also demonstrated good performance with Pmax of 96.0084 W. The integration of the global search capability of PSO with the local search of BA is a good example of blend that optimizes the power output than the standalone application of either algorithm.
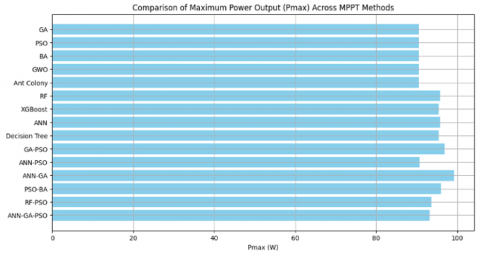
Figure 7. Comparison of Pmax output across MPPT methods
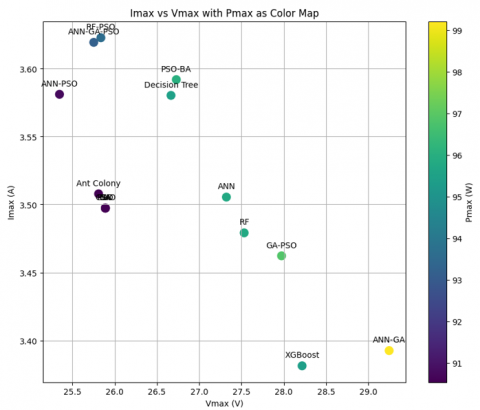
Figure 8. Comparison of Imax and Vmax across MPPT algorithms with Pmax as a color indicator
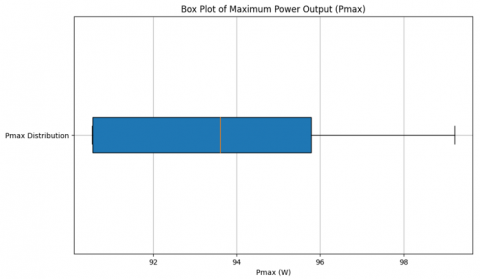
Figure 9. Distribution of Pmax output across different MPPT algorithms
These results show that hybrid and ML based algorithms outperform the conventional optimization algorithms in enhancing the power output of the solar PV systems as illustrated in Figure 7. The best performing methods, especially the ANN-GA, indicate that the use of the predictive capability of NNs together with the evolutional algorithms can enhance the efficiency of the MPPT.
It is, therefore, necessary to consider the development of other hybrid optimization techniques especially those that incorporate ML models. With the increasing system size and diversification of solar PV systems, the effectiveness of these sophisticated algorithms will play a more important role in maximizing the energy yield. The results of the study indicate that while conventional mathematical formulas form the basis of MPPT, the evolution of the technique lies in the integration of the basic algorithms with sophisticated ANNs.
Figure 8 shows the Imax and Vmax reached by the different MPPT algorithms and the color bar represents the Pmax achieved. The plot shows that most algorithms have the Vmax in the range of 25.5 V – 28.5 V, and the Imax in the range of 3.45 A – 3.60 A The ANN-GA algorithm has the highest Vmax of 29.245 V and the highest Pmax of 99.2186 W as shown by the yellow color. However, XGBoost and GA-PSO show slightly lower power performance, which implies the difference in the optimization goals. The change of color from purple to yellow helps to contrast the difference in the efficiency of these algorithms in achieving the Pmax output. This visualization highlights the variability of algorithms, which would help in choosing the right MPPT method according to the desired objectives of the system, whether it is voltage, current or overall power.
Figure 9 shows a box plot of the distribution of the Pmax with respect to different MPPT algorithms. The box plot of the Pmax values is depicted in Figure 3 and it shows that the Pmax values lie in the interval of approximately 91 W to slightly above 98 W with the IQR being in the interval of approximately 92 W to 96 W. The whiskers go up to the lower and upper end showing the range in which most of the Pmax values are expected to fall. There are no extreme values meaning that most of the algorithms operate at relatively close power output level. This box plot offers a brief overview of the dispersion and the mean of the Pmax outputs and stress the point that although some algorithms tend towards the top of the scale, a majority of them are in the mid-90s range.
The increasing global demand for sustainable energy has significantly boosted the progress of PV systems, positioning them as one of the most vital renewable energy solutions. However, the efficiency of PV systems is highly dependent on environmental parameters such as irradiance and temperature, necessitating the application of robust MPPT algorithms. This study contributes to the existing body of knowledge by presenting a comprehensive comparative evaluation of various MPPT algorithms, highlighting the strengths and limitations of conventional, hybrid, and artificial intelligence-based approaches. Choosing the right MPPT algorithm is crucial to improving the efficiency and performance of PV systems, making this research timely and relevant. The analysis demonstrates that hybrid and ML techniques outperform traditional methods in optimizing PV system performance. For instance, the ANN-GA algorithm achieved the highest Pmax of 99.2186 W, proving that integrating neural networks with evolutionary algorithms effectively enhances power output. Other hybrid approaches, such as RF-PSO and ANN-GA-PSO, also exhibited improved performance by optimizing both current and voltage. These findings indicate the ability of hybrid models to address the inherent limitations of standalone algorithms, such as susceptibility to local optima and reduced adaptability to dynamic conditions. Furthermore, the research reveals that while most algorithms produce similar Imax and Vmax values, the optimization strategies employed significantly influence the resulting Pmax. The results underscore the importance of selecting an MPPT algorithm not only based on power output but also on the specific operational requirements and environmental conditions of the PV system. For instance, the distribution of Pmax values, as illustrated in the box plot, highlights the variability in algorithm efficiency, with certain methods performing exceptionally well under specific circumstances. This study also emphasizes the practical implications of these findings. Hybrid and ML-based algorithms show significant potential for real-world applications, especially as PV systems continue to scale and diversify. Incorporating these advanced techniques into commercial PV systems could substantially enhance their efficiency and reliability, contributing to the global transition toward cleaner and more effective energy resources. However, further research is needed to refine these algorithms, explore their scalability, and evaluate their performance under diverse environmental and operational conditions. The limitations of this research include the absence of real-world implementation data and the focus on specific environmental conditions. Future studies should aim to address these gaps by testing improved MPPT techniques under varied scenarios and incorporating real-time operational data to validate their practical applicability. Additionally, advancements in hybrid and ML-based approaches, such as integrating deep learning models with optimization techniques, should be explored to further enhance their predictive and adaptive capabilities. The findings provide a strong foundation for future research and underscore the potential of hybrid and ML algorithms to transform the renewable energy sector. By addressing the limitations identified and focusing on practical implementation, the integration of advanced MPPT algorithms into commercial PV systems could play a pivotal role in achieving sustainable energy goals.
The authors acknowledge financial support from Jamhuriya University.
[1] Abisoye, B.O., Sun, Y., Zenghui, W. (2023). A survey of artificial intelligence methods for renewable energy forecasting: Methodologies and insights. Renewable Energy Focus, 48: 100529. https://doi.org/10.1016/j.ref.2023.100529
[2] Çırak, C.R., Çalık, H. (2023). Hotspots in maximum power point tracking algorithms for photovoltaic systems–A comprehensive and comparative review. Engineering Science and Technology, an International Journal, 43: 101436. https://doi.org/10.1016/j.jestch.2023.101436
[3] Al Garni, H.Z., Sundaram, A., Awasthi, A., Chandel, R., Tajjour, S., Singh Chandel, S. (2024). A comprehensive review of most competitive maximum power point tracking techniques for enhanced solar photovoltaic power generation. Journal of Renewable Energy and Environment, 11(3): 60-80. https://doi.org/10.30501/jree.2024.408699.1638
[4] Arockiasamy, B., Kuppusamy. (2023). Design of MPPT algorithms techniques based artificial intelligence for solar power system. International Journal of Precious Engineering Research and Applications, 8(1): 1-26.
[5] Mohamed Hariri, M.H., Mat Desa, M.K., Masri, S., Mohd Zainuri, M.A.A. (2020). Grid-connected PV generation system—Components and challenges: A review. Energies, 13(17): 4279. https://doi.org/10.3390/en13174279
[6] Yap, K.Y., Sarimuthu, C.R., Lim, J.M.Y. (2020). Artificial intelligence based MPPT techniques for solar power system: A review. Journal of Modern Power Systems and Clean Energy, 8(6): 1043-1059. https://doi.org/10.35833/MPCE.2020.000159
[7] Abdolrasol, M.G., Hussain, S.S., Ustun, T.S., Sarker, M.R., et al. (2021). Artificial neural networks based optimization techniques: A review. Electronics, 10(21): 2689. https://doi.org/10.3390/electronics10212689
[8] Seyedmahmoudian, M., Jamei, E., Thirunavukkarasu, G.S., Soon, T.K., et al. (2018). Short-term forecasting of the output power of a building-integrated photovoltaic system using a metaheuristic approach. Energies, 11(5): 1260. https://doi.org/10.3390/en11051260
[9] Jumani, T.A., Mustafa, M.W., Hamadneh, N.N., Atawneh, S.H., et al. (2020). Computational intelligence-based optimization methods for power quality and dynamic response enhancement of ac microgrids. Energies, 13(16): 4063. https://doi.org/10.3390/en13164063
[10] Radhi, S.M., Al-Majidi, S., Abbod, M., Al-Raweshidy, H. (2024). Predicting solar power generation utilized in Iraq power grid using neural network. Misan Journal of Engineering Sciences, 3(1): 38-62.
[11] Tina, G.M., Ventura, C., Ferlito, S., De Vito, S. (2021). A state-of-art-review on machine-learning based methods for PV. Applied Sciences, 11(16): 7550. https://doi.org/10.3390/app11167550
[12] Eltamaly, A.M., Farh, H.M., Othman, M.F. (2018). A novel evaluation index for the photovoltaic maximum power point tracker techniques. Solar Energy, 174: 940-956. https://doi.org/10.1016/j.solener.2018.09.060
[13] He, Q., Zheng, H., Ma, X., Wang, L., Kong, H., Zhu, Z. (2022). Artificial intelligence application in a renewable energy-driven desalination system: A critical review. Energy and AI, 7: 100123. https://doi.org/10.1016/j.egyai.2021.100123
[14] Le, T.T., Le, T.T., Le, H.C., Paramasivam, P., Chung, N. (2024). Artificial intelligence applications in solar energy. JOIV: International Journal on Informatics Visualization, 8(2): 826-844. https://doi.org/10.62527/joiv.8.2.2686
[15] Babatunde, O.M., Munda, J.L., Hamam, Y. (2020). A comprehensive state-of-the-art survey on hybrid renewable energy system operations and planning. IEEE Access, 8: 75313-75346. https://doi.org/10.1109/ACCESS.2020.2988397
[16] Khan, M.K., Zafar, M.H., Rashid, S., Mansoor, M., Moosavi, S.K.R., Sanfilippo, F. (2023). Improved reptile search optimization algorithm: Application on regression and classification problems. Applied Sciences, 13(2): 945. https://doi.org/10.3390/app13020945
[17] Salman, D., Elmi, Y.K., Mohamed, A.S., Mohamed, Y.H. (2024). Forecasting maximum power point in solar panels using CNN-GRU. SSRG International Journal of Electrical and Electronics Engineering, 11(7): 215-227. https://doi.org/10.14445/23488379/IJEEE-V11I7P119
[18] Salman, D., Kusaf, M. (2021). Short-term unit commitment by using machine learning to cover the uncertainty of wind power forecasting. Sustainability, 13(24): 13609. https://doi.org/10.3390/su132413609
[19] Salman, D., Siyad, A.A., Kusaf, M., Elmi, Y. (2024). Day ahead unit commitment with high penetration of renewable energy sources and electric vehicle charging stations. International Journal of Engineering Trends and Technology, 72(6): 361-379. https://doi.org/10.14445/22315381/IJETT-V72I6P133
[20] Louhichi, M., Nesmaoui, R., Mbarek, M., Lazaar, M. (2023). Shapley values for explaining the black box nature of machine learning model clustering. Procedia Computer Science, 220: 806-811. https://doi.org/10.1016/j.procs.2023.03.107
[21] Moosa, A., Shabir, H., Ali, H., Darwade, R., Gite, B. (2018). Predicting solar radiation using machine learning techniques. In 2018 Second International Conference on Intelligent Computing and Control Systems (ICICCS), Madurai, India, pp. 1693-1699. https://doi.org/10.1109/ICCONS.2018.8663110