Nikolay Kulyasov*![]() | Nikolay Dorogov
| Nikolay Dorogov![]() | Liliya Babynina
| Liliya Babynina![]() | Julia Bronskaya
| Julia Bronskaya![]() | Yuri Selyavskiy
| Yuri Selyavskiy![]() | Nikolay Puzyrnyy
| Nikolay Puzyrnyy![]()
© 2024 The authors. This article is published by IIETA and is licensed under the CC BY 4.0 license (http://creativecommons.org/licenses/by/4.0/).
OPEN ACCESS
Given mounting concerns surrounding the escalating greenhouse gas emissions (GHG) associated with fossil fuel extraction, production, and utilization by both Russian and global oil and gas corporations, devising novel strategies to mitigate the impacts of climate change is imperative. This study is underpinned by a comprehensive review and analysis of global trends in greenhouse gas emissions, diverse decarbonization methods applicable to the oil and gas industry, and established approaches to assess decarbonization initiatives in this sector. These insights underscore the need to advance conceptual frameworks to refine the analysis of decarbonization efforts undertaken by Russian oil and gas enterprises. This study makes a valuable scientific and methodological contribution toward fostering sustainable low-carbon development within the oil and gas industry. This goal is achieved through the implementation of a comprehensive model that passes the ecological and economic impacts of decarbonization initiatives at Russian oil and gas companies. The model proposes an approach to evaluate the effects of these initiatives on the competitiveness of the oil and gas sector using a Balanced Scorecard (BSC) approach supplemented with a range of ecologic metrics. Additionally, the model introduces an integral indicator to quantify the influence of the Balanced Scorecard on key operations of an oil and gas company during decarbonization efforts.
climate mitigation, greenhouse gases, oil and gas industry, competitiveness, adaptation to climate change
Over the past decade, the issue of global climate change stemming from a surge in human-made greenhouse gas emissions (GHG) has emerged as a pivotal issue for the 21st century. According to assessment by scientists and specialists, if this trend persists, then the increase in greenhouse gas emissions (GHG) may result in substantial global warming by 2050. This warming, in turn, poses a grave threat, potentially culminating in the extinction of as much as 30% of earth’s diverse plant and animal species [1].
In response to the global climate crisis and the urgent need to mitigate greenhouse gas emissions (GHG), the vast majority of United Nations (UN) member states have embraced the UN Framework Convention on Climate Change and signed the Paris Agreement. At present, this groundbreaking agreement has received participation from 196 countries, including Russia [2].
Under the framework of the Paris Agreement, governments of participating nations have committed themselves at the national level to measures known as Intended Nationally Determined Contributions (INDCs). These commitments encompass a range of measures, including the establishment of carbon emission trading systems, the implementation of state incentives to encourage decarbonization, plans to phase out internal combustion engines, and comprehensive strategies for reducing greenhouse gas emissions (GHG).
For instance, outlined in the Strategy for Socio-Economic Development of the Russian Federation, there is a specific plan aimed at significantly reducing net greenhouse gas emissions (GHG) by 2050, with the target of cutting emissions by 2.5 times compared to the 2019 baseline. Ultimately, the goal is to reach zero emissions, equivalent to 0.6 billion tons of carbon dioxide. This demonstrates the country’s commitment to robust climate action at the national level [3].
Climate change has a direct and profound impact on industries and the potential to reshape entire value chains. This transformation is poised to cause significant shifts in how individual industrial enterprises and entire sectors are managed, ultimately influencing the nature of work and people's quality of life.
Today, the carbon footprint of a product is the paramount indicator of its quality. Companies with commitments to decarbonizing and sustainable development strategies are thriving, outpacing competitors who have not embraced new approaches to adapting to and mitigating the consequences of climate change. The success of these forward-thinking enterprises is reflected in their rapid growth and enhanced business performance.
The need for transformation is particularly pertinent to the oil and gas industry, given its status as a primary source of carbon emissions in Russia and worldwide. Addressing these challenges is crucial for both industry and society at large.
It is worth highlighting that recent research has increasingly focused on the influence of climate change on business performance and sustainability [4-13]. Notably, a significant body of work has been dedicated to assessing the effectiveness of decarbonization in the oil and gas industry [6, 14-25]. Additionally, several studies [26-28] have emphasized the importance of balancing the facial, environmental, and economic aspects of development, with a focus on sustainability and climate change problem-solving [1, 29].
Minimizing the carbon footprint is a challenging, long-term, and costly process that requires a phased approach seamlessly integrated within the operations of oil and gas companies, taking into account their financial capacities and starting positions [30]. Consequently, we scrutinized statistical and predictive data sourced from industry analytical bodies [31-33], in addition to the development plans of oil and gas enterprises [16, 34-36]. The pursuit of decarbonization and reduction of carbon footprints compelling oil and gas businesses to explore and develop new plans, strategies, and business models [37, 38]. Furthermore, some researchers are examining the investments made by oil and gas companies in renewable energy sources as a means to diminish the carbon footprint of their operations [39, 40].
In light of the foregoing, it is evident that an urgent need exists to develop an approach for the evaluation of a company’s decarbonization efforts and the resulting outcomes. Consequently, we have conducted an analysis of studies [4, 41], methodological approaches, and techniques that can be applied and customized for the appraisal and examination of a firm's activities and expenditures concerning the mitigation of CO2-equivalents emissions [42-49]. A thorough review and analysis of the relevant literature revealed a notable scarcity of attention directed toward the development and analysis of the efficacy of decarbonization measures for Russia’s oil and gas industry. Although the aforementioned sources suggest investing in renewable energy sources, afforestation, and measures to enhance energy and resource conservation as primary measures for decarbonizing oil and gas firms, the subject of devising a model for analyzing the effectiveness of decarbonization measures in Russian oil and gas enterprises has not been addressed in the works of both domestic and foreign researchers. This deficiency poses a scientific problem that requires resolution within the scope of this research article.
3.1 Theoretical foundation
The methodological foundation of this study rests upon research conducted by foreign and domestic scholars in the area of decarbonizing the oil and gas sector, as well as on the concept of low-carbon development and strategic planning. During the course of these investigations, a variety of scientific and specialized methods of inquiry were employed, including the principles of dialectical analysis, synthesis, generalization, comparison, classification, and grouping. Additionally, several empirical approaches were utilized.
This article examines the escalating trends of greenhouse gas emissions resulting from the global operations of the gas and oil industry, underscoring the imperative to develop strategies aimed at curbing the industry's carbon footprint. This section provides an overview of decarbonization methods applied in the gas and oil sectors across various scopes. Additionally, the article compiles and analyzes the principal initiatives undertaken by Russian oil and gas companies to mitigate greenhouse gas emissions. Notably, the assessment and analysis of the efficacy of decarbonization measures within this sector necessitate increased financial investments and costs for these enterprises.
3.2 Assessment of existing decarbonization evaluation methods
Unfortunately, in many studies [22-24, 30, 33, 44] analyzed while writing this paper, the methods used to assess decarbonization efforts in the oil and gas industry are rather descriptive and suggestive in nature. They do not provide formulas or detailed metrics for more in-depth calculations and conclusions or for decision-making in implementing decarbonization strategies for oil and gas companies. The main message of these approaches and methodologies is to list measures such as:
• Implementing a carbon price through mechanisms like carbon taxes or cap-and-trade schemes, which incentivize companies to reduce their emissions by making environmentally friendly technology investments more cost effective.
• Taking initiatives and measures to improve energy efficiency and reduce energy consumption per unit of production.
• Carbon capture and storage to reduce emissions from the oil and gas industry. The assessments examine the feasibility, cost and effectiveness of CO2 capture and storage.
• Increasing the proportion of electricity generated from renewable sources used by oil and gas companies. These indicators and methods are presented in the papers descriptively and in abstract form, without further interaction with them for additional calculations or analyses.
3.3 Proposed framework for evaluating decarbonization measures
The methodology and indicators are most closely aligned with the objectives of this study [17]. This paper proposes a framework for evaluating the effectiveness of measures to decarbonize the oil and gas industry, consisting of a three-part process. The first part assesses the scope of decarbonization efforts in the industry. The second part involves a risk assessment of priority activities within the context of objective 3. The final step involves an evaluation of event 1 success considering any associated risks. In order to measure success, we use NPV (net present value), DPP (discounted payback period), and DPI (discounted internal rate of return) as performance indicators.
A method based on expert opinion was used to determine the most significant activities within the three areas of focus, considering risks. The ranking of the measures and risks in question is determined through expert analysis based on their relevance. The maximum possible score for Block I is 100 points, while for Block II, it is 50 points (which has a negative value as it reduces the efficacy of measures). The final score is then reflected in Block II. The event with the highest number of points is then economically evaluated in Block III.
This approach has interested the authors of this study, and the idea of incorporating financial indicators into efficiency evaluation is reflected in the numerator of Eq. (1). Financing volumes are divided into two components due to the necessity of considering the time lag in the return-on investment period. Of course, this indicator ($I E_{\Sigma}$) cannot entirely replace traditional economic efficiency metrics and can be used to rank decarbonization proposals that require additional funding from diverse sources.
3.4 Comprehensive effectiveness evaluation model
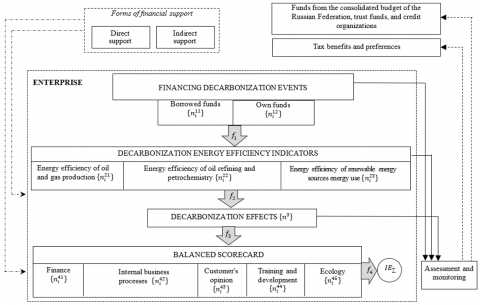
The methods and approaches discussed above for assessing the effectiveness of decarbonization measures in oil and gas companies underscore the importance of developing a methodology for evaluating the outcomes of decisions made and their implementation by these enterprises. Furthermore, it is crucial to consider how the execution of decarbonization measures impacts not only the enterprise’s cost dynamics and capital investments but also its competitiveness. With this foundation, we move on to discuss the author’s comprehensive model for evaluating the ecological and economic effectiveness of decarbonization measures for Russian oil and gas enterprises (see Figure 1).
Figure 1. A comprehensive model for evaluating the ecological and economic effectiveness of decarbonization measures for Russian oil and gas enterprises
Source: Compiled by the authors
The presented model enables oil and gas industry companies to analyze decarbonization efforts in three aspects:
1) Effectiveness analysis of each measure to reduce GHG emissions by changing the system of energy efficiency indicators for decarbonization to select the most effective measures (which would achieve the greatest impact).
Assessment of the efficacy of each measure for reducing greenhouse gas emissions uses both quantitative and qualitative methodologies. Quantitative techniques include measuring actual emissions reductions, cost savings, and improvements in energy efficiency. Qualitative evaluations involve expert assessments and stakeholder consultations to assess the perceived efficacy and practical challenges associated with implementing each measure.
2) Assessing the impact of decarbonization on the competitive position of the oil and gas industry using a Balanced Scorecard.
3) Implement proactive management measures for decarbonizing companies, including identifying and analyzing potential risks and opportunities related to climate change. These measures would allow companies to develop strategies to reduce risks and utilize identified opportunities for growth.
3.5 Data sources and selection criteria
The data for this study were obtained from various reliable databases, including annual company reports, sustainability reports, industry publications, and government databases. In particular, data collection focused on Russian oil and gas companies because of their significant impact on both the national economy and global energy markets.
The selection criteria for the sample of analyzed companies included:
- Companies that occupy a significant market share in the Russian oil and gas sector.
- Companies with accessible and comprehensive data on carbon dioxide emissions, financial indicators, and sustainable development initiatives.
- Inclusion of companies in various fields of activity, including mining, transportation and processing.
This approach allowed us to obtain a representative sample that reflected various activities and environmental impacts in the Russian oil and gas industry.
The sample size and scope of oil and gas companies included in this study encompassed large oil and gas corporations. In particular, emphasis is placed on publicly traded joint-stock companies listed on the Moscow Exchange that publish transparent financial statements, including reports on sustainable development. Nevertheless, the methodology employed in this study can be applied to other oil and gas enterprises, including smaller and independent companies. This will depend on the list and framework of the Balanced Scorecards proposed in this research. Consequently, it will become possible to use a reduced set of indicators for smaller companies in the future. These methods can serve as a foundation for future research.
In the context of the aforementioned model and to assess the effectiveness of decarbonization measures, the authors advocate the use of a comprehensive set of indicators. The proposed system facilitates the evaluation of the impact of such measures across various domains, including the following:
• Enhancing energy efficiency in oil and gas production;
• Improvement in energy efficiency in oil refining and petrochemicals;
• Advances in energy efficiency through renewable energy adoption.
Further, in this article, we explore several approaches for assessing the effectiveness of decarbonization measures. One such example is the cost-benefit analysis (CBA) [41]. The essence of this approach lies in comparing the costs of implementing decarbonization measures with the benefits they provide in terms of reducing enterprise greenhouse gas emissions.
The cost analysis method employed to assess the efficacy of decarbonization strategies involves the following stages:
1. Identification of all pertinent costs associated with the implementation of each decarbonization initiative.
2. Estimation of potential savings and benefits from reduced (GHG) emissions.
3. Calculation of net present value (NPV) and payback period for each initiative. 4. Comparison of these metrics to determine the cost efficiency of various initiatives. The benefits of this approach include its ability to provide a clear financial rationale for decarbonization endeavors and its versatility across diverse contexts.
Another approach is Life Cycle Assessment (LCA) [4], which evaluates the environmental impact of a product or process throughout its life cycle, from raw material extraction to disposal after use. Applying this method helps identify areas in an organization’s operations where CO2 emissions can be reduced, enabling informed decisions about decarbonization measures.
Decarbonization efforts encompass various aspects, including avoiding climate change-related damage, improving public health, and providing other benefits. However, these measures also incur costs, such as investment expenditures and operational expenses.
The LCA method, which is used to measure the carbon footprint of a product or process over its entire life, includes all stages from raw material extraction and processing to disposal after use.
The CBA and LCA have some limitations when compared to their application. For example, it is difficult to estimate non-market benefits, and there are uncertainties in cost and benefit estimates. That’s why it’s a good idea to use other analytical tools when assessing the effectiveness of decarbonization measures for oil and gas companies.
In this article, we propose the use of a balanced system of indicators that is modified and adapted for the assessment of decarbonization measures undertaken by oil and gas industry companies. This evaluation is grounded in the principles of the Balanced Scorecard (BSC) [50], which encompasses key perspectives such as “Finance”, “Internal Business Processes”, “Customer Feedback”, and “Learning and Development”. Furthermore, given the heightened environmental risks linked to the operations of oil and gas business structures, an additional component termed the “Ecology” perspective has been introduced specifically for oil and gas industry enterprises.
The integration of ecological metrics into the BSC system complements traditional environmental impact assessment methods, such as LCA, by providing a more comprehensive and practical approach to managing environmental performance. While LCA provides a thorough and holistic overview of the environmental effects associated with the complete life cycle of a product or process, from raw material extraction to production, use, and disposal, the BSC, with integrated ecological metrics, offers a strategic management instrument that translates these in-depth assessments into strategic objectives and performance indicators that are actionable. The results of LCA can be complex and technical and frequently require specialized knowledge to comprehend and take action. The BSC transforms these findings into clear, comprehensible metrics that can be more easily communicated to and understood by managers and other stakeholders.
LCA covers a wide range of environmental impacts, including greenhouse gas emissions, resource depletion, and toxicity. The ecological metrics in BSC focus specifically on key areas of environmental performance relevant to strategic goals, such as emission reduction, energy efficiency, and resource optimization. This targeted approach allows for prioritization of actions that align with environmental sustainability and business objectives. Traditional BSC dimensions, such as Financial, Customer, Internal Business Processes, and Learning & Growth, do not explicitly address environmental sustainability. By adding an “Ecology” dimension to the BSC, organizations can ensure that environmental performance is aligned with their strategic management framework. This explicitly focuses on environmental sustainability as a core strategic objective rather than a secondary consideration.
An additional “Ecology” dimension enhances the visibility of environmental objectives and metrics, ensuring that they receive adequate attention and resources. This also enhances accountability by clearly defining and tracking specific environmental goals and performance indicators within the BSC framework. The “Ecology” dimension allows integration of specific environmental metrics that synergize with other BSC aspects. For instance, improvements in energy efficiency (ecology metric) can result in cost savings (financial dimension), enhanced operational efficiency (internal business processes dimension), and improved corporate reputation (customer dimension). This holistic approach helps identify synergies between environmental sustainability and overall business success.
The inclusion of an “Ecology” dimension in the BSC provides flexibility for the model to adapt to industry-specific challenges and opportunities related to environmental issues. In the oil and gas sector, which has significant environmental impacts, a dedicated environmental dimension ensures that strategic initiatives are tailored to the unique challenges and requirements of this industry. By incorporating an ecological dimension into the BSC, this approach not only enhances the strategic management tool but also ensures a balanced consideration of economic and environmental performance. This integrated approach promotes sustainable business practices development and supports long-term strategic planning for the industry.
3.6 Indicator selection and weighing
To assess the effectiveness of measures to reduce carbon emissions, a method based on analyzing the impact of decarbonization indicators and the outcomes obtained from their implementation in a system of indicators for each management level is proposed. This approach can be applied to individual enterprises, for example, through a Balanced Scorecard tailored to their industry. Traditionally, balanced indicator systems for industrial enterprises consist of indicators grouped into four categories: “Finance”,“Internal Business Process”,“Customer Opinion”, and“Training & Development”. Given the significant environmental risks associated with oil and gas companies, it is recommended to add an additional category, “Ecology”, to their Balanced Scorecards.
The modified and adjusted Balanced Scorecard (BSC) system was developed based on an extensive literature review and consultation with industry experts. This modification involves the addition of a dedicated “Ecology” perspective to the traditional dimensions of the BSC, reflecting the specific environmental challenges faced by the oil and gas industry. This adjustment ensures that economic and environmental factors are adequately represented in the performance evaluation.
The proposed changes include specific metrics for environmental impact, such as greenhouse gas (GHG) emissions, energy consumption, and the use of renewable energy resources. The analyzed data sample includes information from major Russian oil and gas corporations, including Gazprom, Gazpromneft, Lukoil, Novatek, Rosneft, Surgutneftegas, and Tatneft. These organizations were chosen based on their relevance to the industry and their commitment to sustainability.
A system of balanced indicators is proposed for evaluating changes in oil and gas businesses that consider the implementation of measures to reduce carbon emissions. The proposed system is presented in detail in Table 1.
Table 1. The proposed system of balanced indicators for assessing the position of oil and gas enterprises
|
No. |
Indicator |
Unit of Measurement |
|
Finance |
||
|
1 |
Revenue |
Rub. |
|
2 |
The company’s profit before interest on loans, income tax and depreciation on fixed intangible assets |
Rub. |
|
3 |
The company’s profit margin before interest, income tax, and depreciation on fixed intangible assets |
% |
|
4 |
Total debt to company profits before interest on loans, income tax, and depreciation of fixed intangible assets |
% |
|
5 |
Net profit |
Rub. |
|
6 |
Profit growth rate |
% |
|
7 |
Capital expenditures |
Rub. |
|
8 |
Free cash flow |
Rub. |
|
9 |
Costs of scientific and technical work |
Rub. |
|
10 |
Number of patents received |
St. |
|
11 |
Labor productivity |
Rub./person |
|
12 |
The debt-to-equity ratio |
% |
|
13 |
Return on assets |
% |
|
14 |
Return on investment |
% |
|
15 |
The cost of producing one unit of finished products |
Rub./tons production |
|
Internal Business Process |
||
|
1 |
Oil and gas condensate production |
Million Barr. oil equivalent or beyond tons |
|
2 |
Gas production |
Million Cube. m |
|
3 |
Production of petroleum products at refineries |
Thousand tons |
|
4 |
Oil production |
Thousand tons |
|
5 |
Production of petrochemical products for sale |
Thousand tons |
|
6 |
Volume of balance oil reserves |
Million. Barr. |
|
7 |
Primary oil refining |
Thousand tons |
|
8 |
Oil refining depth |
Thousand tons |
|
9 |
The share of deep processing products in the total volume of production |
% |
|
Customer Opinion |
||
|
1 |
Total domestic market sales |
Thousand tons |
|
2 |
Total sales in export markets |
Thousand tons |
|
3 |
Share of exported products in total volume of shipped goods |
% |
|
4 |
Percentage of sales of new product and service |
% |
|
5 |
Percentage of sales to regular customers |
% |
|
6 |
The company’s market share |
% |
|
Training and Development |
||
|
1 |
Frame refresh rate |
% |
|
2 |
Staff turnover rate |
% |
|
3 |
Average number of hours allocated to additional vocational education during a certain period |
Hours |
|
4 |
Percentage of employees who have completed advanced training programs compared to the average number of employees per year |
% |
|
5 |
Employee satisfaction assessment |
% |
|
6 |
Labor productivity coefficient |
% |
|
Ecology |
||
|
1 |
Environmental fines paid (in monetary terms) |
Rub. |
|
2 |
Energy consumption during production |
Million gigajoules |
|
3 |
Energy intensity of oil refining |
Gigajoules / tons of manufactured products |
|
4 |
Energy intensity of petrochemicals |
Gigajoules / tons of processed basic raw materials |
|
5 |
Installed capacity of renewable energy-generating equipment |
Megawatt |
|
6 |
Total renewable energy production |
Million kWh |
|
7 |
Percentage of electricity generation from renewable energy sources in terms of the total volume of electricity generation |
% |
|
8 |
Volume of investments in renewable energy development |
Rub. |
|
9 |
Share of capital investments in renewable energy projects |
% |
|
10 |
Volume of the associated petroleum gas flaring |
Million Cube. m |
|
11 |
APG usage level |
% |
|
12 |
Volume of methane emissions |
Million tons of CO2-equivalents |
|
13 |
Performing technical measures to prevent methane emissions |
Yes or no |
|
14 |
Greenhouse gas emissions (Coverage 1+Coverage 2) |
Million tons of CO2-equivalents |
|
15 |
Financing environmental safety programs |
Million Rub. |
|
16 |
Pollutant emissions into the atmosphere |
Thousand tons |
|
17 |
Discharge of polluted wastewater |
Million. Cube. m |
|
18. |
Water consumption for internal use |
Million. Cube. m |
|
19 |
Restoration of polluted lands |
Hectare |
|
20 |
Water intake and reception |
Million. Cube. m |
|
21 |
Volume of waste generated during the reporting year |
Thousand tons |
|
22 |
Volume of oil spilled during accidents |
Tons |
Source: Compiled by the authors
Selecting and weighing indicators within the framework of the BSC approach.
The BSC approach was used to assess the effectiveness of decarbonization measures. The selection of indicators may include the following steps:
- Analysis of annual reports of oil and gas companies.
- Consulting with industry experts and academic researchers.
- Taking into account data from environmental organizations and regulatory authorities to ensure that indicators are consistent with broader sustainable development goals.
- Analysis of retrospective production data from oil and gas companies and industry standards to identify indicators that significantly affect sustainability and emission reduction goals.
Oil and gas companies can achieve a comprehensive understanding of their operations through the use of a Balanced Scorecard that considers the impact of CO2 emissions on various aspects of their business.
3.7 Efficiency indicator formula
To evaluate the effectiveness of decarbonization measures implemented by oil and gas industry companies, the authors suggest employing a comprehensive efficiency indicator. This indicator is recommended for use within the framework of the model outlined in Figure 1 and mirrors the impact of decarbonization on the core operational processes of an oil and gas enterprise. Then, it can be calculated using Eq. (1):
$I E_{\Sigma}=\frac{\left(\sum_{s=1}^S \sum_{w=1}^W N_{s w} M_{s w}\right)}{\left(C_I+C_t\right) A}$ (1)
where,
• $N_{s w}$ is the change in the value of the s-th indicator of the w-th group of the BSC (IE=1...A);
• $M_{s w}$ is the weighting factor of the significance of the s-th indicator in the w-th group;
• $C_I$ is the amount of investment in decarbonization during a specified time period;
• $C_t$ is the current decarbonization cost during the specified time interval;
•A is the total number of indicators considered.
$N_{s w}$ represents the observed change in the value of the s-th indicator within the w-th group of the BSC. This change is measured by comparing the indicator's value before and after the implementation of decarbonization measures. For instance, if an indicator measures the amount of CO₂ emissions reduced, would be the difference in CO₂ emission levels pre- and post-intervention.
In Eq. (1), the weighting factor for the significance of each indicator is determined based on the following factors:
1. Expert judgment from industry professionals and academic researchers.
2. Stakeholder input, including feedback from environmental organizations and regulatory bodies.
3. Historical performance data and industry standards.
Indicators that significantly contribute to achieving sustainable development and emission reduction goals can be assigned higher weights.
$C_I$ represents the total financial investment allocated to decarbonization projects within the specified time frame. This can be quantified in monetary terms by considering all capital expenditures related to decarbonization efforts, such as equipment upgrades, the implementation of new technologies, research and development funding.
$C_t$ refers to the ongoing operational costs associated with the implementation of decarbonization measures are included in this calculation. This includes costs associated with the maintenance, monitoring, and management of decarbonization projects, expressed in monetary terms over a specified period.
A denotes the total number of indicators included in the comprehensive efficiency assessment. This list includes all indicators considered in the evaluation process, providing a comprehensive analysis covering various dimensions of decarbonization initiatives.
The integral indicator proposed by the authors of this article within the framework of the model for analyzing the effectiveness of decarbonization measures at enterprises in the Russian oil and gas industry can serve various purposes, including:
• Justifying additional funding for decarbonization projects from various sources;
• Evaluating the effectiveness and continuous monitoring of carbon reduction initiatives;
• Tracking projects targeting carbon footprint reduction;
• Enhancing the rationality of decision-making regarding the economic aspects of decarbonization at the enterprise level;
• Identifying, mitigating, and monitoring economic risks associated with measures to reduce the carbon footprint;
• Prioritizing and ranking actions to reduce carbon dioxide emissions.
Limitations and assumptions in the development of the integrated performance indicator $I E_{\Sigma}$.
Several limitations and assumptions were considered when developing the Integrated Performance Indicator $I E_{\Sigma}$:
- The accuracy of the indicator largely depends on the availability and quality of data from the selected companies. Any gaps or inconsistencies in the data may affect the results.
- The values assigned to each indicator are static and may not fully reflect the dynamic nature of the industry and the external factors influencing decarbonization efforts.
- The model is adapted for the Russian oil and gas sector, which may limit its applicability to other sectors or geographical regions with different regulatory frameworks and market dynamics.
- The model simplifies the calculation of decarbonization investment and operating costs, which may not account for all possible economic variables.
- The model assumes a linear relationship between indicators and overall efficiency, which does not always correspond to reality in real scenarios.
By defining and quantifying each component in the comprehensive efficiency indicator, this study provides a clear and structured approach to assessing the effectiveness of measures to reduce carbon emissions in the oil and gas sector. This indicator establishes a robust framework that integrates both environmental and economic factors, facilitating more informed and strategic decision-making processes.
In summary, this article highlights the importance of developing effective strategies to reduce emissions from the oil and gas industry.
4.1 Global emissions and production trends in the oil and gas sector
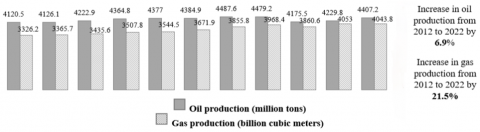
The oil and gas sector accounted for approximately 52.8% of total global emissions at the end of 2022. Due to the continued reliance on hydrocarbons for the production of finished goods, additional carbon dioxide emissions were generated [51]. Furthermore, in recent years, despite the challenges posed by the COVID-19 pandemic, there has been a significant increase in the actual volume of oil and gas production. Between 2012 and 2022, for example, global oil production rose by 6.9% and natural gas output increased by 21.5% (see Figure 2) [52].
Figure 2. Dynamics of oil and gas production in the world for the period 2012-2022
Source: Compiled by the authors using [52]
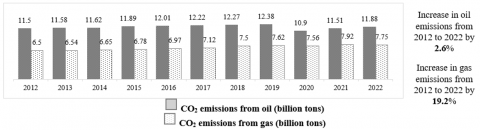
As a result, greenhouse gases in the oil and gas industries have increased. Emissions from oil production increased by 2.6% during the same period, whereas carbon dioxide emissions from natural gas production increased by 19.2% (refer to Figure 3).
Figure 3. Dynamics of CO₂ emissions from oil and gas production for the period 2012-2022
Source: Compiled by the authors using [51]
Simultaneously, it's crucial to highlight the dispersion of greenhouse gas emissions throughout the value chain within the oil and gas sector. In contemporary circumstances, this aspect has become a pivotal factor in formulating business strategies for oil and gas enterprises and crafting measures to curtail their carbon footprint.
The primary contributors to greenhouse gas emissions within the oil and gas sector supply chain are the production processes, particularly methane leaks, venting, fugitive emissions, and gas flaring. These emissions are classified under Scope 1 and 2, which are direct emissions from oil and gas activities, including production, transport, and processing. In 2022, these emissions accounted for approximately 15% of the total energy-related greenhouse gas emissions globally, equivalent to 5.1 billion tons of CO₂-equivalent [53].
Methane emissions alone constitute over half of these emissions for Scopes 1 and 2. In addition to direct emissions, Scope 3 emissions, which occur up- and down the value chain but are not produced directly by oil and gas companies, present a significant challenge. The majority of Scope 3 emissions originate from customers’ use of oil and gas products, accounting for another 40% of emissions [54, 55].
Energy consumption across the value chain, including refining, natural gas processing, and midstream operations, contributes to approximately 15% of emissions. Furthermore, emissions from refining and other oil and gas processes also add to the overall greenhouse gas emissions.
4.2 Strategies for reducing emissions
Considering the facts, Russian oil and gas enterprises must incorporate climate change considerations into their business strategies and disclose their plans to mitigate their carbon footprint. This includes addressing methane emissions and adopting comprehensive measures to reduce overall emissions.
To align with the International Energy Agency's Net Zero Emissions by 2050 Scenario, the emissions intensity of oil and gas operations needs to decrease by 50% by the end of the decade. Achieving this reduction requires the implementation of several key measures:
• Tackling methane emissions through better detection and repair of leaks.
• Eliminating non-emergency flaring practices.
• Electrifying upstream facilities using low-emissions electricity.
• Equipping oil and gas processes using carbon capture, utilization, and storage (CCUS) technologies.
• Expanding the use of hydrogen from low-emissions electrolysis in refineries.
By integrating these strategies, Russian oil and gas enterprises can effectively reduce their greenhouse gas emissions, contribute to global climate goals, and enhance their competitiveness in an increasingly carbon-conscious market.
The table below provides a concise overview of these strategies and their impact on three key areas of GHG emissions: Scope 1 (direct emissions from owned or operated sources), Scope 2 (indirect emissions from purchased electricity, heat, or steam), and Scope 3 (other indirect emissions throughout the value chain, including product transportation) (Table 2).
Table 2. The scope of decarbonization methods used in the oil and gas industry
|
Scope 1 |
Scope 2 |
Scope 3 |
|
1. Improving operational efficiency |
1. Cooperation with electricity and heat suppliers to reduce carbon dioxide emissions |
1. Optimization of asset portfolios (diversification into the gas business, renewable energy sources, hydrogen, etc.) |
|
2. Energy-efficient production equipment |
2. Improving the energy efficiency of buildings, as well as production facilities and workshops |
2. Trading in carbon permits or loans |
|
3. Recycling, reuse, and use of secondary energy resources |
3. Use of renewable energy sources |
3. Reduction of carbon dioxide emissions through investments in land use based on regenerative technologies |
|
4. Cooperation with suppliers of equipment and services for production to reduce carbon dioxide emissions |
4. The use of energy storage and storage methods |
4. Carbon capture, storage, and use (burial) |
|
5. Reduction in the associated petroleum gas combustion |
5. Use of hydrogen for their own needs |
5. Direct capture of carbon dioxide from the air |
|
6. Reducing methane leaks |
6. Use of hydrogen for their own needs |
6. CO2-EOR (method of injection of carbon dioxide under pressure into the reservoir) |
|
7. Steam recovery plants and reducing methane leaks from large tanks |
|
7. Use of bioenergy generated with carbon capture and storage technology (CCS) |
|
8. Monitoring of uncontrolled emissions into the atmosphere at idle wells |
|
8. Carbon capture and hydrogen usage in the value chain |
|
|
|
9. Other innovative decarburization technologies |
Source: Compiled by the authors using [33]
4.3 Decarbonization methods and their scopes
Some of these methods include improving operational efficiency, reducing methane leaks, and producing and selling hydrogen. Companies can also optimize their asset portfolios, trade carbon permits or credits, or invest in land use based on renewable technologies to reduce their carbon footprint.
The oil and gas industry has significantly contributed to Russia’s total carbon emissions. In 2022, the industry's emissions reached 1197.16 million tons of CO2-equivalents, accounting for approximately 38.6% of the country's total greenhouse gas emissions [51]. This substantial emissions level in the oil and gas sector can be attributed to various factors, including the extraction and processing of fossil fuels, the transportation of oil and gas via pipelines, and the combustion of associated gases in flares. Therefore, reducing greenhouse gas emissions within the oil and gas industry is of paramount importance for achieving Russia's climate objectives. It necessitates collaborative efforts between businesses and the government to mitigate the impact of climate change.
4.4 Emissions reduction efforts of Russian oil and gas companies
Oil and gas enterprises, both international and Russian, are at the forefront of adopting decarbonization strategies and sharing information willingly. Frequently, they go beyond governmental requirements by actively embracing decarbonization strategies or blueprints, as well as employing internal methodologies to assess the cost of CO2-equivalents in their investment ventures.
Some of Russia's largest oil and gas companies, such as PJSC Gazprom, PJSC Rosneft, Lukoil, Tatneft, and Novatek, have taken significant steps toward making their operations more environmentally friendly and reducing greenhouse gas emissions. These companies have implemented some measures, including improvements to energy efficiency, optimization of the use of associated petroleum gas, diversification of business activities, investments in renewable energy, and reforestation initiatives. These efforts are incorporated into their corporate planning and reporting processes, with a focus on establishing systems to account for greenhouse gas emissions and reduce the overall carbon footprint of their operations.
The key measures for minimizing greenhouse gas emissions by oil and gas industry companies in Russia are presented in Table 3.
The main measures to reduce greenhouse gas emissions from oil and gas operations in Russia are summarized in Table 3. These measures form an integral part of our research framework, providing practical data for evaluating the impact of decarbonization efforts. These measures are designed to reduce carbon dioxide (CO2) emissions, develop strategies for the use of renewable energy resources, and mitigate emissions throughout the supply chain of these businesses.
Table 3. Key measures to lower greenhouse gas emissions by oil and gas sector companies in Russia by 2022
|
Company |
Measure |
|
PJSC “Gazprom” |
Reduction of specific carbon dioxide emissions by 11.2% by 2030. |
|
PJSC“NK “Rosneft” |
The company has implemented some carbon management initiatives to reduce greenhouse gas emissions by 11% compared with the 2020 baseline. The company’s subsidiaries use cutting-edge technology, including unmanned aerial vehicles and portable equipment, for surface inspections to detect methane emissions. Rosneft is continuing its progress toward achieving the 2035 targets and exploring ways to further reduce emissions by leveraging new low-carbon technologies. |
|
PJSC ‘Tatneft” |
Reduce carbon intensity by 14% by 2025 and by 30% by 2030 (based on 2022). |
|
PJSC “Novatek” |
279 million rubles: volume of investments in renewable energy in 2022. 625 thousand tons of CO2-equivalents: reduction in direct greenhouse gas emissions. 23,206 thousand: kWh energy consumption from renewable energy sources in 2022 (209 thousand kWh in 2021). |
Source: Compiled by the authors using [33, 56-59]
Table 3 presents the key measures for minimizing greenhouse gas emissions in the Russian oil and gas industry. Each measure has been interpreted in the context of the research framework by comparing it to specific indicators within the BSC. For instance, measures aimed at monitoring and reducing carbon dioxide and methane emissions, as well as investing in renewable energy sources, are associated with the“Ecology”dimension.
In addition to the primary measures mentioned above aimed at reducing greenhouse pollutant emissions in the Russian oil and gas sector, these companies also evaluate the effectiveness of their climate change mitigation efforts using the Global Reporting Initiative (GRI). GRI is a standardized set of recommendations for reporting in the realm of sustainable development. The latest version (G4) covers categories related to corporate adaptation and climate change responses. Employing these approaches in corporate reporting enhances the reliability of information on climate and environmental policies implemented by management. Furthermore, it allows for the consideration of additional financial costs required to enhance the effectiveness of decarbonization measures for oil and gas enterprises.
5.1 Practical examples and implications of decarbonization strategies for the oil and gas industry
Table 4 presents exemplar decarbonization indicators pertinent to oil and gas industry enterprises and the effects to be evaluated during the implementation of a decarbonization measure. By leveraging these proposed indicators, the extent of change in each decarbonization effect can be computed, and their cumulative value enables the ranking of decarbonization measures based on their effectiveness. Subsequently, considering the available financial resources, the company determines specific measures to be implemented to reduce CO2-equivalents emissions.
The examples given above are generally common among listed enterprises because they reflect the efforts of these companies to minimize their carbon footprint, adhere to sustainable development principles and take care of the environment.
Table 4. Examples of decarbonization indicators for oil and gas industry enterprises
|
Decarbonization Spheres |
Decarbonization Indicators |
Decarbonization Effects |
|
Energy efficiency of oil and gas production |
Useful use of APG Drilling optimization Saving fuel and energy resources |
Reduce direct greenhouse gas emissions from stationary combustion of fuel for personal needs and flaring, and from purchased electricity. (Scope 1) Preventing greenhouse gas emissions by reducing consumption of purchased electricity. (Scope 2) |
|
Energy efficiency of oil refining and petrochemistry |
Modernization of equipment and optimization of technological processes Saving fuel and energy resources Exclusion of liquid fuel consumption |
Reduce direct CO2 emissions. (Scope 1) Prevent GHG emissions by reducing consumption of purchased electricity. (Scope 2) |
|
Energy efficiency of renewable energy use |
Construction of energy facilities using renewable energy sources Saving fuel and energy resources |
Prevent CO2 emissions using renewable energy sources and by reducing consumption of purchased electricity. (Scope 2) Bioenergy with carbon capture and storage technology (BECCS). (Scope 3) Optimize asset portfolios by diversifying gas, renewable energy sources, hydrogen, etc. (Scope 3) |
Source: Compiled by the authors using [35, 56-61]
Table 4 presents data from various oil and gas companies, representing a more diverse sample of industry practices. These data reflect the varied strategies and performance of different companies, providing a holistic view of decarbonization initiatives.
The carbon emission indicators above, along with their related effects, can be used to predict how an oil and gas company will develop. They assist in identifying areas of operation that require enhancement within the framework of a sustainable development strategy and the reduction of the enterprise's carbon footprint.
As previously noted, decarbonization measures implemented by oil and gas companies entail increased costs and capital investments. These factors can exert a detrimental influence on the enterprise's competitiveness both currently and in the future. Therefore, it is advisable to enhance the assessment of decarbonization measures by incorporating an approach that considers alterations in the competitive position of oil and gas enterprises. This evaluation was based on a Balanced Scorecard system. For instance, a project that targets the reduction of CO2-equivalents emissions may yield positive environmental outcomes but may also result in short-term cost escalation, negatively affecting the company's financial outlook. Consequently, it is essential to analyze the comprehensive impact of the project on all facets of the Balanced Scorecard system to gauge its overall effectiveness.
While an environmental perspective is inherent in the assessment of decarbonization, this study emphasizes the integration of ecological and economic factors. This dual approach ensures a more thorough evaluation of decarbonization measures by addressing both the immediate impact on the environment and long-term economic viability.
This research makes a significant contribution by developing a novel model that integrates environmental and economic considerations into the evaluation of measures to reduce carbon emissions. Unlike traditional methods, which often treat these factors separately, our approach provides a comprehensive framework that can be tailored to different contexts within the oil and gas sector.
The primary advantage of this research methodology lies in its capacity to conduct a multidimensional analysis of decarbonization initiatives. By using a modified BSC framework, this study captures a broad spectrum of performance indicators, providing a balanced perspective on environmental and financial outcomes. This method outperforms other approaches that focus solely on financial metrics or environmental impacts.
5.2 Comparison with previous research
A comparison of the findings of this study with those of previous studies reveals similarities and advances in the following areas:
• Integrating environmental ethics into the performance evaluation framework aligns with the trends in sustainable development research. Previous studies have emphasized the significance of incorporating ecological factors into business strategies.
• This study advances the methodological approach by specifically adapting the Balanced Scorecard for use in the oil and gas industry and introducing a comprehensive indicator of efficiency that considers both environmental and economic aspects.
This dual-focus approach provides a more comprehensive assessment than traditional methods that often prioritize one aspect over the other.
5.3 Limitations of the model
Although the comprehensive efficiency indicator $I E_{\Sigma}$ proposed in this study provides a robust framework for assessing decarbonization initiatives in the Russian oil and gas industry, several limitations must be recognized. First and foremost, the applicability of the model may be restricted beyond the Russian context due to regional variations in regulatory frameworks, technological developments, and market dynamics. Specifically, the weighting factors used in the Balanced Scorecard approach are tailored to the unique circumstances and priorities of Russian companies and may require adaptation for use in other jurisdictions. Secondly, the model relies on expert judgment and stakeholder input to determine the significance of various indicators, which introduces a certain degree of subjectivity. Although efforts were made to minimize this by engaging with a diverse range of stakeholders, inherent biases cannot be entirely eliminated. Additionally, the model assumes that all businesses have equal access to decarbonization technologies and financial resources, which may not always be the case, particularly for smaller and independent companies. The findings of this research have significant implications for policymakers and industry professionals. For policymakers, the comprehensive efficiency indicator could serve as a useful tool for evaluating the effectiveness of existing regulations and identifying potential areas for additional support or incentives. For industry professionals, the model offers a structured approach for prioritizing and assessing decarbonization efforts, helping corporate strategies to align with wider environmental goals.
5.4 Future research opportunities
Further research could explore various aspects of the proposed model, including its potential applications in different industries and regions, as well as its impact on broader economic and environmental outcomes. Additionally, studies could examine the feasibility of implementing the model on a larger scale and its potential for integration with other policy tools. Future research should focus on improving the comprehensive efficiency indicator to increase its applicability in various regions and sectors. This involves developing region-specific weighting factors and including additional variables that consider local market conditions and regulatory frameworks. Additionally, longitudinal studies are necessary to assess the long-term effects of decarbonization efforts and validate the effectiveness of the proposed model. Comparisons between countries and industries can also provide valuable insights into the transferability of findings and identify best practices that can be applied globally.
6.1 Advantages
The main strength of this study is its integrated approach, which considers both environmental and economic factors when assessing decarbonization strategies. This integrated focus ensures that the analysis considers the full range of implications of these measures.
Using a custom-designed BSC specifically designed for the oil and gas industry provides a robust and structured approach to evaluating decarbonization initiatives. The BSC incorporates an “Ecology” dimension, addressing sector-specific environmental concerns and offering a comprehensive assessment tool aligned with corporate sustainability goals and regulatory requirements.
Introducing the comprehensive efficiency indicator $I E_{\Sigma}$, this tool facilitates a quantitative assessment of decarbonization efforts. Allows for a quantitative assessment of decarbonization efforts and provides a clear measure to evaluate the effectiveness of various measures. This metric helps justify additional funding, monitoring ongoing projects, and improving decision-making processes.
By assessing the impact of decarbonization initiatives on competitive positioning, the model helps oil and gas companies align their sustainability efforts with broader business strategies. This integration fosters a more comprehensive approach to corporate governance and strategic planning.
6.2 Limitations
The reliability of the model results depends heavily on the quality and consistency of the data provided by the companies. Variations in data reporting standards and measurement methods can lead to inconsistencies and affect the accuracy of results.
Although the model was developed with the Russian oil and gas sector in mind, specific economic and regulatory circumstances may limit its applicability to other regions or sectors. Differences in market conditions, regulatory frameworks, and technological developments can influence the suitability of the model to other contexts.
Given that the sample size and range of enterprises examined in this study may not fully represent the diversity within the oil and gas industry, smaller or independent companies may encounter different challenges and opportunities than larger, integrated corporations. This could affect the validity of the findings.
6.3 Theoretical implications
The integration of environmental and economic considerations into the model’s development may be relevant to other sectors in which similar considerations are important. However, it is essential to acknowledge that the specific circumstances of each industry may require a tailored approach. This research contributes to the theoretical understanding of decarbonization in the oil and gas industry by incorporating environmental considerations into traditional economic analysis frameworks. The modified Balanced Scorecard, augmented with an“Ecology”dimension, bridges the gap between environmental accountability and economic performance, providing a more holistic perspective on a company's operations. This integration facilitates a more comprehensive evaluation of sustainability efforts.
The creation and implementation of the integrated efficiency measure $I E_{\Sigma}$ allow for a more informed decision-making process.
By quantifying the impact of decarbonization measures, this indicator provides a practical tool for decision makers and enhances the rationale and transparency of sustainability-related decisions. This approach is in line with the increasing demand for evidence-based decision making in corporate sustainability.
The emphasis on competitive positioning and strategic alignment in the model highlights the significance of integrating sustainability into business strategies. This viewpoint enriches the literature on strategic management by demonstrating how environmental initiatives influence competitive dynamics and long-term business viability. This study underscores the strategic significance of decarbonization, establishing it as a crucial component of corporate strategy instead of a peripheral concern.
The theoretical framework and methodologies presented in this study form a basis for future research into sustainable development and carbon reduction. Subsequent studies can build on this model to investigate its suitability in different settings, industries, and locations. Furthermore, this research provides an opportunity to examine the interaction between various sustainability indicators and their collective impact on corporate performance.
As a result of this investigation, a model was proposed to assess the effectiveness of decarbonization initiatives at Russian oil and gas companies. The analysis considered the broader context of oil and gas production worldwide and revealed that the economic recovery following the 2020 global pandemic led to an increase in oil and gas consumption, which in turn contributed to higher CO₂ emissions. Additionally, by examining the distribution of CO₂ emissions along the value chain in the oil and gas sector, we found that most CO₂ emissions originate from methane emissions generated during production at oil and gas facilities.
This study also examines the approaches adopted by international oil and gas companies for reducing CO2-equivalents emissions, categorized by scope. Upon analyzing the measures taken by Russian oil and gas companies to reduce their carbon footprint, it was observed that these enterprises encounter challenges in assessing and analyzing the effectiveness of their decarbonization efforts, mainly due to increased costs and capital investments associated with such measures. To address this issue, CBA and LCA approaches were considered and evaluated. The analysis revealed that they have limitations, primarily related to the complexity of assessing and analyzing the effectiveness of decarbonization measures for oil and gas enterprises. Therefore, it is recommended that these approaches be used in conjunction with other assessment tools and methods.
To analyze the effectiveness of decarbonization measures for Russian oil and gas industry enterprises, a model is proposed that includes a set of decarbonization indicators for these enterprises to determine the areas of decarbonization and the effects of such measures. A set of indicators is suggested based on a modified version of the Balanced Scorecard, with the addition of an "Ecology" section for evaluating decarbonization efforts in the Russian oil and gas industry. Within the framework of this model for analyzing the effectiveness of decarbonization measures at oil and gas industry enterprises, a quantitative assessment tool is proposed in the form of an integral indicator reflecting the impact of these measures on their core processes. The proposed model for analyzing the effectiveness of decarbonization measures for Russian oil and gas industry enterprises can enhance decision-making efficiency in implementing decarbonization and carbon footprint reduction strategies.
The article, with its content, approaches, methods, suggestions, recommendations, and conclusions, makes a significant scientific contribution to the sustainability of oil and gas businesses in Russia. It provides both a theoretical foundation and practical guidance for enhancing competitiveness while adapting to the challenges of climate change and transitioning to a low-carbon economy.
The model introduced in this article, along with the modified Balanced Scorecard system and the integral indicator designed to assess the effectiveness of decarbonization measures for oil and gas industry firms, make noteworthy contributions to the field of climate change adaptation management. These contributions offer a systematic approach that allows companies to evaluate their competitiveness and efficiency in terms of efforts to reduce their carbon footprint.
The findings of this research, while specifically focusing on Russian oil and gas firms, have wider implications for the international industry. The comprehensive model can be adapted to evaluate decarbonization measures in various geographical and regulatory settings, providing valuable information for oil and gas organizations worldwide.
This study was financed by a grant from the Plekhanov Russian University of Economics.
[1] Mitrova, T., Khokhlov, A., Melnikov, Y., Perdero, A., Melnikova, M., Zalyubovsky, E. (2020). Global climatic threat and russian economy: Searching for the way. SKOLKOVO Energy Centre. https://doi.org/10.13140/RG.2.2.11392.66567
[2] Masson-Delmotte, V., Pörtner, H.O., Skea, J. (2019). Global Warming by 1.5℃. Geneva, Intergovernmental Panel on Climate Change.
[3] CODEX (2021). Electronic fund legal and regulatory technical documents. [On the Strategy for the socio-economic development of the Russian Federation with low greenhouse gas emissions until 2050]. https://docs.cntd.ru/document/726639341, accessed on May 15, 2024.
[4] Curran, M.A. (2018). Life cycle assessment-theory and practice. The International Journal of Life Cycle Assessment, 23(7): 1517-1519. https://doi.org/10.1007/s11367-018-1461-9
[5] Kulyasova, E.V. (2020). Digitalization of the chemical industry: Strategy and mechanism. Universum (In Russian). pp. 119-134.
[6] Mukataeva, Z., Dinmukhamedova, A., Kabieva, S., Baidalinova, B., Khamzina, S., Zekenova, L., Aizman, R. (2023). Comparative characteristics of developing morphofunctional features of schoolchildren from different climatic and geographical regions. Journal of Pediatric Endocrinology and Metabolism, 36(2): 158-166. https://doi.org/10.1515/jpem-2022-0474
[7] Lee, S. (2011). Corporate carbon strategies in responding to climate change. Business Strategy and the Environment, 21(1): 33-48. https://doi.org/10.1002/bse.711
[8] Durmagambetov, A. (2010). Application of analytic functions to the global solvabilty of the Cauchy problem for equations of Navier-Stokes. Natural Science, 2(4): 338-356. https://doi.org/10.4236/ns.2010.24042
[9] Sahakyan, N. (2023). Financial information issues of business impacts on climate change. Economics, Finance and Accounting, 2(12): 129-140. https://doi.org/10.59503/29538009-2023.2.12-129
[10] Unter, K.M.M., Park, S., Rivera, J. (2023). Business response strategies to climate change: An integrative and research frontiers outlook. Organization & Environment, 37(2): 325-357. https://doi.org/10.1177/10860266231202819
[11] Valeria, N., Giovanna, C. (2022). Effectiveness of business practices related to climate change as a driver for improving environmental performance. American Journal of Applied Sciences, 19(1): 21-33. https://doi.org/10.3844/ajassp.2022.21.33
[12] Chandy, R., Dowell, G., Mayer, C., Plambeck, E., Serafeim, G., Toffel, M.W., Toktay, L.B., Weber, E. (2023). Introduction to the special section on business and climate change. Management Science, 69(12): 7347-7351. https://doi.org/10.1287/mnsc.2023.intro.v69.n12
[13] Perlin, A.P., Gomes, C.M., Motke, F.D., Kruglianskas, I., Zaluski, F.C. (2022). Climate change mitigation, adaptation practices, and business performance in Brazilian Industrial Companies. Sustainability, 14(18): 11506. https://doi.org/10.3390/su141811506
[14] Dorogov, N.I., Kulyasov, N.S. (2023). The current climate agenda and ways to decarbonize the Russian economy. In: Priority Directions of Science Development in the Modern World. LLC Scientific Publishing Center“Bulletin of Science”, Ufa. pp. 43-48. https://perviy-vestnik.ru/wp-content/uploads/2023/03/2023-K-358-03_23.pdf, accessed on May 15, 2024.
[15] Vygon, G., Ezhov, S., Kolbikova, E., Lebedskoy-Tambiev, A., Kostyuk, R. (2021). Euro Tour: Issue price. VYGON Consulting, 1-51. https://vygon-consulting.ru/upload/iblock/f1e/fsslfi73x3khnz0tcb6sxlq70go5nfim/vygon_consulting_energy_transition.pdf.
[16] S&P Global Platts. (2022). bp Statistical review of world energy. 71st Edition. https://www.bp.com/content/dam/bp/business-sites/en/global/corporate/pdfs/energy-economics/statistical-review/bp-stats-review-2022-full-report.pdf, accessed on May 15, 2024.
[17] Kholodionova, A.S., Kulik, A.A. (2022). Key decarbonization aspects of Russian petroleum industry. Ekspozitsiya Neft’Gaz, 102-106. https://doi.org/10.24412/2076-6785-2022-7-102-106
[18] Wang, Z.J., Li, S.Y., Jin, Z.J., Li, Z.M., Liu, Q.Y., Zhang, K.Q. (2023). Oil and gas pathway to net-zero: Review and outlook. Energy Strategy Reviews, 45: 101048. https://doi.org/10.1016/j.esr.2022.101048
[19] Mathur, S., Gosnell, G., Sovacool, B.K., Del Rio, D.D.F., Griffiths, S., Bazilian, M., Kim, J. (2022). Industrial decarbonization via natural gas: A critical and systematic review of developments, socio-technical systems and policy options. Energy Research & Social Science, 90: 102638. https://doi.org/10.1016/j.erss.2022.102638
[20] Riabova, M.I. (2023). Strategies of the russian oil and gas companies at the era of energy transition. MGIMO Review of International Relations, 16(1): 219-243. https://doi.org/10.24833/2071-8160-2023-1-88-219-243
[21] Cruz, C.S., Stimpson, S. (2022). Keeping the lights on: Oil and gas development in a low-carbon world. Journal of Energy & Natural Resources Law, 40(4): 491-494. https://doi.org/10.1080/02646811.2022.2093007
[22] Torres, C.M., Fernandez, E.F.Y., Frutuoso, L.F.M., De Oliveira, H.G., De Almeida, E. (2022). Roadmap decarbonization in the value chain of the oil and gas industry. In Rio Oil & Gas Expo and Conference 2022. Technical Paper. Rio Oil & Gas, 22: 194-195. https://doi.org/10.48072/2525-7579.rog.2022.194
[23] Gryniuk, O. (2022). Identification of risk of decarbonization of the oil and gas industry. Vìsnik Hmelʹnicʹkogo Nacìonalʹnogo Unìversitetu. Ekonomìčnì Nauki, 308(4): 185-191. https://doi.org/10.31891/2307-5740-2022-308-4-29
[24] Blam, I.Y., Kovalev, S.Y. (2024). Different modes of provisioning decarbonization of the oil and gas industry in modern societies. Journal of Siberian Federal University. Humanities and Social Sciences, 17(3): 457-464.
[25] Singh, H., Li, C., Cheng, P., Wang, X., Hao, G., Liu, Q. (2023). Real-time optimization and decarbonization of oil and gas production value chain enabled by Industry 4.0 Technologies: A critical review. SPE Production & Operations, 38(3): 433-451. https://doi.org/10.2118/214301-pa
[26] García, J.L.S., Sanz, J.M.D. (2018). Climate change, ethics and sustainability: An innovative approach. Journal of Innovation & Knowledge/Journal of Innovation and Knowledge, 3(2): 70-75. https://doi.org/10.1016/j.jik.2017.12.002
[27] Xiang, H., Lu, J., Kosov, M.E., Volkova, M.V., Ponkratov, V.V., Masterov, A.I., Elyakova, I.D., Popkov, S.Y., Taburov, D.Y., Lazareva, N.V., Muda, I., Vasiljeva, M.V., Zekiy, A.O. (2023). Sustainable development of employee lifecycle management in the Age of Global Challenges: Evidence from China, Russia, and Indonesia. Sustainability, 15(6): 4987. https://doi.org/10.3390/su15064987
[28] Rina, L. (2023). The achievement of Sustainable Development Goals (SDGs) in social, economic, and environmental aspects: The role of the private sector in tourism villages. In IOP Conference Series: Earth and Environmental Science. 1248(1): 012009. https://doi.org/10.1088/1755-1315/1248/1/012009
[29] Kim, D., Lee, J. (2016). Development of a Web-Based tool for climate change risk assessment in the business sector. Sustainability, 8(10): 1013. https://doi.org/10.3390/su8101013
[30] Cherepovitsyn, A., Rutenko, E. (2022). Strategic planning of oil and gas companies: The decarbonization transition. Energies, 15(17): 6163. https://doi.org/10.3390/en15176163
[31] International Energy Agency. (2022). CO2 Emissions in 2022. https://iea.blob.core.windows.net/assets/3c8fa115-35c4-4474-b237-1b00424c8844/CO2Emissionsin2022.pdf, accessed on May 15, 2024.
[32] The U.S. Energy Information Administration. (2023). Annual Energy Outlook. https://www.eia.gov/outlooks/aeo/pdf/AEO2023_Release_Presentation.pdf, accessed on May 16, 2024.
[33] Mitrova, T., Gayda, I. (2021). Decarbonization of oil & gas: International experience and Russian priorities. Moscow School of Management. https://energy.skolkovo.ru/downloads/documents/SEneC/Research/SKOLKOVO_EneC_Decarbonization_of_oil_and_gas_EN_22032021.pdf, accessed on May 15, 2024.
[34] Equinor. (2023). Energy Perspectives. Global Macroeconomic and Energy Market Outlook. https://cdn.equinor.com/files/h61q9gi9/global/6f71b58bbba6fc71aa3f9230fd0d7c80b1a2594e.pdf?2023-Equinor-Energy-Perspectives.pdf, accessed on May 15, 2024.
[35] LUKOIL. (2022). Energy Brings Together. LUKOIL Group Sustainability Report for 2022. https://www.lukoil.com/FileSystem/9/633068.pdf, accessed on May 15, 2024.
[36] Shell. (2021). The Energy Transformation Scenarios. https://www.shell.com/news-and-insights/scenarios/what-are-the-previous-shell-scenarios/_jcr_content/root/main/section_1789847828/promo_copy_142460259/links/item0.stream/1652119830834/fba2959d9759c5ae806a03acfb187f1c33409a91/energy-transformation-scenarios.pdf, accessed on May 15, 2024.
[37] Kuo, S.Y., Tang, T.T., Hsu, H.H., Lin, L.Y., Chen, Y.M. (2022). Challenges to govern a global sustainability science problem: Lessons from a domestic climate change research project. Environment, Development and Sustainability, 25(3): 2885-2904. https://doi.org/10.1007/s10668-021-02067-8
[38] Tillotson, P., Slade, R., Staffell, I., Halttunen, K. (2023). Deactivating climate activism? The seven strategies oil and gas majors use to counter rising shareholder action. Energy Research & Social Science, 103: 103190. https://doi.org/10.1016/j.erss.2023.103190
[39] Zhong, M., Bazilian, M.D. (2018). Contours of the energy transition: Investment by international oil and gas companies in renewable energy. The Electricity Journal/The Electricity Journal, 31(1): 82-91. https://doi.org/10.1016/j.tej.2018.01.001
[40] Baur, D.G., Todorova, N. (2023). Big oil in the transition or Green Paradox? A capital market approach. Energy Economics, 125: 106837. https://doi.org/10.1016/j.eneco.2023.106837
[41] Wiener, J.B. (2013). The diffusion of regulatory oversight. In the Globalization of Cost-Benefit Analysis in Environmental Policy. New York, Oxford University Press, 123-141. https://doi.org/10.1093/acprof:oso/9780199934386.003.0008
[42] Tcvetkov, P. (2021). climate policy imbalance in the energy sector: Time to focus on the value of CO2 utilization. Energies, 14(2): 411. https://doi.org/10.3390/en14020411
[43] Ilinova, А.А., Romasheva, N.V., Stroykov, G.A. (2020). Prospects and social effects of carbon dioxide sequestration and utilization projects. Journal of Mining Institute, 244: 493-502. https://doi.org/10.31897/pmi.2020.4.12
[44] Cherepovitsyna, A., Sheveleva, N., Riadinskaia, A., Danilin, K. (2023). Decarbonization measures: A real effect or just a declaration? An assessment of oil and gas companies’ progress towards carbon neutrality. Energies, 16(8): 3575. https://doi.org/10.3390/en16083575
[45] Dieleman, C., Bhatia, A., Ravikumar, A., Llovell, F., Svane, S., Tibrewal, K., Zaelke, D., Murphy, A. (2022). Opportunities beyond CO2 for climate mitigation. One Earth, 5(12): 1308-1311. https://doi.org/10.1016/j.oneear.2022.11.017
[46] Nunes, L.J.R. (2023). The rising threat of atmospheric CO2: A review on the causes, impacts, and mitigation strategies. Environments, 10(4): 66. https://doi.org/10.3390/environments10040066
[47] Maeno, K., Tokito, S., Kagawa, S. (2022). CO2 mitigation through global supply chain restructuring. Energy Economics, 105: 105768. https://doi.org/10.1016/j.eneco.2021.105768
[48] Bhate, A.A., Joseph, E.B. (2023). Decarbonizing the future: Understanding carbon capture, utilization, and storage methods. World Journal of Advanced Engineering Technology and Sciences, 8(1): 247-250. https://doi.org/10.30574/wjaets.2023.8.1.0020
[49] Otelbaev, M., Durmagambetov, A.A., Seitkulov, E.N. (2006). Existence conditions for a global strong solution to one class of nonlinear evolution equations in a Hilbert space. In Doklady Mathematics. Nauka/Interperiodica, 73: 391-393. https://doi.org/10.1134/s1064562406030203
[50] Kaplan, R.S., Norton, D.P. (2001). Transforming the Balanced Scorecard from performance measurement to strategic management: Part I. Accounting Horizons, 15(1): 87-104. https://doi.org/10.2308/acch.2001.15.1.87
[51] Ritchie, H, Rosado, P., Roser, M. (2020). CO₂ emissions by fuel. https://ourworldindata.org/emissions-by-fuel, accessed on May 15, 2024.
[52] Energy Institute. (2023). Statistical Review of World Energy 72nd Edition. Energy Institute. http://www.emccement.com/pdf/Statistical_Review_of_World_Energy_2023.pdf, accessed on May 15, 2024.
[53] International Energy Agency. (2023). Emissions from oil and gas operations in net zero transitions: A world energy outlook special report on the oil and gas industry and COP28. France, OECD Publishing. https://iea.blob.core.windows.net/assets/2f65984e-73ee-40ba-a4d5-bb2e2c94cecb/EmissionsfromOilandGasOperationinNetZeroTransitions.pdf, accessed on May 15, 2024.
[54] Statista. (2021). Distribution of total oil & gas sector emissions worldwide in 2021, by Scope. Energy & Environment. https://www.statista.com/statistics/1419389/oil-and-gas-sector-emission-scope-shares-worldwide/, accessed on May 15, 2024.
[55] Otelbaev, M., Durmagambetov, A.A., Seitkulov, Y.N. (2008). Conditions for existence of a global strong solution to one class of nonlinear evolution equations in Hilbert space. II. Siberian Mathematical Journal, 49(4): 684-691. https://doi.org/10.1007/s11202-008-0065-1
[56] Gazprom. (2022). Gazprom Group’s Social Impact Report 2022. https://sustainability.gazpromreport.ru/fileadmin/f/2022/sustainability-report-en-2022.pdf, accessed on May 15, 2024.
[57] Novatek. (2022). Focus on what really matters. Sustainability Report 2022. https://www.novatek.ru/common/upload/doc/NOVATEK_SR_2022_ENG.pdf, accessed on May 15, 2024.
[58] Rosneft. (2022). Preserving the environment. Rosneft’s Sustainability Report 2022. https://www.rosneft.com/upload/site2/document_file/Rosneft_CSR2022_ENG.pdf, accessed on May 15, 2024.
[59] Tatneft. (2022). Nature of development. Integrated Annual Report. https://www.tatneft.ru/uploads/publications/649ee308eeb73614377074.pdf, accessed on May 15, 2024.
[60] GAZPROM Neft. (2022). Energy in people. https://ir.gazprom-neft.ru/upload/iblock/3fd/1i43k1fckzjs0opy522l29uc8u97iezk/GPN_AR2023.pdf, accessed on May 15, 2024.
[61] Surgutneftegaz. (2022). Environmental Report “Surgutneftegaz” PJSC. https://www.surgutneftegas.ru/upload/iblock/06c/ECO_2022_ang.pdf, accessed on May 15, 2024.