Pavlo Kravchuk*![]() | Nataliia Kravchuk
| Nataliia Kravchuk![]()
© 2024 The authors. This article is published by IIETA and is licensed under the CC BY 4.0 license (http://creativecommons.org/licenses/by/4.0/).
OPEN ACCESS
This study describes, characterises and analyses the optimisation of truck entry and exit time windows, which includes a cross-docking centre planning strategy, using the simulation environment of the AnyLogic software environment. The article describes the use of software integers (IP*) and heuristics (IP1 and IP2) for the time windows of a cross-docking centre. Based on a mathematical model using an integer number program (IP*) and heuristics (IP1 and IP2), a scheduling problem is investigated. This program consists in minimizing the penalties for violation of the time windows for inbound and outbound trucks. It also enables to calculate the operation time of time windows on an ongoing basis. The cross-docking-center model is a layout, which includes logistic elements of technological processes, created using the AnyLogic software. It is found out by using order diagrams that after unloading arriving trucks, the goods are collected in four stages, the first two of which (queuing and waiting for collection) determine the loading rate of goods in the trucks departing from the cross-dock. After determining the main stages of order collecting using the cross-docking strategy, the dependences of the average time of unloading and loading goods are studied. The average unloading and loading time are found to be 30 and 25 minutes, respectively. Based on the time dependences, a diagram of the average time of a truck in the dock, being about an hour - an hour and a half, is created.
logistics, mathematical modelling, supply chain, transportation
Many companies in the world today are interested in developing and improving the strategy of managing and controlling physical flow of their own goods using the supply chain [1]. At present, rapid changes in competitive markets play an important role on customer satisfaction, which is critical for many companies involved in logistics industry [2]. The key aspects of the search for strategies include minimizing the total cost and achieving a high level of agility, which in turn enables to increase flexibility and reliability for various requirements and tasks [1-3].
Mathematical modeling helps to detect the problem of vehicle routing by using the cross-docking technology. This enables to separate the services by pickup and delivery routes. To minimize and reduce transportation costs on the routes, various mixed-integer linear programming models are used. This makes possible to reduce the vehicle operational costs and the total number of violations from the acceptable interval of each node [4].
When a customer requests an item, employees of the distribution center pick it up from the warehouse, package it for shipping, and ship it to the destination point. Warehousing includes four main processes, namely receiving, storing, assembling and shipping orders. A more time-consuming process is storage due to the cost of holding stocks for assembling customer orders [5, 6].
The cross-docking system operates as follows:
- receipt of goods (boxes, pallets, containers, etc.), barcode scanning upon receipt or marking of cargo in receipt areas;
- sorting according to internal warehouse classification and grouping by destination;
- placement of products on shipping platforms and loading them into inbound trucks from the cross-docking center [3, 6, 7].
In practice, most of the cross-docks are long, narrow, rectangular (I-shaped) and other (L, T, X) shapes [8, 9]. A cross-dock has multiple loading docks (dock doors) where trucks can dock for loading and unloading. Arriving trucks are secured behind a "leaf door" where the cargo is unloaded. After this, the goods are transported to the targeted "stack door" and loaded into the departing truck [9, 10].
The following sequence factors are taken into account when loading goods:
- tight cargo packing;
- appearance and creating space for fragile goods in the upper part of the trailer;
- arranging goods in the truck for unloading joint cargo in the right order;
- creating a “loading nose” in the front part of the trailer to avoid sorting out the cargo at intermediate cross-docks [10].
Despite the fact that the main idea of cross-docking is to receive and ship goods directly through the warehouse, sometimes the goods are temporarily stored for no more than 24 hours. This is because the goods may not be in the right sequence or due to imperfect synchronization of inbound and outbound trucks [1, 6, 11].
The cross-docking strategy implies basic functions including labeling and consolidation of goods, repackaging and containerization, goods processing, data transfer, updating process schedules, resource management etc. Depending on the research field, cross-docking can be considered in conjunction with the routing problem of vehicles for more efficient servicing transport requests [3, 12].
Distribution process accounts for about 30-35% of the cost of selling a product, which is accompanied by an increase of the overhead costs of the entire supply chain [7, 13]. In its turn, due to high competition, this affects suppliers and production process. Cross-docking strategy enables to overcome high storage and processing costs by consolidating shipments from different sources with subsequent shipping goods as well as to improve the efficiency of the use of truck capacity by consolidating loads of different sizes with the same destination point.
The problem of application of the cross-docking strategy arises due to the choice of configuration, which includes the following factors:
- the size of the enterprise and the intensity of warehouse (distribution center) management;
- increase of the rate of goods acquisition;
- reception of accurate information about the location of the goods in the warehouse;
- product management efficiency;
- obtaining a tool to improve the efficiency and develop the processes of goods processing in a warehouse;
- optimization of the use of storage areas, etc. [4, 10].
The cross-docking strategy includes advantages and disadvantages that should be analyzed and identified at the design stage in order to ensure unimpeded logistic operations with implementation of technological processes [11].
With the progress in technologies, many researchers annually focus their attention on the development of new models of logistic operations cross-docking operations [7, 14].
With improvement of technologies and new developments, more and more opportunities for sustainability of logistic systems arise. The context implies a supply chain using the physical Internet, which is presented as an innovative concept of a globally sustainable logistic system [15]. It is noteworthy that such an innovative strategy enables to optimize operations directly in the cross-docking terminal.
Chargui et al. [16] investigated the problem of receipt and delivery with cross-docking as an improvement of integration with routing and scheduling in cross-docking systems. Compared to the problem of routing vehicles with cross-docking, the proposed model enables to choose model, which leads to reduction of total distribution costs. Stopping at cross-docking is an undesirable process and unprofitable from economic point of view [17].
The purpose of this work is to optimize time windows for inbound and outbound trucks when performing order assembling using the simulated cross-docking-center environment. The actual problem of cross-docking logistic operations is the large time spent for assembly and intermediate storage of goods, which significantly affects the timely assembly and delivery of the order to the client.
The objectives of the study include analysis of literary sources using the cross-docking strategy in logistic operations, study of the main technological cross-docking operations, search and determination of the disadvantages and advantages of the cross-docking strategy, search of a software and design of a cross-docking model to study the dependences of the time for processing and executing technological processes.
The scientific novelty consists in the determination of the dependence of the time of the technological operations of unloading and loading goods in a cross-dock in order to determine the waiting time of the assembly of goods in logistic operations.
2.1 Strategy and implementation of cross-docking
The cross-docking strategy also includes positioning cross-docks. It is realized based on the forbidden search algorithms to determine the cross-dock location from a set of multiple possible locations [5, 18, 19]. One such algorithm is the taboo search algorithm based on a metaheuristic algorithm and used to prevent local optimization. It consists of several rounds. At each iteration, a potential solution with the associated solution neighborhood is found. The algorithm moves from solution to solution erasing the previous neighborhood and keeping the new one at each iteration until the best solution is obtained [10, 18]. The idea of this study includes optimization of time windows of entrance and exit doors to optimize the order assembling operations and minimize time costs in the cross-docking technology. The study was conducted at the Raben Ukraine facility on June 24, 2021.
To determine the best cross-dock shape, the number of doors of the object must be calculated. Cross-dock has two types of gateways: receiving or entry doors and shipping or outgoing (exit) doors. To determine the number of doors for shipment is easier regardless of the volume of orders. In certain cases, there is no more than one gateway (exit) per a destination point [17].
Determination of the number of entry doors is a much more difficult task due to the fact that it requires the information on the exact number of trucks that can arrive at the same time to the docks as well as on the place where the goods are directly collected. For ordinary cargo transfer, the Little's law (1) enables to calculate the number of receiving doors by multiplying the capacity of trucks by the average time needed to unload a truck [4].
$L=\lambda W$ (1)
The long-term average number L of requirements in a stationary system is equal to the long-term average intensity λ of the input flow multiplied by the average time W of the application in the system [19].
The most common is the I-shape of cross-docking (Figure 1(a)). It is used at the facilities with 100 and more doors, which is typical for cross-docking. This shape makes a direct path from the entry to the exit door thus minimizing material touching, decreases the costs of goods transportation and reduces the needed space inside the facility. If the buildings have more than 150 doors, T-shape (Figure 1(b)) is more appropriate. X-shape (Figure 1(c)) should be used in the buildings with more than 200 doors. In some cases, L-shaped cross-dock is considered to be used for the building with 100 doors and more (Figure 1(d)) [5, 9, 10, 18].
It is convenient to determine the most used doors. For this purpose, the distances from one gateway to all other ones in the cross-dock should be calculated. We consider here a rectangular-shaped cross-docking-center shown in Figure 2.
Figure 1. Cross-docking-center shapes
Figure 2. Simplified diagram of a cross-docking-center
2.2 Mathematical model for determination of time windows for trucks
The integer program using heuristics is more accurate and stable, which helps to calculate the operation time of time windows [9].
min
$\begin{array}{cc}\alpha \sum_{i \in I} \sum_{k \in K_i} & P_{i k}^I w_{i k}^I+\beta \sum_{o \in O} \sum_{k \in K_o} P_{o k}^O w_{o k}^O+ \\ & \gamma \sum_{h \in H, i \in I, d \in D} S_{h i d}^I \\ \text { s.t. } & \sum_{i \in I} \sum_{k \in K_i} W_{i k h}^I w_{i k}^I \leq N^I \\ & \forall h \in H\end{array}$ (2)
$\begin{gathered}\sum_{o \in O} \sum_{k \in K_O} W_{o k h}^O w_{o k}^O \leq N^O \\ \forall h \in H\end{gathered}$ (3)
$\begin{gathered}x_{h i o}+S_{h i d}^I \leq M \sum_{k \in K_i} W_{i k h}^I w_{i k}^I \\ \forall h \in H, i \in I, o \in O\end{gathered}$ (4)
$x_{h i o}+S_{h o}^O \leq M \sum_{k \in K_O} W_{o k h}^I w_{o k}^O$
$\forall h \in H, i \in I, o \in O$ (5)
$\begin{gathered}\sum_{h \in H, o \in O} Z_{d o} x_{h i o}+\sum_{h \in H} S_{h i d}^I=Q_{i d} \\ \forall h \in I, d \in D\end{gathered}$ (6)
$\begin{gathered}\sum_{i \in I, h \in H} x_{h i o}+\sum_{h \in H} S_{h o}^O=C \\ \forall o \in O\end{gathered}$ (7)
$\sum_{k \in K_i} w_{i k}=1 \quad \forall i \in I$ (8)
$\sum_{k \in K_0} w_{o k}=1 \quad \forall o \in O$ (9)
$\begin{gathered}S_{h d}=S_{(h-1) d}+\sum_{i \in I} S_{h i d}^I-\sum_{o \in O} Z_{d o} S_{h o}^O \\ \forall d \in D, h \in H \backslash\{0\}\end{gathered}$ (10)
$S_{o d}=\sum_{i \in I} S_{0 i d}^I-\sum_{o \in O} Z_{d o} S_{0 o}^O \quad \forall d \in D$ (11)
$\begin{gathered}x_{h i o}, S_{h i d}^I, S_{h o}^O, S_{h d} \in N^{+} \\ \forall h \in H, i \in I, o \in O, d \\ \omega_{i k}^I, \omega_{o k}^O \in\{0,1\} \\ \forall i \in I, o \in O, k \in K\end{gathered}$ (IP*)
where, H - a set of time periods (for example, half an hour) within the defined planned limits; I - a set of incoming trucks; O - a set of outgoing trucks; D - a set of directions; Qid - the number of pallets for certain directions d $\in$ D in the truck i $\in$ I; Zdo - (=1), if the truck o $\in$ O for the direction of d $\in$ D, 0 in other cases; NI - the number of entrance doors; NO - number of exit doors; M - the maximum number of machines that can be moved during one time period from one machine to another; C - volume of outbound truck deliveries; xhio - is the number of units that go from truck i to truck o in a period of time h; wIik =1, if slot k $\in$ Ki is selected for truck i, 0 otherwise; wOok =1, if slot k $\in$ Kо is selected for truck o, 0 otherwise; sIhid - is the number of goods with destination d that move from truck i to storage location for a period of time h; sOho - is the number of products that go from the storage location to the truck o in time period h.
KI (respectively KO) as a set of possible intervals of truck presence i $\in$ I (respectively o $\in$ O). These possible intervals are described by the matrices WI and WO.
= 1, if the hour h $\in$ H in the slot k $\in$ Ki for the incoming truck i $\in$ I;
= 1, if the hour h $\in$ H in the slot k $\in$ Ko for the outgoing truck o $\in$ O.
Penalties for both PI і PO are determined as follows:
- the penalty is paid for the use of the time interval k $\in$ Ki for a truck i $\in$ I, if k is the desired time window set by the carrier;
- the penalty is paid for the use of the time interval k $\in$ Ko for a truck o $\in$ O.
The first heuristic is responsible for fixing the schedule of inbound trucks, while the schedule of departures is fixed in the other heuristic.
Use of the Z matrix enables to specify the destination of each outbound truck. One can easily calculate XO by a binary matrix defined as follows: XOdh = 1 if the truck sent to a destination d is present for a period h, otherwise XOdh = 0.
The integer program (IP1) uses wIik as a solution variable in the same way as two new variables that measure the difference between the arrival and departure plans.
δ+dh - for the time when h $\in$ H, the positive difference between the number of pallets for a destination d $\in$ D available for unloading and the number of pallets that can be loaded into trucks for d present near the exit doors, while δ-dh - for the time when h $\in$ H, the negative difference [9, 20].
min
$\begin{array}{ll} & \sum_{d \in D, h \in H}\left(\delta_{d h}^{+}+\delta_{d h}^{-}\right) \\ \text {s.t. } & \sum_{i \in I} \sum_{k \in K_i} Q_{i d} W_{i k h}^I w_{i k}^I \\ = & M X_{d h}^O+\delta_{d h}^{+}-\delta_{d h}^{-} \\ & \forall d \in D, h \in H\end{array}$ (12)
$\begin{gathered}\sum_{i \in I} \sum_{k \in K_i} W_{i k h}^I w_{i k}^I \leq N^I \\ \forall h \in H\end{gathered}$ (13)
$\begin{gathered}\sum_{k \in K_i} w_{i k}=1 \\ \quad \forall i \in I\end{gathered}$ (14)
$\begin{gathered}\delta_{d h}^{+}, \delta_{d h}^{-} \in N^{+} \\ \forall d \in D, h \in H \\ w_{i k}^I \in\{0,1\} \\ \forall i \in I, k \in K\end{gathered}$ (IP1)
The first stage of the heuristic (IP2) forms an acceptable outbound truck schedule that minimizes early and late outbound trucks regardless of the input data. Given a fixed output data, (IP*) is used to create a schedule for arriving trucks [9].
min
$\begin{array}{cc} & \sum_{o \in O} \sum_{k \in K_O} P_{o k}^O P_{o k}^O \\ \text { s.t. } & \sum_{o \in O} \sum_{k \in K_O} W_{o k h}^O w_{o k}^O \leq N^O \\ & \forall h \in H\end{array}$ (15)
$\begin{gathered}\sum_{k \in K_O} w_{o k}=1 \\ \forall O \in O\end{gathered}$ (16)
$\begin{gathered}w_{o k}^O \in\{0,1\} \\ \forall o \in O, k \in K\end{gathered}$ (IP2)
The integer program (IP2) uses wOok as a solution variable to minimize resentment of transporters with shipments. The constraint (15) ensures that the number of trucks in operation during any period of time does not exceed the number of exit doors, while the constraint (16) guarantees that only one time window is assigned to each outbound truck [12].
In the next stage, the output from (IP2) wOok is used as the IP*.
2.3 Software with initial parameters for the cross-docking center model
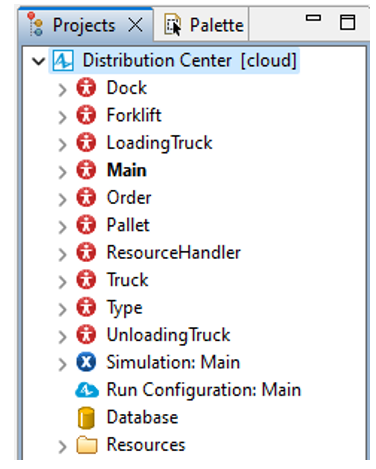
To model the processes of the cross-docking platform, AnyLogic software was used, which provides ready-made templates for simulating processes with the setting of output parameters. Figure 3 shows the main processes that make up the cross-dock center, which allows you to display all the main key parameters in the form of an interface during the simulation. For example, the Dock element contains the following parameters for customization: Presentation (scale, level1), Parameters (dockNode, loadPoint: null, numDock:1, storage: null; truckPoint; turn point); Variables (isOccupied, processingForklift); Functions (releaseForklift, reserve, spaceAvailable, unreserve); Collections (orders, reserved).
Other elements are configured in the same way, Forklift, LoadingTruck, Main, Order, Pallet, ResourceHandler, Truck, Type, UnloadingTruck, Simulation etc. Figure 4 shows the main process and elements of the layout that contains the cross-docking center.
Figure 3. Main project processes and their settings
Figure 4. Setting up processes and elements of the model interface
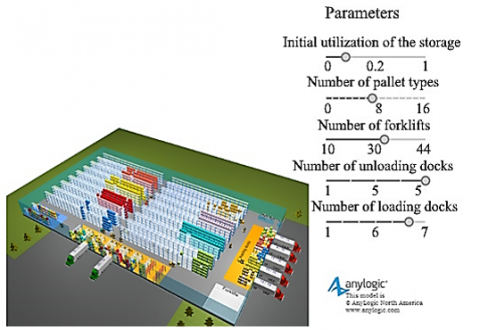
Figure 5. Run the simulation and set the parameters
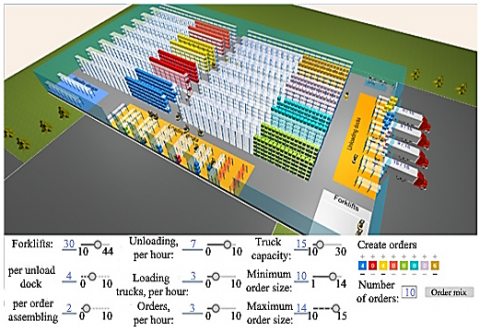
Figure 6. Additional process customization during simulation
After building the layout, you need to model all the processes and elements for the simulation. Simulation: Main displays the initial parameters for running the simulation, as shown in Figure 5, which shows the settings of such parameters as Initial utilization of the storage, number of pallet types, number of forklifts, number of unloading docks, number of loading docks.
After the simulation is launched, the model suggests changes during the execution of processes in the software environment. The process parameters that can be changed include the following (Figure 6): Forklifts - per unloading dock and per order assembling; Unloading trucks, per hour; Loading trucks, per hour; Order, per hour; Truck capacity; Minimum order size; Maximum order size; Create orders, etc.
This model allows us to demonstrate the optimization of the cross-docking center's processes for unloading and loading docks and allows us to establish the relationship where the number and volume of transported products affects the time windows for trucks.
2.4 Modeling basic cross-docking processes
In this article, modeling was carried out to obtain combinations of agent and discrete events. This enabled to mimic the behavior of identifiers directly involved in cross-docking operations. For discrete events, simulating operations related to packet aggregation became possible. Modeling makes possible to obtain the necessary information about the operations related to transshipment, which in turn enables to choose more appropriate dimensions and shape of the distribution center for cross-docking [20, 21]. AnyLogic simulation environment was used as a software. It is a good imitating modeling tool with support of modeling methodology using a graphical language in Java code.
In a simulated environment, using the agents with active components, their behavior is determined with formation of interlink. The simulation is a sequence of discrete events that perform basic actions (unloading and loading a truck are discrete events being a sequential algorithm, which ultimately results in emptying or filling the cargo compartment of the truck).
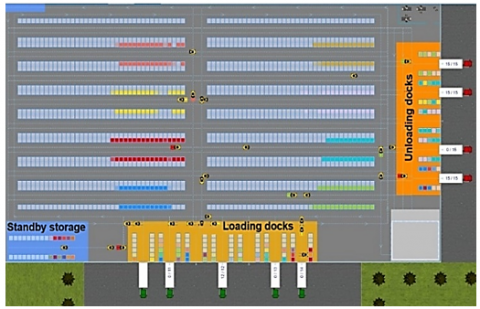
The built layout includes logistic elements of the operations with the corresponding zones: unloading dock, loading dock, assembly dock with pallets (8 types), forklifts (total number of 29 units) and backup storage. The unloading dock consists of five doors to receive trucks with goods. The loading dock consists of seven doors. Here, the assembled goods are loaded into a truck for shipment to the customer.
Figures 7 and 8 present 2D and 3D models of a cross-docking-center. The main technological processes of unloading, assembling and loading goods with performing technological operations in three stages are shown.
Unloading stage. A truck delivers pallets to a free unloading dock. The pallets are unloaded from the truck by a forklift and placed in the receiving dock area. After that, other forklifts move the pallets to the main racks.
Assembly stage. Orders are collected from pallets, which may be of the same or different types. An order can only be collected if the required pallets can be placed in the assembly area near the docks (or, if the space is not enough, in the additional storage area), provided that the required types are available in the main warehouse. The order is assembled by forklifts.
Loading stage. Orders are fully assembled and loaded into a truck for delivery to the customer. A forklift loads the orders into trucks from the assembly area. The total number of orders for one truck must be at least half of its capacity.
Perishables such as vegetables and fruit supplied from different regions or countries and assembled for delivery to customers, for example, in supermarkets and stores, are considered as goods.
Figure 7. 2D model of a cross-docking-center showing the processes
Figure 8. 3D model of a cross-docking-center showing the processes
The process of assembling goods is the most important, since just after unloading a problem caused by delay in the assembly of orders arises. This problem significantly affects the rate of assembly and timely delivery of goods directly to the client. Therefore, the more goods are in the queue and waiting for assembly, the longer time it takes to complete the order in time.
3.1 Determining and optimizing time windows for inbound and outbound trucks
In order to evaluate the effectiveness of heuristics for computation time, their results should be compared with the optimal solution. This will enable to evaluate the situation of each heuristic approach with good results. The initial data parameters are configured as follows: |H|=10, |D|=4, M=4 and C=4.
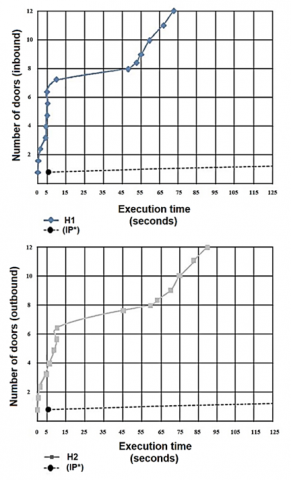
Keeping the accumulation of trucks fixed at 0.4 truck/door/hour, the total execution time of the heuristic as the number of doors increases is tracked in the first series of tests. Each of the values shown in Figure 9 demonstrate the average execution time that can be obtained for 15 different cases, generated randomly based on the component parameters.
The heuristics (IP1 and IP2) are 87 times faster than (IP*) for 4-5 doors and 9-10 trucks on average, while executing (IP*) for 3-4 doors and 15 trucks takes about 200 seconds. In terms of calculations, H1 can be calculated in less than 10 seconds with up to 70 doors per platform, while H2 can only process up to 64 doors during 10 seconds. We can get a result for 82 doors in one minute. It should be taken into account, however, that the execution time grows for values above 82 doors. Since a cross-dock platform may contain more than 82 doors, different strategies must be used to handle large platforms.
3.2 Investigation of the optimization of time windows for order assembly time
As can be seen from Figure 10, the study of order assembly consists of 4 stages, which are divided by time intervals over 16 hours. During the first four hours (a), the unloaded goods arrived to the cross-dock. Here, the pallets are unloaded from the truck by a forklift and assembled to fulfill the order.
The delay in waiting for loading is due to the arrival of loading trucks at the site of the cross-docking-center. When a truck arrives at the loading dock area (b) the collected goods are reduced from the collected orders and loading waiting process is carried out. During 12 hours (c) the assembly waiting time increased. This is explained by the delay in assembly and loading of goods into the departing trucks, which may result in a delay in the assembly queue of goods for shipment (d) during 16 hours.
Figure 9. The total execution time of the heuristic (R=0.4 - accumulation coefficient)
Figure 10. Assembly of orders based on unloading and loading of goods
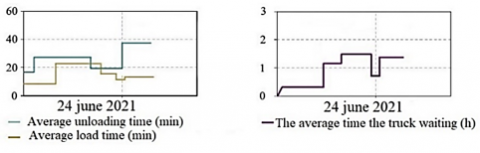
Figure 11. Dependencies of the average time of unloading and loading of a truck, taking into account the average time of the truck in the cross-dock
Figure 11 shows the dependences of goods unloading and loading time as well as the average time of one truck in the cross-docking area.
As can be seen from the Figure 11, the average time of loading goods into a truck has less time costs in contrast to the time of unloading goods from a truck due to the time costs of delivering pallets to the assembly area. After unloading and receiving the goods, the goods are assembled and completed for loading, the average time of which is 40 minutes and more.
3.3 Feasibility and variability of the proposed model
During the study, the validity of the model is analyzed using various sensitivity analyses. Since a large amount of computing time is required, the author used an HP laptop model Victus 15 fa1093dx with the provision of a dataset through the AnyLogic software library, in which the cross-docking center model was modeled. To optimally solve the problem over time, a laptop with an Intel Core i13420 processor with a frequency of 3.4 to 4.6 GHz and 16 GB of RAM was used.
Figure 11 confirms that transport costs can increase by increasing the unloading and loading time. Therefore, the number of unloading and loading doors can be reduced by increasing the time for unloading and loading in the cross-docking area. This suggests that the model is capable of solving problems with high costs in order to prevent violations of time windows.
Based on Figure 11, we will analyze the reliability of the data obtained with other studies. Baniamerian et al. [14] studied models with satisfied parameters and conditions was 40 minutes, and in the following scenarios, this window increased to 120 minutes, which is equal to the hard time window. According to the data shown in Figure 11, we can assume that the time window is less than 40 minutes, but can be much longer, which in turn will not affect the creation of the same networks and routing plans. However, with increased severity, the performance gap may increase.
3.4 Implementation issues and potential challenges for an optimized cross-docking strategy
Implementation of an optimized cross-docking strategy in this study may be challenged due to lack of resources or required technology. Also, difficulties may arise due to the coordination of processes between different departments and suppliers. Potential challenges include the need to implement new processes and systems, as well as providing staff training and resolving potential conflicts between supply chain participants.
Among the main potential challenges of the cross-docking strategy are:
- technological limitations, where the need to implement new systems and technologies may be difficult due to the cost or complexity of implementation;
- logistical difficulties, where the cross-docking strategy requires precise synchronization and coordination between different stages of the supply chain, which can lead to logistical difficulties;
- safety issues, where the processing and movement of goods in a short period of time can create risks regarding safety and quality control;
- personnel needs, where the implementation of new processes may require additional training and training of service personnel.
The limitation of this study based on the mathematical model is that during implementation, errors in the operation of time windows may occur, which may affect the processes of unloading and loading trucks, which in general may affect the productivity and optimization of the processes of such a cross-docking strategy. A secondary limitation of the cross-docking strategy is the maintenance of technical documentation, as well as the introduction of new standards, which in general may indicate the complexity of implementation at the official level. As a rule, problems with the standardization of the cross-docking strategy are primarily related to the diversity of processes, technological differences, scale, changes and innovations. In this case, the limitations of standardization in our study include two key factors:
- process diversity, where supply chains can vary by industry, market, and geography, making it difficult to develop universal standards;
- technological differences, where different companies may use different technologies and software, making it difficult to integrate and standardize cross-docking processes.
The technology of cross-docking in the tasks of planning and managing logistic operations requires continuous improvement, which is explained by the optimization of the tasks of planning multiple-door transshipment for inbound and outbound trucks. To carry out analysis in planning and control problems, we consider some models. In modeling, metaheuristic algorithms are introduced. Golshahi-Roudbaneh et al. [20] analyzed the numerical results using the criteria of relative percentage deviation and time. Compared to our proposed model, metaheuristic algorithms are reasonable to use for the lower boundary and strict heuristics in the truck planning problems.
To minimize penalties caused by delays in customer service, Cota et al. [12] analyzed an integrated problem, in which scheduling trucks in a cross-docking-center is combined with an open problem of vehicle routing [1]. The authors propose a linear programming model with mixed integers for the optimal solving control problems. The model containing two heuristics contributes to obtaining the complex solution of planning and control problems. However, use of cross-docking vehicle routing heuristics enables to focus on solving only one problem in planning operations, which is an inefficient solution for managing multiple processes.
In this regard, optimization of cross-docking using imitating models is studied practically. The structure of the imitating model is created using a hybrid model based on discrete events and agents. This enables to more accurately and individually describe the operations and processes inside the cross-docking-center. Suh [22] studied the structure of the imitating model was used to assess the possibility of implementing the operations of planning problems for a supply chain of goods as well as to optimize the cross-docking performance according to the set restrictions. The authors evaluate the impact of controlled input parameters on key cross-docking characteristics and optimize these parameters to achieve the best results from cross-docking operations.
However, some models are aimed at studying the logistic strategy of cross-docking, which enables to understand the influence on the sending order process in order to successfully implement the logistic strategy. Little and Graves [23] considered two different situations in which use of this strategy can be beneficial. The first situation is based on the analysis of what the order processing system should be in order to support cross-docking and modeling. This facilitates presentation of cross-dock internal processes based on the data provided. The second situation is based on modeling to provide cross-docking a global perspective. The process of the delivery of an order to a customer from the moment the product leaves the distribution center to its arrival at the final destination point is considered using real data.
This study considers the main tasks of planning internal operations on a cross-docking platform, which enables to minimize long-term storage of goods and avoid delays in order assembling. The studies have shown that the calculation time of time windows (IP*) is long to be used daily. Use of heuristics (IP1 and IP2) increases the calculation speed by a factor of 75. The average time for 2 doors and 8 trucks is approximately 200 seconds, which is a good value for processing large numbers of door windows for inbound and outbound trucks.
Imitation of the simulated environment enabled to determine specific characteristics that influence on the increase in the time required to complete the order and deliver it to the client. Using the order diagrams, it was found that after unloading cargo from arriving trucks goods are assembled in four stages. The first two stages (queuing and waiting for assembly) determine the rate of loading goods into departing trucks from the cross-dock. The study demonstrated that for the period of 16 hours, the assembly is more efficient during the first 4 hours when cargo is unloaded from trucks. Within 12 hours, the waiting time for assembly increased, which could induce a time delay in loading the goods and delivering it to the client later than the agreed time. Therefore, waiting for assembly affects the first stage of order collection, when the goods are queued for some time.
[1] Vincent, F.Y., Jewpanya, P., Redi, A.P. (2016). Open vehicle routing problem with cross-docking. Computers & Industrial Engineering, 94: 6-17. https://doi.org/10.1016/j.cie.2016.01.018
[2] Fathollahi-Fard, A.M., Ranjbar-Bourani, M., Cheikhrouhou, N., Hajiaghaei-Keshteli, M. (2019). Novel modifications of social engineering optimizer to solve a truck scheduling problem in a cross-docking system. Computers & Industrial Engineering, 137: 106103. https://doi.org/10.1016/j.cie.2019.106103
[3] Kheirkhah, A., Rezaei, S. (2016). Using cross-docking operations in a reverse logistics network design: A new approach. Production Engineering, 10: 175-184. https://doi.org/10.1007/s11740-015-0646-3
[4] Goodarzi, A.H., Tavakkoli-Moghaddam, R., Amini, A. (2020). A new bi-objective vehicle routing-scheduling problem with cross-docking: Mathematical model and algorithms. Computers & Industrial Engineering, 149: 106832. https://doi.org/10.1016/j.cie.2020.106832
[5] Van Belle, J., Valckenaers, P., Cattrysse, D. (2012). Cross-docking: State of the art. Omega, 40(6): 827-846. https://doi.org/10.1016/j.omega.2012.01.005
[6] Goodarzi, A.H., Diabat, E., Jabbarzadeh, A., Paquet, M. (2022). An M/M/c queue model for vehicle routing problem in multi-door cross-docking environments. Computers & Operations Research, 138: 105513. https://doi.org/10.1016/j.cor.2021.105513
[7] Theophilus, O., Dulebenets, M.A., Pasha, J., Lau, Y.Y., Fathollahi-Fard, A.M., Mazaheri, A. (2021). Truck scheduling optimization at a cold-chain cross-docking terminal with product perishability considerations. Computers & Industrial Engineering, 156: 107240. https://doi.org/10.1016/j.cie.2021.107240
[8] Shahabi-Shahmiri, R., Asian, S., Tavakkoli-Moghaddam, R., Mousavi, S.M., Rajabzadeh, M. (2021). A routing and scheduling problem for cross-docking networks with perishable products, heterogeneous vehicles and split delivery. Computers & Industrial Engineering, 157: 107299. https://doi.org/10.1016/j.cie.2021.107299
[9] Ladier, A.L., Alpan, G. (2013). Scheduling truck arrivals and departures in a crossdock: Earliness, tardiness and storage policies. In Proceedings of 2013 International Conference on Industrial Engineering and Systems Management (IESM), pp. 1-7.
[10] Kunda, N.T., Kravchuk, N.M. (2015). Geometric configurations of cross-docking warehouses. Bulletin of the National Transport University, 31: 294-299.
[11] Ye, Y., Li, J., Li, K., Fu, H. (2018). Cross-docking truck scheduling with product unloading/loading constraints based on an improved particle swarm optimisation algorithm. International Journal of Production Research, 56(16): 5365-5385. https://doi.org/10.1080/00207543.2018.1464678
[12] Cota, P.M., Nogueira, T.H., Juan, A.A., Ravetti, M.G. (2022). Integrating vehicle scheduling and open routing decisions in a cross-docking center with multiple docks. Computers & Industrial Engineering, 164: 107869. https://doi.org/10.1016/j.cie.2021.107869
[13] Rezaei, S., Kheirkhah, A. (2017). Applying forward and reverse cross-docking in a multi-product integrated supply chain network. Production Engineering, 11: 495-509. https://doi.org/10.1007/s11740-017-0743-6
[14] Baniamerian, A., Bashiri, M., Zabihi, F. (2018). Two phase genetic algorithm for vehicle routing and scheduling problem with cross-docking and time windows considering customer satisfaction. Journal of Industrial Engineering International, 14: 15-30. https://doi.org/10.1007/s40092-017-0203-0
[15] Santos, F.A., Mateus, G.R., Da Cunha, A.S. (2013). The pickup and delivery problem with cross-docking. Computers & Operations Research, 40(4): 1085-1093. https://doi.org/10.1016/j.cor.2012.11.021
[16] Chargui, T., Bekrar, A., Reghioui, M., Trentesaux, D. (2019). Multi-objective sustainable truck scheduling in a rail–road physical internet cross-docking hub considering energy consumption. Sustainability, 11(11): 3127. https://doi.org/10.3390/su11113127
[17] Pan, F., Zhou, W., Fan, T., Li, S., Zhang, C. (2021). Deterioration rate variation risk for sustainable cross-docking service operations. International Journal of Production Economics, 232: 107932. https://doi.org/10.1016/j.ijpe.2020.107932
[18] Akkerman, F., Lalla-Ruiz, E., Mes, M., Spitters, T. (2022). Cross-docking: Current research versus industry practice and industry 4.0 ADOPTION. In: Smart Industry–Better Management. Emerald Publishing Limited, Leeds, pp. 69-104. https://doi.org/10.1108/S1877-636120220000028007
[19] Kravchuk, N.M. (2015). Algorithms for cross-docking doors. In: Abstracts of the 71st Scientific Conference of Professorial and Academic Staff, Post-Graduate Students, Students and Structural Didevisions of the University. Kyiv, Ukraine: PoltNTU, paper 1, 2812015.
[20] Golshahi-Roudbaneh, A., Hajiaghaei-Keshteli, M., Paydar, M.M. (2017). Developing a lower bound and strong heuristics for a truck scheduling problem in a cross-docking center. Knowledge-Based Systems, 129: 17-38. https://doi.org/10.1016/j.knosys.2017.05.006
[21] Vahdani, B., Zandieh, M. (2010). Scheduling trucks in cross-docking systems: Robust meta-heuristics. Computers & Industrial Engineering, 58(1): 12-24. https://doi.org/10.1016/j.cie.2009.06.006
[22] Suh, E.S. (2015). Cross-docking assessment and optimization using multi-agent co-simulation: A case study. Flexible Services and Manufacturing Journal, 27: 115-133. https://doi.org/10.1007/s10696-014-9201-3
[23] Little, J.D., Graves, S.C. (2008). Little's law. In: Building Intuition: Insights from Basic Operations Management Models and Principles. Springer, Boston, MA, pp. 81-100. https://doi.org/10.1007/978-0-387-73699-0_5