Ahmed Al-Rubaye*![]() | Husam Kareem Mohsin Al-Jothery
| Husam Kareem Mohsin Al-Jothery![]() | Kadhim K. Al-Chlaihawi
| Kadhim K. Al-Chlaihawi![]()
© 2024 The authors. This article is published by IIETA and is licensed under the CC BY 4.0 license (http://creativecommons.org/licenses/by/4.0/).
OPEN ACCESS
There is a serious need for reducing the carbon dioxide emissions due to the increase in the global warming. Besides, owing to the unavailability of clean energy sources throughout an entire the year, hybrid renewable energy systems (HRESs) are required. On other hand, the importance of optimal HRES design is to achieve a low cost with using a high green energy. Helioscope and HOMER Pro software were used to design a small grid-connected model and estimate the consumption energy for optimization. The analysis of the system showed how a grid-connected PV system with a battery backup affected on the total energy costs. In addition, the role of power supply irregularity from the national grid was highlighted by calculating the likelihood of a power outage and its impact on HRES. The results showed the internal rate of return (IRR) is 13%, and the return on investment (ROI) is around 9%. Also, the value of renewable fraction was around 63.4%. In conclusion, the proposed system was an efficient according to the energy consumption. This case study can extend to be applied in any country, especially the countries have longer summer like Iraq.
hybrid renewable energy system, solar PV, microgrid planning, simulation, optimization, energy management
Nowadays, the demand for electrical power starts to appear, especially in developing countries [1]. This is due to the increase in population growth, industrial progress and the rapid growth in the production of electric cars. That led to increase in the rate of pollution. Besides, the developing countries are using the local power station (fuel diesel) to overcome that increase in demand on the electrical power [2]. On other hand, the replacement of internal combustion engines cars by electric cars for reducing the carbon dioxide emission makes an essential need of the electric power sources, which in turn depend on the national power plants in those countries [3]. For solving the mentioned case, the renewable energies were offered. the renewable energies are divided into solar, wind, biofuel, geothermal, ocean, hydrogens and hydropower [4]. But the initial construction cost associated with renewable energy source is additional cost to the total cost taking into account [5].
Alternative strategies have to be developed in order to manage the various energy sources in a way that is affordable, low polluting, and high reliable [6]. One of the characteristic solutions is to build energy system consists of more than one energy source to be controlled based on the preference of renewable sources with a lowest cost [7]. A connected grid or island grid needs to be planned and designed according to some factors, such as pollution, fuel supply and other concerns related to a centralized power generation [8].
Hybrid Optimization Model for Renewable Energy is so proven to be among the best options for managing the hybrid-energy system. The program has potential for developing, planning and modeling the ideal microgrid model that included various renewable energy sources [9]. The model can be simulated by the software in a variety of settings, including restricted, unrestricted, island, networked system, with storage, without storage, etc. simplifies the power system operator's job [10, 11]. The additionally aids in selecting the precise geographic location, ideal resource sizes, electrical loads, etc., which results in real-time planning, design, and simulation of the micro-network model [12]. Fukaume et al. [13] have developed a hybrid energy storage system that incorporates both electric double-layer capacitors (EDLC) and hydrogen. By integrating these systems with renewable energy sources like solar and wind, it becomes possible to establish self-sustaining power supplies for remote islands in Japan. To ensure optimal efficiency, it is advisable to select renewable energy sources that closely align with the load curve [13]. Similarly, Zhang et al. [14] have proposed a renewable HES for Ui island in South Korea. Their study involved the optimization of design and techno-economic analysis for various combinations of wind, solar, hydrogen, and batteries. The results indicated that the PV/wind/battery/PEMFC system emerged as the most effective solution. This system comprises 990kW of PV panels, 700kW wind turbines, 1088kWh Li-ion batteries, 300kW PEM electrolyzer, 300kg hydrogen storage, and 100kW PEMFC system. The levelized cost of electricity (LCOE) for this HES is projected to be 0.366$/kWh [14]. The work demonstrates the link between cleaner energy supplies and finite fuel-based resources by reducing the usage of fuel-based resources and increasing involvement in renewable energy sources [15, 16]. The various system configurations were examined, such as grid-connected wind farms and grid-connected PV wind farms based on how much energy and money each contributes. With a PV diesel generator, battery, and insulated AC diesel generator under various load profiles, the energy efficiency of a system based on renewable energy was examined [17-20].
In this paper, the proposed hybrid system was designed according to the power consumption of the selected site. The initial cost, net current cost, operation cost and cost of energy were calculated. The optimal design was simulated to achieve a low emission with an affordable cost.
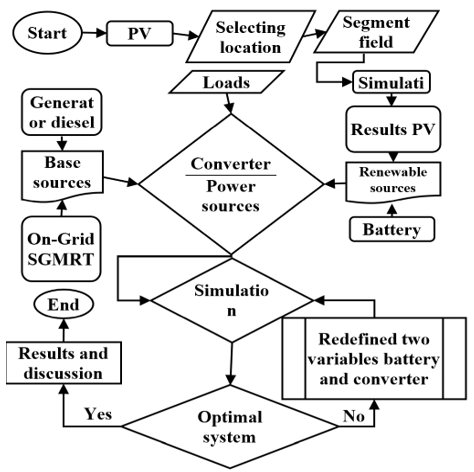
The specified stages for fulfilling this study were summarized in the flow chart, as shown in Figure 1. It was mainly divided into two phases. The first phase included selecting the location, estimating the segment field and collecting the PV results using Helioscope software. The second phase included assembling the HRESs with loads for achieving the optimal parameters using HOMER Pro software.
Figure 1. Flow chart of methodology
2.1 Study site
The study was done at College of Engineering, University of Al-Qadisiyah, Iraq. Due to the unreliable national grid and urgent need for a source of electrical power as a result of new buildings, diesel generator was utilized for compensating the power outages during the peak hours. To make up for the shortfall, it was necessary to find additional renewable energy sources. The crucial advantage of that study site has a good solar anergy source all the day times throughout the entire year. Besides, the long daylight hours and land features nearby the site do not block the direct solar radiation.
2.2 Calculation of the building's solar energy potential based on rooftop area
Helioscope software (web-based application) was utilized power of PV. It helps solar designers increase their design quickness by integrating simplified planning tools with bankable energy calculations. Fast rendering, 3D design, bankable simulations, single-line diagrams, automatic CAD export, systems up to 5MW, component library, global weather coverage, PAN file support, shadow reports, and more features presented by Helioscope [21, 22]. PV losses is considered in this study because the importance of study concentrated on the using solar energy. Also, the renewable fraction is mainly included compared to other energy sources because of zero emission. Besides, the highest power consumption is during the day hours.
The study was conducted using the quantitative descriptive approach at the site of the College of Engineering, University of Al-Qadisiyah (31° 59.686'N and 44° 53.476'E) Here were the steps for this search:
• Evaluation of the study area, as well as its geographical location and data collection.
• Calculation of the roof area for solar mode, where it was directly connected with Google Earth. There were seven roofs, each roof presented single field segment (FS). But they were not equal. PV panels were distributed according to the FSs, as shown in Figure 2.
Figure 2. Distribution and shading heatmap of PV segments field for the study area
• Connection of the installed PV panels with national grid and energy storage using the converter unit.
• Calculation of wire diameters of connected components for HRES.
• Modelization of all collected data for calculating the best way to control the system based on the prediction of shutdown time of national grid as a sensitivity variable.
2.3 Hybrid optimization of multiple energy resources
The HOMER Pro software was used because it offers a number of benefits for the purposes of creating, charting and simulating a small network model. These advantages include its capacity to combine various power sources with numerous other elements necessary for a reliable small grid architecture.
2.3.1 Total load
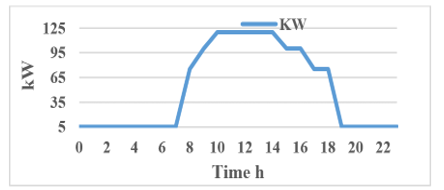
The measured average day load of the college building at a specific geographic region was displayed in Figure 3. The peak value of pregnancy can be observed in the day of (8.30 to 18.30) hr. The unit price for energy was set at $0.041/kWh, while considering the fixed cost of electricity for the utility grid (according to the government standard per unit price for the given location). The peak load was set at 118.73kW, the average was 41.67kW, the daily average consumption was 1000kWh/day and load factor 0.35 with a range of 5 to 15%. The wattmeter was used to measure the electrical power consumption of selected building.
Figure 3. Average scaled day load (kW) as input data
2.3.2 System elements
The power sources were national grid, generator, PV and power storage, as presented in Figure 4. Under constrained circumstances, the software can assess the model's economic and technological viability. A DC to AC converter unit is included in the mini-grid model that is built with a PV source that generates DC power. The converter unit connects the utility grid and the PV-based solar PV to the main line. The system is constructed with a lead-acid 12v and 1kWh each battery storage system for backup purposes. Standard procedure states that a solar panel has a 25-year life span. A 100KVA diesel generator is used, which supplies an electrical capacity of 80kW, to supply and compensate for the demand from the load in periods of poor supply from photovoltaic cells or overload. For studying the effect of changing the hours of the national grid interruption in the sensitivity grid mean repair time (SGMRT) from 0.5 to 3.5 hour/day and finding the optimum design method, the total cost of the hybrid microgrid model was determined. Table 1 presents the specifications and limitations of HRES elements.
Figure 4. HOMER Pro components for the hybrid microgrid model
Table 1. Specifications and limitations of HRES elements
|
Generators CAT-100kVA-50Hz |
Unit |
|
|
Capacity factor |
0.0483 |
% |
|
Hours of operation |
7 |
hrs/yr |
|
Fixed generation cost |
1,501 |
$/hr |
|
Marginal generation cost |
0.189 |
$/kWh |
|
Electrical production |
339 |
kWh/yr |
|
Mean electrical output |
48.4 |
kW |
|
Maximum electrical output |
80 |
kW |
|
Fuel consumption |
95.7 |
L/yr |
|
Specific fuel consumption |
0.282 |
L/kWh |
|
Storage Generic 1kWh Lead Acid |
Unit |
|
|
Autonomy |
0.288 |
hr |
|
Losses |
359 |
kWh/yr |
|
Storage depletion |
1.65 |
kWh/yr |
|
Strings |
20 |
unit |
|
Converter-Inverter |
Unit |
|
|
Capacity factor |
28.1 |
% |
|
Capacity |
95.1 |
kW |
|
Mean output |
26.7 |
kW |
|
Maximum output |
95.1 |
kW |
|
Losses |
12,325 |
kWh/yr |
|
Custom components |
PV |
Unit |
|
Capacity factor |
23.9 |
% |
|
Mean output |
28.4 |
kW |
|
Total production |
248,761 |
kWh/yr |
|
Maximum output |
119 |
kW |
2.3.3 Terms of cost
Cost of energy (COE): In both the individual and combined cases, it is defined as the average cost of useable energy consumed by a customer or the entire amount of electrical load serviced by various renewable sources. A microgrid system's unit-owned equipment is often calculated and represented in dollars/kWh.
$\mathrm{COE}=\frac{\mathrm{A}_{\text {ann,tot }}-A_{\text {boiler }} * B_{\text {boiler }}}{D_{\text {served }}}$ (1)
Aann,tot: total annualized cost of the system $/yr
Aboiler: boiler marginal cost $/kWh
Bboiler: total thermal load served kWh/yr (This term is zero in PV systems that do not support a thermal load (Bboiler=0))
Dserved: total electrical load served kWh/yr
Net current cost (NPC): Also known as the life cycle cost of a particular small network component, NPC provides a cost analysis of the chosen component while taking installation, maintenance, and revenue into account. In other words, it is the mathematical relationship between the total revenue received by a component during a specific time period and the positive sum of all expenditures associated with its installation and operation. It also covers costs for the component's upkeep and services.
One of the most crucial elements taken into account while creating a stable grid model is the renewable fraction, which is defined as the percentage of energy given to the output load via diverse renewable energy sources, such as solar PV, wind, biomass, etc. The entire power system benefits from the high percentage of renewable energy because it lowers all other factors like energy costs, carbon emissions, etc. Eq. (2) provides the mathematical equation for the regeneration fraction.
$\mathrm{F}_{\text {ren }}=1-\frac{\left(\mathrm{C}_{\text {prod }}-\mathrm{C}_{\text {ren }}\right)+\left(\mathrm{D}_{\text {prod }}-\mathrm{D}_{\text {ren }}\right)}{\left(\mathrm{C}_{\text {served }}\right)+\left(\mathrm{D}_{\text {served }}\right)}$ (2)
Cprod: total electrical production kWh
Cren: renewable electrical production kWh
Cserved: (AC primary load served+energy sold to the grid) kWh/yr
Cprod: total thermal production kWh
Cren: renewable thermal production kWh
Dserved: total thermal load served kWh/yr
2.3.4 Terms of comparative cost
Operating cost is defined as the mathematical link between a component's annual total cost and its total cost of capital. The operating cost analysis determines the component's analytical value after deducting the original capital and installation costs. The internal rate of return (IRR) is the discount rate at which the net current cost of the base case and the current system are the same. HOMER computes the internal rate of return by applying a discount rate that equals the present value of the difference between the two cash flow sequences. The amount of years it takes for the cumulative cash flow for the difference between the current system and the base case system to turn positive from negative. Payback indicates how long it will take to repay the difference in investment expenditures between the current and base case systems.
The annual cost reductions associated with the initial investment are referred to as the return on investment (ROI). The average annual difference in nominal cash flows over the project's life is divided by the difference in cost of capital. The following formula is used by HOMER to calculate the return on investment:
ROI $=\frac{\sum_{\mathrm{k}=0}^{\mathrm{R}_{\text {proj }}} \mathrm{C}_{\mathrm{k}, \text { bas }}-\mathrm{C}_{\mathrm{k}}}{\mathrm{R}_{\text {proj }}\left(\mathrm{C}_{\text {cap }}-\mathrm{C}_{\text {cap,bas }}\right)}$ (3)
Ck,bas: nominal annual cash flow for base system
Ck: nominal annual cash flow for current system
Rproj: project lifetime in years
Ccap: capital cost of the current system
Ccap,bas: capital cost of the base system
For summarizing, SGMRT, COE, NPC, IRR and ROI were including to calculate the consumption energy and cumulative nominal cash flow with time. Owing to the high demand with poor energy, it was compensated the needed energy using the renewable energy. Internal rate of return (IRR) is the discount rate at which the net current cost of the base case and the current system are the same.
3.1 PV energy
Owing to the roof area of selected building was fixed, the PV power was limited. Also, the site level was taken in consideration during the installation of solar panels. Figure 5 shows the amount of monthly production of PV energy for a year. It was calculated using Helioscope simulations based on the area's sunshine resources and installed PVs. Where it reached the highest value in the summer/August and the lowest in the winter/December due to the time period of the length of the sunny day with temperature and geographical location.
Figure 5. Monthly production from PV
Table 2. Distribution fields segment setting PV
|
FS |
Tilt |
Azimuth |
Modules |
Nameplate KWP |
SI kWh/m2 |
TSRF % |
|
FS1 |
30.6 |
181.8° |
83 |
26.6 |
2054.4 |
92.3 |
|
FS2 |
30.6 |
181.8° |
55 |
17.6 |
2084.1 |
93.7 |
|
FS3 |
30.6 |
181.8° |
32 |
10.2 |
2089.5 |
93.9 |
|
FS4 |
30.6 |
181.8° |
104 |
33.3 |
2084.8 |
93.7 |
|
FS5 |
30.6 |
181.8° |
80 |
25.6 |
2086.2 |
93.8 |
|
FS6 |
30.6 |
181.8° |
91 |
29.1 |
2078.3 |
93.4 |
|
FS7 |
30.6 |
181.8° |
34 |
10.9 |
2109.2 |
93.8 |
|
|
|
|
total 479 |
total 153.3 |
2080.5 |
93.5 |
Table 3. Operating conditions and production capacity of all PV panels
|
PV Prod. |
Avg. Operating Ambient Temp. |
Avg. Operating Cell Temp. |
Total Collector Irradiance |
Energy Grid |
|
153.3kW |
29.9℃ |
36.7℃ |
1,926.7kWh/m2 |
248767.6kWh |
Table 2 presents the number of fields, distribution of PVs in fields segment, angles of the PV, the values of the installed power, shaded irradiance and resource fraction. shaded irradiance and resource fraction were estimated using the software. A summary of the operating conditions for the panels of the temperature and power output that were limited by area and geographical location to be used later in the Homer software, as presented in Table 3.
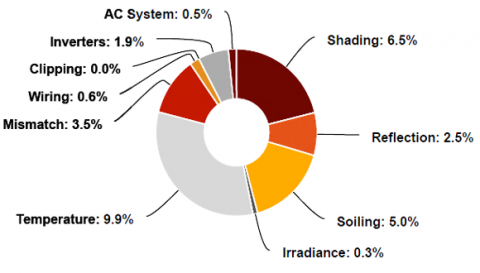
For each system, there are percentages of losses. Figure 6 shows a summary of losses for PV (Helioscope). One of the most important effects was temperature. It had the higher value. The temperature had a negative effect on the efficiency of the panels. Its value was around 9.9%. In addition, the second highest value of loss was for shadows which was around 6.5%. But the lowest value was 0.3% of irradiance.
Figure 6. Sources of system loss from PV
3.2 Hybrid system
Table 4 presents HOMER Pro parameters and productions, when the grid was off. It included the supplied electric power of PV, generator and battery. The PV supplied the highest value of electric power, while the battery supplied the lowest one. The renewable fraction raised, when the SGMRT increased. The renewable fraction (RF) range was (63.36-65.43)%. The optimal RF was 65.43. The SGMRT was (0.5-3.5) hrs. For generator total fuel (GTF), it did not have a clear relation with SGMRT. The diesel generator was installed as a backup electric power source in the hybrid system because the fuel of diesel generators is low-cost in Iraq.
Table 4. HOMER Pro parameters and productions
|
SGMRT h |
Bat. 1kWh |
Con. kW |
RF % |
GTF L/yr |
Generator Prod. kWh |
|
0.5 |
20 |
95.093 |
63.36 |
95.66 |
338.67 |
|
1 |
20 |
95.093 |
63.36 |
95.66 |
338.67 |
|
1.5 |
21 |
93.23 |
63.34 |
100 |
355.84 |
|
2 |
21 |
93.23 |
63.95 |
95.93 |
339.72 |
|
2.5 |
29 |
92.29 |
63.91 |
94.59 |
334.43 |
|
3 |
33 |
92.29 |
64.24 |
100 |
355.84 |
|
3.5 |
40 |
109.07 |
65.43 |
100 |
355.8 |
|
PV=153.3kW |
|||||
|
Generator=80kW |
|||||
|
PV Prod.=248760.8kWh/yr |
|||||
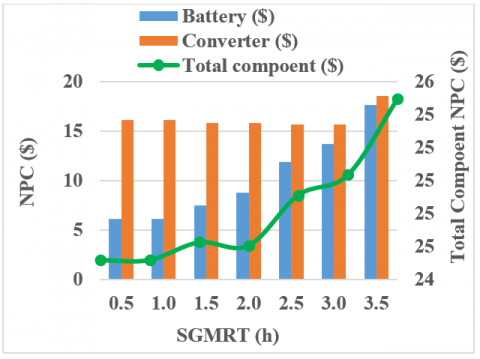
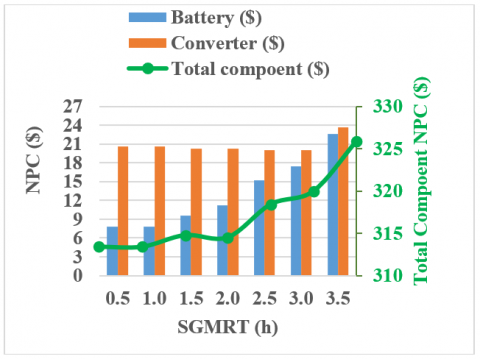
Figure 7 presents NPC for battery, converter and component at SGMRT for one year with neglected cost values of PV (\$5,144.92), generator (\$11,641) and grid (\$5,503.25). This is because the values were small and fixed. The highest cost value of battery was around \$1766.68 at SGMRT 3.5hrs, while the smallest one was \$612.78 at 0.5 and 1hr. The highest and lowest values of converter were \$1,851.45 and \$1566.61 at SGMRT 3.5hrs and (2.5-3) hrs, respectively. The values at SGMRT (2.5-3) hrs were similar because of the battery backup. Component, the highest value was \$25,492.79 at SGMRT 3.5hrs. While, the lower value was \$24,516.68 at SGMRT (0.5-1) hr because of moderate loads. Therefore, the total NPC increased when the SGMRT was raised. For twenty-five years, Figure 8 shows NPC for battery, converter and component at SGMRT with neglected cost values of PV (\$65,769.31), generator (\$1,48819.25) and grid ($70,350.07). It had a similar behavior of Figure 7.
Figure 7. NPC for battery, converter and component at one year
Figure 8. NPC for battery, converter and component at 25 years
3.3 Economic analysis
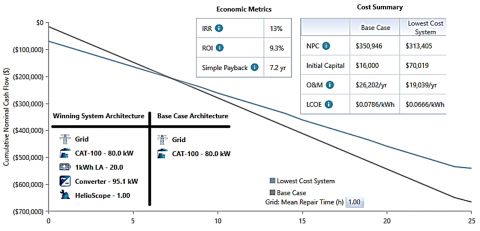
The optimal values were chosen according to the payback of initial cost. It was the main assumption for selecting the optimal time with cost. Figure 9 shows the economic metrics and difference in the value between the lowest cost system (winning system or hybrid-renewable system) and the basic system (grid-generator system) at SGMRT (0.5-1) hr. Owing to the optimal HRES was at SGMRT (0.5-1) hr, other SGMRT values did not include. Generally, cumulative nominal cash flow (CNCF) increased with number of years because of the cost of operation and maintenance (O&M). The initial cost of HRES (\$70,019) was more than the one of base case (\$16,000) due to the construction cost. During the seven years, the CNCF of HRES was higher than CNCF of the basic system, but its rate decreased. This is because the rate of O&M of basic system raised. At 7.2 years, the CNCF of HRES was equal the CNCF of basic system. That point was presented the inflection point in the CNCF. The internal rate of return (IRR) was 13%, and the return on investment (ROI) was around 9%. However, the difference between CNCF of HRES and basic system increased beyond 7.2 years due to the accretion of IRR.
Figure 9. The economic metrics and difference in the value between the lowest cost system and the basic system at SGMRT (0.5-1) hr
The Helioscope software was used to simulate power PV according to College of Engineering/ University of Al-Qadisiyah, Iraq. Then, the results were connected with the designed on-grid, generator, energy storage and converter for modeling the hybrid renewable energy system using HOMER Pro online software. The optimization of hybrid system was done according to NPC, carbon dioxide emission and supplemented electric power. The NPC and carbon dioxide emission of hybrid system was lower than the ones of basic system. Also, the required electric power was added up to the system using PV. The increase of renewable fraction leaded to reduce the NPC and emission. On other side, the best achievement of IRR and IOR of hybrid system were 13% and 9%, respectively. However, the proposed strategy in this study is recommended to be applied in the developed countries those have similar conditions. The increase of segment fields is recommended for getting optimal case at higher SGMRT. For future work, the hybrid system in this study can be experimentally applied based on the proposed scenario, especially for countries have a poor energy with high demand and longer summer like Iraq.
Authors would like to thank the College of Engineering/University of Al-Qadisiyah for supporting this research.
|
HRESs |
Hybrid Renewable Energy Systems |
|
SGMRT |
Sensitivity Grid Mean Repair Time |
|
COE |
Cost of Energy |
|
NPC |
Net Current Cost |
|
IRR |
Internal Rate of Return |
|
TSRF |
Solar Access (Total Solar Resource Fraction)% |
|
SI |
Shaded Irradiance kWh/m2 |
|
FS |
Field Segment |
|
PV Prod. |
Photovoltaics Production |
|
Bat. |
Battery |
|
Con. |
Converter |
|
Subscripts |
|
|
ann,tot |
Total Annualized Cost of the System $/yr |
|
boiler |
Boiler Marginal Cost $/kwh |
|
boiler |
Total Thermal Load Served kwh/yr |
|
served |
Total Electrical Load Served kwh/yr |
|
k,bas |
Nominal Annual Cash Flow for Base System |
|
k` |
Nominal Annual Cash Flow for Current System |
|
proj |
Project Lifetime in Years |
|
cap |
Capital Cost of the Current System |
|
cap,bas |
Capital Cost of the Base System |
[1] Kaygusuz, K. (2011). Energy services and energy poverty for sustainable rural development. Renewable and Sustainable Energy Reviews, 15(2): 936-947. https://doi.org/10.1016/j.rser.2010.11.003
[2] Oyedepo, S.O. (2012). Energy and sustainable development in Nigeria: The way forward. Energy, Sustainability and Society, 2: 1-17. https://doi.org/10.1186/2192-0567-2-15
[3] Reşitoğlu, İ.A., Altinişik, K., Keskin, A. (2015). The pollutant emissions from diesel-engine vehicles and exhaust aftertreatment systems. Clean Technologies and Environmental Policy, 17: 15-27. https://doi.org/10.1007/s10098-014-0793-9
[4] Li, K., Bian, H., Liu, C., Zhang, D., Yang, Y. (2015). Comparison of geothermal with solar and wind power generation systems. Renewable and Sustainable Energy Reviews, 42: 1464-1474. https://doi.org/10.1016/j.rser.2014.10.049
[5] Ali, S., Yan, Q., Sajjad Hussain, M., Irfan, M., Ahmad, M., Razzaq, A., Dagar, V., Işık, C. (2021). Evaluating green technology strategies for the sustainable development of solar power projects: Evidence from Pakistan. Sustainability, 13(23): 12997. https://doi.org/10.3390/su132312997
[6] Shezan, S.A., Hasan, K.N., Rahman, A., Datta, M., Datta, U. (2021). Selection of appropriate dispatch strategies for effective planning and operation of a microgrid. Energies, 14(21): 7217. https://doi.org/10.3390/en14217217
[7] Hajiaghasi, S., Salemnia, A., Hamzeh, M. (2019). Hybrid energy storage system for microgrids applications: A review. Journal of Energy Storage, 21: 543-570. https://doi.org/10.1016/j.est.2018.12.017
[8] Bentouba, S., Bourouis, M., Zioui, N., Pirashanthan, A., Velauthapillai, D. (2021). Performance assessment of a 20 MW photovoltaic power plant in a hot climate using real data and simulation tools. Energy Reports, 7: 7297-7314. https://doi.org/10.1016/j.egyr.2021.10.082
[9] Mekonnen, T., Bhandari, R., Ramayya, V. (2021). Modeling, analysis and optimization of grid-integrated and islanded solar PV systems for the Ethiopian residential sector: Considering an emerging utility tariff plan for 2021 and beyond. Energies, 14(11): 3360. https://doi.org/10.3390/en14113360
[10] Kumar, S., Sethuraman, C. (2021). Sizing optimization and techno-economic analysis of a hybrid renewable energy system using HOMER pro simulation. Journal of Scientific and Industrial Research, 80(9): 777-84.
[11] Abd Al-Rubaye, R.T., Al-Rubaye, A.T.A., Al-Khuzaie, M.M. (2018). Optimal design of hybrid renewable energy system off grid in Al-Diwaniyah, Iraq. IOP Conference Series: Materials Science and Engineering. IOP Publishing, 454(1): 012103. https://doi.org/10.1088/1757-899X/454/1/012103
[12] Ur Rashid, M., Ullah, I., Mehran, M., Baharom, M.N.R., Khan, F. (2022). Techno-economic analysis of grid-connected hybrid renewable energy system for remote areas electrification using homer pro. Journal of Electrical Engineering & Technology, 17(2): 981-997. https://doi.org/10.1007/s42835-021-00984-2
[13] Fukaume, S., Nagasaki, Y., Tsuda, M. (2022). Stable power supply of an independent power source for a remote island using a Hybrid Energy Storage System composed of electric and hydrogen energy storage systems. International Journal of Hydrogen Energy, 47(29): 13887-13899. https://doi.org/10.1016/j.ijhydene.2022.02.142
[14] Zhang, X., Wei, Q.S., Oh, B.S. (2022). Cost analysis of off-grid renewable hybrid power generation system on Ui Island, South Korea. International Journal of Hydrogen Energy, 47(27): 13199-13212. https://doi.org/10.1016/j.ijhydene.2022.01.150
[15] Santos, L.H.S., Silva, J.A.A., López, J.C., Arias, N.B., Rider, M.J., Da Silva, L.C.P. (2021). Integrated optimal sizing and dispatch strategy for microgrids using HOMER Pro. In 2021 IEEE PES Innovative Smart Grid Technologies Conference-Latin America (ISGT Latin America), Lima, Peru, pp. 1-5. https://doi.org/10.1109/ISGTLatinAmerica52371.2021.9543015
[16] Litardo, J., Palme, M., Hidalgo-León, R., Amoroso, F., Soriano, G. (2021). Energy saving strategies and on-site power generation in a university building from a tropical climate. Applied Sciences, 11(2): 542. https://doi.org/10.3390/app11020542
[17] Bedadi, L.A., GebreMichael, M.G. (2021). Design and optimization of off‐grid hybrid renewable power plant with storage system for rural area in Rwanda. IET Renewable Power Generation, 15(15): 3715-3731. https://doi.org/10.1049/rpg2.12267
[18] Ali, F., Ahmar, M., Jiang, Y., AlAhmad, M. (2021). A techno-economic assessment of hybrid energy systems in rural Pakistan. Energy, 215: 119103. https://doi.org/10.1016/j.energy.2020.119103
[19] Salameh, T., Abdelkareem, M.A., Olabi, A.G., Sayed, E.T., Al-Chaderchi, M., Rezk, H. (2021). Integrated standalone hybrid solar PV, fuel cell and diesel generator power system for battery or supercapacitor storage systems in Khorfakkan, United Arab Emirates. International Journal of Hydrogen Energy, 46(8): 6014-6027. https://doi.org/10.1016/j.ijhydene.2020.08.153
[20] Baruah, A., Basu, M., Amuley, D. (2021). Modeling of an autonomous hybrid renewable energy system for electrification of a township: A case study for Sikkim, India. Renewable and Sustainable Energy Reviews, 135: 110158. https://doi.org/10.1016/j.rser.2020.110158
[21] Arévalo, P., Eras-Almeida, A.A., Cano, A., Jurado, F., Egido-Aguilera, M.A. (2022). Planning of electrical energy for the Galapagos Islands using different renewable energy technologies. Electric Power Systems Research, 203: 107660. https://doi.org/10.1016/j.epsr.2021.107660
[22] Umer, F., Aslam, M.S., Rabbani, M.S., Hanif, M.J., Naeem, N., Abbas, M.T. (2019). Design and optimization of solar carport canopies for maximum power generation and efficiency at Bahawalpur. International Journal of Photoenergy, 2019. https://doi.org/10.1155/2019/6372503