Dang Thi My Ngan![]() | Tran Nha Ghi*
| Tran Nha Ghi*![]() | Ho Viet Tien
| Ho Viet Tien![]()
© 2024 The authors. This article is published by IIETA and is licensed under the CC BY 4.0 license (http://creativecommons.org/licenses/by/4.0/).
OPEN ACCESS
In Vietnam, the issue of food waste in households is alarming, causing adverse impacts on the environment and society, leading to wastage, and inflicting economic losses. Food waste behavior has received considerable attention from scholars; however, this issue needs to be expanded and has yet to be widely validated in Vietnam. This study aims to evaluate the factors of habits from the Motivation-Opportunities-Abilities theory influencing the food waste volume at the household level in Vietnam. The study utilized the Partial Least Square Structural Equation Model (PLS-SEM) with 203 individuals from households in Vietnam. The findings reveal that the habit of Planning and Storing has a negative effect on food waste volume. In contrast, habits such as Eating, Shopping, Cooking, and Assessing edibility significantly and positively impact household food waste volume, except for Managing leftovers and Redistribution. This research makes a notable contribution by providing empirical evidence on the importance of drivers of food waste behavior at the household level in developing countries like Vietnam. This helps households adjust their habits to reduce food waste released into the external environment. Finally, some limitations and suggestions for further research are proposed in this study.
food waste habits, household, Vietnam
The issue of food waste has been concerned for a period of time, but only after the research on food loss and food waste conducted by FAO in 2011 did it become a global issue [1], which showed that the food waste in the entire value chain of food was up to 1,3 million tons per year, accounting for 20% of the total agricultural production [1]. After that, food waste became one of the strategic targets in 17 SDG of the United Nations, section 12.3 “12.3 By 2030, halve per capita global food waste at the retail and consumer levels and reduce food losses along production and supply chains, including post-harvest losses”.
Food loss and food waste happen in the entire value chain of food, from production; harvest, storage after harvest; process, distribution, and consumption. Only household consumption or food retail accounts for 22% of the total food loss/waste of the whole value chain of food [2]. Food waste during consumption causes 36% of the greenhouse gas emitted from food [2]. UNEP [3] also shows that only the amount of food waste during consumption comprises up to 931 million tons in 2019 [1]. In downstream food waste, up to 61% of food waste comes from households, 26% from food businesses like restaurants and food stalls, and 13% from retail stores like supermarkets and grocery stores [3]. In other words, household food waste comprises 11% of the total annual food production [3].
According to UNEP [3], household food waste relatively varies in different parts of the world and among countries with different development levels. Household food waste in Vietnam is at the world average of 76kg per capita per year in comparison with 74kg per capita per year in the world [3-5]. Solid waste includes not only food waste but also other kinds of waste from households, and on the contrary, food waste can also be sewage discharged through drainage systems. Ho Nguyen Thao [6] indicates that Vietnam currently ranks second in the Asia-Pacific region for food waste, with over 8 million tons of edible or usable food being lost or discarded yearly, causing an estimated loss of about 3.9 billion USD annually, nearly 2% of the current GDP. The food waste rate in Vietnam is twice as high as that of advanced and wealthy economies worldwide. With the estimate of UNEP [3], food waste from households in Vietnam accounts for up to 7,346,717 tons/year, equivalent to the total amount of rice exported from Vietnam to the world.
What factors have contributed to the increase in food waste? What is the cause of food waste? Since 2000, there have been thousands of articles assessing food waste in prestigious journals indexed on the list of Scopus or Web of Science (WOS) [7]. For instance, Schanes et al. [8] reassess different approaches of these researchers in terms of food use behaviours, ranging from concerns about the negative impact of food waste on the environment, the influence of social norms, the desire of perceived behavioral control of individual consumer, to daily activities regarding of food use. Schanes et al. [8] also notice the influence of consumers’ socio-demographic characteristics on food waste causes. Principato et al. [9] also point out that food consumption acts can produce food waste, including food planning, storage, cooking, eating and giving to livestock or making organic fertilizers. Mishra et al. [10] suggest assessing food waste in different ways such as approaching consumers, or food managers of food businesses in person. Mishra et al. [10] evaluate the influence of food waste on the environment and the solutions to minimize food waste, from manufacturing to consumption. Meanwhile, research by these authors on food waste in households in Vietnam is either in favor of measuring the amount of solid waste at the household level in Da Nang and Mekong Delta [4, 5], or managing food waste once discharged in landfills in Ho Chi Minh City [11], or managing to handle the smell of food waste in landfills, i.e., how to recycle food waste [12], or a sustainable solution to food waste in Da Nang City [13].
From the previous research, there is still little evidence in the literature about studies on consumers’ habits of food waste in Vietnam. In this context, the identified research gap is supported by recent studies from scholars [14]. For instance, customers’ habits reduce food waste [15], and customers’ routines determine food waste behaviour [16]. The contribution of this study is to enhance understanding of the impact of customers’ habits on food waste at the household level in developing countries like Vietnam, where previous research has yet to be widely conducted.
The main reason why this study chose households in Vietnam is that. Firstly, family structures in Vietnam are undergoing significant changes: family sizes have become smaller, from extended multi-generation families to nuclear families. Secondly, the percentage of urban households increased from 20% to 40% after 20 years, income shifted from low-income to lower middle income according to World Bank standards, and the percentage of single-member families increased rapidly. Thus, all these changes strongly affect family meals, affecting the level and composition of food waste in the family and the food waste behaviour of each family member in Vietnam.
Therefore, this study is an original study that attempts to compensate for the existing literature. More specifically, it seeks to investigate the following research questions (RQs):
RQ1: Which are components to measure the customer's habits at households in Vietnam?
RQ2: What are the direct effects of customers' habits on waste food at the household level in Vietnam?
In order to adopt these RQs, this study draws on the Motivation-Opportunity-Ability theory to identify the main factors affecting food waste habits at the household level in Vietnam. Data were collected from 203 individuals at household level in Vietnam. After the introduction, the study will present the literature review, methods, results, discussion, and conclusion.
2.1 Food waste definition
In this study, the food waste definition is based on Barnhill and Civita [17], “Food waste could be defined as livestock and nutritive plant, animal, mineral, or fungal materials used in ways that do not provide sufficient benefit and value”.
2.2 Motivation-Opportunity-Ability theory (MOA)
From the abovementioned research, almost every article regarding food waste is based on the TPB theory. It was not until 2023, with the articles by 16 authors [7] that the MOA theory showed the possibility of use and effectiveness in dealing with this matter. Vittuari et al. [7] suggest applying another hypothesis in explaining food waste, that is Motivation – Opportunity – Ability theory (MOA theory). Principato et al. [9] assume that household food waste behavior should be prioritized by explanation with personal aspects such as personal psychological factors (knowledge of food waste and its harmful effect, perceived behavioural control, attitudes towards food waste, emotions, and habits). Personal factors are also expressed as respect for social standards, consumer personal standards, the context of food waste behaviour, as well as consumer socio-demographic characteristics.
The concept of "personal ability" is considered to include the understanding of behaviour and behavioural habits. In the model of Ölander and Thøgersen [18], habits act as an independent variable, as well as mediating variables that can affect the relationship between behavior and motivation. The model of Ölander and Thøgersen [18] has proved effective in explaining human behaviours toward the environment in the context of global environmental issues becoming increasingly fierce. Research on personal ability is often aimed at understanding, the perception of food waste, especially habits.
Vittuari et al. [7] classify factors affecting food waste into 3 groups using the MOA model as follows. Firstly, the motivation factors include personal motivation such as attitude, awareness, perceived behavioural control, emotion and commitment. Secondly, the group of opportunity factors include micro, meso, and macro contexts, such as the availability level of techniques or technologies, time, procedures and lifestyle, food context (large or small packages, supermarkets, or conventional markets, for example), provision - adequate provision for consumers to buy appropriate food at appropriate intervals conveniently, legal framework and regulations. Finally, the ability factors are skills and ability, habits, knowledge of cooking techniques and effective food management, and kitchen tips for reducing food waste.
In this study, the component of habits belonging to the Ability of the MOA theory is used. Habits are controlled by awareness, but they are often done by subconscious, even unconscious factors rather than rationality. Food- and food-waste-related habits include 8 stages: planning, shopping, storing, cooking, eating, managing leftovers, redistribution and assessing edibility [8].
2.3 Hypotheses development
2.3.1 Planning
Making plans before shopping for food is essential only to buy a little. Making plans may mean writing down a list of what you need to buy, the necessary amount/number, the type of food to buy and what and how much food remains in the refrigerator, or asking other family members before going shopping to avoid buying the same food that is still available at home [19]. Some studies point out the positive effect of planning and reducing food waste [20], while others do not confirm that cause-effect relationship.
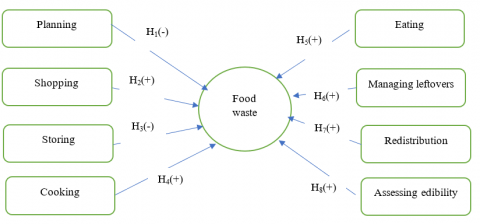
H1: Planning is negatively related to the amount of food waste
2.3.2 Shopping
Shopping for too much food is the main cause of food waste [21]. This is because, first, the buyer wants to express themselves as a caring parent, a good spouse, or a kind landlord. Thus, the buyer tends to buy more in terms of quantity and more in terms of quality. Second, the buyer will buy more than needed because each family member has a different taste. Third, as a Vietnamese saying goes, “good meals and good sleep make you as fit as a fiddle – ăn được ngủ được là tiên”, thus, many people eat more than necessary. Fourth, they intend to buy more because they don’t have time to go shopping. Fifth, if you buy in bulk, you may get discounts or promotions from the sellers. Sixth, excess buying is caused by large packages [8].
H2: Shopping is positively related to the amount of food waste
2.3.3 Storing
In general, storing and regularly classifying as well as re-classifying, together with re-arranging food in the storage, will help to reduce the amount of food waste [20]. Food can last longer if cooled, but in return, cooling facilities require electricity. Overall, proper storage will reduce the amount of food waste.
H3: Storing is negatively related to the amount of food waste
2.3.4 Cooking
There are several causes of cooking too much food: first, to express the hospitality of the landlord to guests, a greeting landlord will make more dishes that guests can consume [22]; second, poor cooking skills, unable to estimate the amount of cooked food to be consumed, or allocating too significant portion, this may be because of the manufacturers processing food in the more extensive package to sell more; third, the family have many kids or teenagers, and it is uncertain about whether they are going to eat at home or eat out without advance notice [23]; fourth, as all the family members get together for meals, it is impossible to predict precisely who will eat what, so more food will be cooked just in case many members have interests in the same dishes, leaving a great number of leftovers. Fifth, dishes are cooked according to recipes in cookbooks or cooking shows; sixth, some family members prefer takeaways while others have favor in home-cooked dishes, etc... Those who prefer takeaways will produce more food waste [24].
H4: Cooking is positively related to the amount of food waste
2.3.5 Eating
First, Vietnamese traditional families like to eat one kind of food together, or all family members get only one set menu. Next, when eating at home, children cause more food waste than adults. This is because children’s taste keeps changing quickly. It rushes in and rushes out [23]. On the contrary, adults spend more money eating out. They have more chances to go to restaurants or food courts with their friends or colleagues, either being invited or unexpectedly ‘trapped’ to treat others [25]. These two features of age contribute to the amount of household food waste. Vietnamese people's cultural or psychological factors are essential to food waste. More than 50% of the food wasted was initially created due to a "portion" mentality for those who could not be at that meal with their families. Not to mention factors such as appearance or "facial expressions," for example, leaving leftover food on plates or leftover meals at parties [6].
H5: Eating is positively related to the amount of food waste
2.3.6 Managing leftovers
Households find it quite troublesome to assess whether the leftovers are edible or not, or how long it would be possible for the leftovers to stay edible. In some cultures, the “householder” is ‘willing’ to offer freshly cooked dishes to others while he/she eats the leftovers as “a leftover bin” [26]. Otherwise, he/she would be considered as a bad or inconsiderate father/mother to treat her kids with leftover food. In particular, landlords never offer the leftovers to their guests; if doing so, the landlords will be understood as a lack of hospitality, as if they were asking the guests to leave [26].
H6: Managing leftovers is negatively related to the amount of food waste
2.3.7 Disposal/redistribution
Unlike hotels, restaurants, or supermarkets, where the amount of food close to expiration dates is great enough to join the network redistributing expiring food to ultimate consumers in the food chain, those families can only use excess food to feed their livestock. People often think it is better to feed livestock with excess food rather than throw it into landfills. In other words, if the food is inedible to humans, it is edible to livestock [27]. However, excess food can be used to feed livestock if the livestock is raised on a small scale. Ranches certainly can never use leftover food or excess food to feed their livestock in industrial farms or cattle as these kinds of food do not meet nutritional requirements for their animals, not to mention the concern about hygiene and safety and the possibility of mass poisoning. After all, the leftovers will be transported to waste treatment facilities and biomass processors to produce biogas and generate electricity afterwards. If not, these leftovers can only be dumped straight into the landfills.
H7: Disposal/redistribution is negatively related to the amount of food waste
2.3.8 Assessing edibility
In every stage mentioned above, consumers regularly reassess if the food is still edible. It is not easy to assess the quality of the food at home as it has no expiring information. Thus, the owner often smells or tastes it to decide whether the food is still in good condition or if it is better to be given to the livestock or the landfills. Studies show that it is a difficult decision: if keeping food for family members, and accepting hidden health risks, they may have to pay later for medicine if unwanted things happen. Moreover, medical treatments may cost them much more than the money they should spend on fresh food. If they decide to give the food to their livestock or just simply dump it into the landfills, they will simply get rid of all related worries. The more criteria that the householder uses to assess the edibility of the leftovers, the more of them fail the “test”. Thus, a greater amount of food waste would be discharged [25].
H8: Assessing edibility is positively related to the amount of food waste
Based on the arguing research hypotheses, the research model is proposed in Figure 1.
Figure 1. Proposed research model
3.1 Research design
This study is carried out using both qualitative and quantitative research methods.
Qualitative research: The qualitative research involves group discussions with 9 individuals from various households, along with some open-ended question interviews. This method aims to determine which factors affect the discharge of food waste and refine the measurement scale for forming the survey questionnaire.
Quantitative research: Data collection: The survey subjects are households living and working in Vietnam. To reduce method bias, one family member represents the household in answering the questionnaire. After agreeing to participate in the survey, the questionnaire can be sent via email or used in a face-to-face or online interview.
Sample: The total number of household responses was 375 (including 241 online responses and 134 direct responses), but the number of valid responses was 203 (a response rate of 54%). The official sample used in this study consists of 203 responses.
The estimation method in this study is PLS-SEM, and it followed the steps outlined by Hair et al. [28] to assess the measurement model and structural model. SmartPLS 4.0.9.2 was utilized for data analysis:
Measurement model: Cronbach’s Alpha (α) and composite reliability (CR) values are both greater than 0.7 to assess internal consistency reliability. Outer loadings (> 0.7) and AVE (> 0.5) values are used to evaluate convergent validity. Finally, discriminant validity is assessed based on the HTMT matrix (< 0.9). The criteria for evaluating the measurement model are based on the standards set by Hair et al. [28].
Structural model: The model's explanatory power is assessed by R². R² values of 0.75, 0.5, and 0.25 are evaluated as strong, moderate, and weak, respectively. The effect size (f²) values of 0.35, 0.15, and 0.02 are considered large, medium, and small, respectively [29]. The Stone-Geisser value of Q² indicates weak predictive relevance (Q² < 0.02), moderate predictive relevance (Q² between 0.02 and 0.35), and strong predictive relevance (Q² > 0.35) [30].
3.2 Measurement
The dependent variable will be the level of family food waste, which can be measured daily or weekly. However, for comparison purposes, it is necessary to convert family food waste to a per capita and per day basis. This measurement scale is adapted from the studies of Thanh et al. [4] and Vetter-Gindele et al. [5] to measure the level of Vietnamese food waste (FW).
The scale for measuring the customers’ habits of households is adapted from the study by Schanes et al. [8]. Specifically, the scales are as follows: Assessing Edibility (AE) (AE1 → AE6); Cooking (CO) (CO1 → CO3); Eating (EA) (EA1 → EA6); Managing Leftovers (ML) (ML1 → ML5); Planning (PL) (PL1 → PL4); Shopping (SH) (SH1 → SH5); Storing (ST) (ST1 → ST5); and Redistribution (RE) (RE1 to RE6), measured by 6, 3, 6, 5, 4, 5, 5, and 6 items respectively.
4.1 Demographic characteristics of the respondents
Table 1 presents the main characteristics of the sample's demographic profile. The age group 26-39 accounted for the largest proportion of the sample, with 137 individuals, representing 67.50%. Regarding gender, females constituted the majority, with 142 individuals, equivalent to 70%. In terms of the highest education level, respondents with college and university degrees totaled 138 individuals, equivalent to 68%. Concerning occupation, employees constituted the largest proportion, with 170 individuals accounting for 83.70%. Participants engaged in food shopping and cooking represented the largest proportion, with 116 individuals, equivalent to 57.10%. Regarding income, individuals earning between 15-30 million dong represented the highest proportion, with 74 individuals (36.50%). Finally, families with 04, 03, and 02 members were the most popular, accounting for 33.50%, 21.20%, and 15.80%, respectively.
Table 1. Characteristics of the respondents
|
N = 203 |
Percentage |
||
|
Age |
Below 18 |
- |
- |
|
18-25 |
21 |
10.30 |
|
|
26-39 |
137 |
67.50 |
|
|
40-59 |
41 |
20.20 |
|
|
Above 60 |
4 |
2.00 |
|
|
Gender |
Male |
61 |
30.00 |
|
Female |
142 |
70.00 |
|
|
Education level |
High school or lower |
4 |
2.00 |
|
College/ University |
138 |
68.00 |
|
|
Postgraduate |
61 |
30.00 |
|
|
Job |
Student |
3 |
1.50 |
|
Employee |
170 |
83.70 |
|
|
Self-employed |
3 |
1.50 |
|
|
Manual workers |
11 |
5.40 |
|
|
Housemaker |
2 |
1.00 |
|
|
Retired |
4 |
2.00 |
|
|
Others |
10 |
4.90 |
|
|
The role in preparing meals |
Grocery shopping |
33 |
16.30 |
|
Cooking |
12 |
5.90 |
|
|
Both above |
116 |
57.10 |
|
|
None of the above |
42 |
20.70 |
|
|
Income |
< 15 million dong |
37 |
18.20 |
|
15 - 30 million dong |
74 |
36.50 |
|
|
30 - 60 million dong |
62 |
30.50 |
|
|
60 - 100 million dong |
19 |
9.40 |
|
|
> 100 million dong |
11 |
5.40 |
|
|
Family members |
1 |
13 |
6.40 |
|
2 |
32 |
15.80 |
|
|
3 |
43 |
21.20 |
|
|
4 |
68 |
33.50 |
|
|
5 or over |
47 |
23.20 |
4.2 Measurement model
4.2.1 Internal consistency
The Cronbach’s Alpha (α) and composite reliability (CR) coefficients were utilized to evaluate internal consistency reliability. Both α and CR values ranged between 0.721 and 0.890, with all constructs exceeding the required threshold of 0.7 (refer to Table 2). According to the standards set by Hair et al. [28], internal consistency reliability is satisfied.
4.2.2 Convergent validity
To assess convergent validity, the study utilized the criteria set by Hair et al. [28], which stipulates that the outer loading values should be greater than or equal to 0.7, and the average variance extracted (AVE) should exceed 0.5. The results indicated that all outer loading values had a minimum value of 0.703, meeting the criterion of being equal to or higher than 0.7. Additionally, the AVE values were greater than 0.5 (refer to Table 2). Consequently, all constructs ensured convergent validity.
4.2.3 Discriminant validity
The study employed the Fornell-Larcker criteria to assess discriminant validity (Table 3) and the Heterotrait-Monotrait ratio (HTMT) (Table 4) [28, 31].
Table 3 demonstrates that all the values in bold on the diagonal or the square root of AVEs values are higher than the correlation coefficients between the constructs in the same column. Thus, according to the Fornell-Larcker criteria [28, 32], all constructs are satisfied.
In Table 4, the HTMT matrix presents values smaller than 0.90 [28, 31], meeting the HTMT requirements. Therefore, based on the results of the Fornell-Larcker criteria and the HTMT assessment, it can be concluded that the discriminant validity of all the constructs is ensured in the proposed model.
Table 2. Outer loading, Cronbach’s Alpha, CR and AVE
|
Constructs |
Items |
Outer Loadings |
α |
CR |
AVE |
|
Assessing edibility |
AE1 |
0.770 |
0.768 |
0.851 |
0.713 |
|
AE2 |
0.874 |
||||
|
AE3 |
0.718 |
||||
|
AE4 |
0.821 |
||||
|
AE5 |
0.753 |
||||
|
AE6 |
0.802 |
||||
|
Cooking |
CO1 |
0.882 |
0.797 |
0.779 |
0.719 |
|
CO2 |
0.811 |
||||
|
CO3 |
0.826 |
||||
|
Eating |
EA1 |
0.716 |
0.763 |
0.724 |
0.601 |
|
EA2 |
0.842 |
||||
|
EA3 |
0.814 |
||||
|
EA4 |
0.703 |
||||
|
EA5 |
0.867 |
||||
|
EA6 |
0.782 |
||||
|
Managing leftover |
ML1 |
0.742 |
0.89 |
0.785 |
0.758 |
|
ML2 |
0.814 |
||||
|
ML3 |
0.703 |
||||
|
ML4 |
0.723 |
||||
|
ML5 |
0.803 |
||||
|
Planning |
PL1 |
0.900 |
0.778 |
0.845 |
0.749 |
|
PL2 |
0.925 |
||||
|
PL3 |
0.819 |
||||
|
PL4 |
0.812 |
||||
|
Shopping |
SH1 |
0.771 |
0.873 |
0.778 |
0.733 |
|
SH2 |
0.739 |
||||
|
SH3 |
0.784 |
||||
|
SH4 |
0.764 |
||||
|
SH5 |
0.707 |
||||
|
Storing |
ST1 |
0.761 |
0.882 |
0.721 |
0.766 |
|
ST2 |
0.799 |
||||
|
ST3 |
0.803 |
||||
|
ST4 |
0.784 |
||||
|
ST5 |
0.705 |
||||
|
Redistribution |
RE1 |
0.762 |
0.722 |
0.712 |
0.689 |
|
RE2 |
0.711 |
||||
|
RE3 |
0.716 |
||||
|
RE4 |
0.725 |
||||
|
RE5 |
0.732 |
||||
|
RE6 |
0.723 |
Table 3. Discriminant validity evaluation using Fornell-Lacker test
|
1 |
2 |
3 |
4 |
5 |
6 |
7 |
8 |
9 |
|
|
1. EA |
0.844 |
||||||||
|
2. CO |
0.653 |
0.848 |
|||||||
|
3. EA |
0.732 |
0.668 |
0.775 |
||||||
|
4. FW |
0.606 |
0.629 |
0.601 |
1 |
|||||
|
5. ML |
0.626 |
0.754 |
0.743 |
0.699 |
0.871 |
||||
|
6. PL |
0.762 |
0.741 |
0.751 |
0.692 |
0.734 |
0.865 |
|||
|
7. RE |
0.663 |
0.657 |
0.699 |
0.674 |
0.654 |
0.781 |
0.830 |
||
|
8. SH |
0.757 |
0.795 |
0.741 |
0.792 |
0.758 |
0.664 |
0.661 |
0.856 |
|
|
9. ST |
0.736 |
0.624 |
0.736 |
0.653 |
0.63 |
0.772 |
0.634 |
0.705 |
0.875 |
Table 4. Discriminant validity evaluation using HTMT test
|
1 |
2 |
3 |
4 |
5 |
6 |
7 |
8 |
9 |
|
|
1. EA |
|||||||||
|
2. CO |
0.793 |
||||||||
|
3. EA |
0.730 |
0.872 |
|||||||
|
4. FW |
0.779 |
0.791 |
0.732 |
||||||
|
5. ML |
0.781 |
0.663 |
0.799 |
0.761 |
|||||
|
6. PL |
0.651 |
0.634 |
0.741 |
0.792 |
0.667 |
||||
|
7. RE |
0.659 |
0.632 |
0.713 |
0.774 |
0.706 |
0.791 |
|||
|
8. SH |
0.678 |
0.669 |
0.688 |
0.625 |
0.746 |
0.789 |
0.776 |
||
|
9. ST |
0.795 |
0.686 |
0.688 |
0.677 |
0.713 |
0.717 |
0.759 |
0.724 |
4.2.4 Common method bias
According to Guide Jr. and Ketokivi [33], Common Method Biases (CMB) often occur in survey-based studies, especially when the research relies solely on a single informant. Following the suggestion of Kock [34], the study utilized the full collinearity variance inflation factors (VIFs) test criteria to identify CMB. The VIF threshold 5 is commonly used in CMB tests when employing PLS-SEM algorithms. Table 5 presents the values of the full VIF for each construct, all of which are less than 5. Therefore, the proposed research model does not violate CMB [35].
Table 5. Full collinearity statistics (VIF)
|
Food Waste Volume |
|
|
Assessing edibility |
1.058 |
|
Cooking |
1.225 |
|
Redistribution |
1.098 |
|
Eating |
1.257 |
|
Managing leftover |
1.172 |
|
Planning |
1.057 |
|
Shopping |
1.142 |
|
Storage |
1.071 |
4.2.5 Model fit
To assess goodness-of-fit indices, the Standardized Root Mean Square Residual (SRMR) and the Normed Fit Index (NFI) were utilized [36]. An SRMR smaller than the threshold value of 0.08. Henseler et al. [36] and an NFI value exceeding the cut-off value of 0.8 recommended by Hu and Bentler [37] indicate a good fit model. Table 6 indicates that both the SRMR and NFI values meet the criteria for a good fit model.
Table 6. Model fit results
|
Saturated Model |
Estimated Model |
|
|
SRMR |
0.079 |
0.079 |
|
d_ULS |
4.016 |
4.016 |
|
d_G |
1.7 |
1.7 |
|
Chi-square |
3937.565 |
3937.565 |
|
NFI |
0.971 |
0.971 |
4.2.6 Assessment of the structural model
Table 7 presents the results of the structural model evaluation, indicating that 6/8 of the proposed research hypotheses are accepted. Specifically, Planning and Storing have a negative effect on food waste volume (H1: β = -0.189, p = 0.002 < 0.01; H3: β = -0.145, p = 0.021 < 0.05). These results provide strong support for H1 and H3. Eating as the best predictor of food waste volume (H5: β = 0.225; p = 0.004 < 0.01), with support for H5, Shopping (H2: β = 0.166, p-value = 0.002 < 0.01), and Cooking (H4: β = 0.162, p-value = 0.016 < 0.05). These findings strongly support H2, H4, and H7. Additionally, assessing edibility is a significant predictor of food waste volume (H8: β = 0.13, p-value = 0.033 < 0.05), with strong support for H8. Finally, managing leftovers and redistribution contradict expectations, so H6 and H7 are rejected.
The study also assessed the model's explanatory power using the coefficient of determination (R2) for all endogenous constructs (Table 7). According to Hair et al. [28], R2 values can be categorized as weak (0.25), medium (0.50), and substantial (0.75). Table 7 indicates that the R2 value is 0.378, which is greater than 0.25, suggesting that the model has a moderately weak explanatory power. In addition, the effect size of each endogenous construct was evaluated using Cohen’s f2 criterion. The f2 values proposed threshold values of 0.35, 0.15, and 0.02 correspond to large, medium, and small effects, respectively [29]. Table 7 displays different effect sizes can be noticed: f2AE→FSV = 0.026; f2COO→FSV = 0.034; f2EA→FSV = 0.065; f2ML→FSV = 0.02; f2PL→FSV = 0.054; f2RE→FSV = 0.052; f2SH→FSV = 0.039; f2ST→FSV = 0.031, respectively.
Furthermore, the study utilized Stone-Geisser’s Q-square value, proposed by Stone [30], to assess the model's predictive relevance for all the endogenous constructs [28]. Table 7 displays the Q2 value, which is 0.257 and larger than 0. This indicates that the exogenous constructs have acceptable predictive relevance for the endogenous constructs in the proposed research model.
Table 7. Hypothesis testing
|
Hypothesis |
Path |
b |
P values |
Results |
|
H1 |
Planning → Food waste volume |
-0.189*** |
0.002 |
Supported |
|
(0.062) |
|
|||
|
H2 |
Shopping → Food waste volume |
0.166*** |
0.002 |
Supported |
|
(0.054) |
|
|||
|
H3 |
Storage → Food waste volume |
-0.145** |
0.021 |
Supported |
|
(0.063) |
|
|||
|
H4 |
Cooking → Food waste volume |
0.162** |
0.016 |
Supported |
|
(0.067) |
|
|||
|
H5 |
Eating → Food waste volume |
0.225*** |
0.004 |
Supported |
|
(0.079) |
|
|||
|
H6 |
Managing leftover → Food waste volume |
0.122** |
0.040 |
Rejected |
|
(0.059) |
|
|||
|
H7 |
Redistribution → Food waste volume |
0.189*** |
0.001 |
Rejected |
|
(0.055) |
|
|||
|
H8 |
Assessing edibility → Food waste volume |
0.13** |
0.033 |
Supported |
|
(0.061) |
|
|||
|
R2Food waste volume |
0.378 |
|||
|
Stone-Geisser’s Q2 |
0.257 |
|||
|
f2 |
f2AE→FSV = 0.026; f2COO→FSV = 0.034; f2EA→FSV = 0.065; f2ML→FSV = 0.02; f2PL→FSV = 0.054; f2RE→FSV = 0.052; f2SH→FSV = 0.039; f2ST→FSV = 0.031 |
|||
This study aimed to examine the direct effects of individual habits within Vietnamese households on the amount of food waste. The results supported all the hypotheses in the proposed research model.
More precisely, Eating could be considered as the best predictor of food waste volume (H5: β = 0.225; p < 0.01), followed by Planning (H1: β= -0.189, p < 0.01); Redistribution (H7: β=0.189; p-value < 0.01); Shopping (H2: β = 0.166, p-value < 0.01); Storing (H3: β= -0.145, p < 0.05 ); Cooking (H4: β = 0.162, p-value < 0.05), Assessing edibility (H8: β=0.13, p-value< 0.05), and finally by Managing leftover (H6: β=0.122, p-value< 0.05). Finally, the coefficient of determination (R2) is 0.378 on the variance of the amount of food waste.
The results are consistent with existing literature that explores drivers of food waste behavior at the household level in Vietnam. For instance, Planning negatively affects the amount of food waste. However, some previous studies have indicated a positive effect of planning on reducing food waste [20]. Before going shopping, homemakers plan regarding the amount of food needed to buy and adhere to family members' dietary needs and preferences. This helps reduce the food waste volume released into the external environment. Hypothesis H2 suggests that shopping has a positive relationship with food waste volume. This finding supports previous studies indicating that shopping is a primary cause of food waste [8, 21]. Besides, Hypothesis H3 suggests that storing is negatively related to the amount of food waste, which is similar to results from previous studies highlighting that storing will help reduce the amount of food waste [20]. Furthermore, Hypothesis H4 suggests that cooking has a positive relationship with food waste volume, consistent with previous studies. For example, a generous host might prepare more dishes than guests can consume, leading to food waste [22]; the family has many kids or teenagers and it is uncertain about whether they are going to eat at home or eat out without advance notice [23]. In addition, Hypothesis H5 suggests that Eating is positively related to the amount of food waste, reinforcing the importance and contribution of eating to food waste volume. In Vietnam, families with children often generate more food waste, as children may consume only some of the food served to them. Additionally, cultural norms may encourage leaving leftover food on the plate due to politeness or a sense of decorum [6]. Furthermore, we found rejection for Hypothesis H6. Reusing leftovers is thought to be one of the best ways to reduce food waste in households [38]. People who consistently consume leftover meals waste less food [16]. Additionally, the positive influence of Disposal/redistribution on the amount of food waste (H7) is not in line with other studies. This can be explained by the fact that if food is inedible to humans, it may still be edible to livestock [27]. Finally, our results regarding H8: Assessing edibility is positively related to the amount of food waste. This is consistent with previous literature highlighting that the more rigorous the householder's assessment of the edibility of leftovers, the more likely they are to fail the "test." Thus, more food waste would be discarded [25, 39]; as it is considered safer for health to dispose of leftover food rather than risk consuming it.
5.1 Theoretical contributions
This study has several theoretical implications for the literature on drivers of food waste behavior at the household level in Vietnam. The research applied 8 components of Habits as part of the Ability factor in the M-O-A model to examine the 8 factors influencing food waste behavior. For instance, it is among the first studies to draw on the proposal by Schanes et al. [8] to assess the impact of routines/habits on food waste behavior. This represents a notable contribution with empirical evidence on the importance of drivers of food waste behavior at the household level in developing countries such as Vietnam. Future studies should expand on these findings by integrating Motivation and Opportunity factors to explain household practices in food waste behavior.
5.2 Implications for practice
The findings of this study could offer valuable guidance to households in raising awareness about food waste behavior. Individuals within households should adjust their habits to reduce the amount of leftover food released into the environment through planning, shopping, storing, cooking, eating, managing leftovers, redistribution, and assessing edibility.
The results of this study prompt practitioners to pay more attention to educating and raising awareness among the population about the detrimental effects of food waste, including the waste of resources and the costs associated with handling surplus food. Practitioners should implement doorstep campaigns to help households learn how to store surplus food, assess its usability, and redistribute it to reduce food waste. Additionally, practitioners need to provide education about the social and environmental consequences of food waste, thereby enhancing people's awareness of the negative impacts of food waste on society and the environment.
5.3 Limitations and future research directions
This study has some limitations. First, it uses a cross-sectional survey that may encounter endogeneity issues [33] and self-report bias [40]. To address these limitations, future studies could employ longitudinal surveys to assess the proposed research model. Secondly, the proposed model could be tested and validated using data from non-English-speaking countries and developing countries like Vietnam. Thirdly, the sampling method is convenient and non-probabilistic, thus limiting its representativeness. Finally, PLS-SEM does not use statistical indices such as chi-square, CFI, TLI, and RMSEA to assess the overall model fit. This leads to lower accuracy and reliability in evaluating the model, especially when using PLS-SEM for theory testing.
Future studies may utilize stratified sampling methods to enhance the sample's representativeness. Finally, this study only applies the Abilities component of the M-O-A theory to explore habits influencing food waste volume. Therefore, the following research should integrate the remaining components, such as Motivation and Opportunity, to investigate household food waste behavior.
This study conceptualized and tested the impact of behavioral factors on food waste. The findings suggest that planning, shopping, storing, cooking, eating, and assessing edibility are important predictors of food waste volume, with varying levels of influence. For instance, eating behavior is identified as the most significant predictor of food waste volume, followed by planning, shopping, storing, cooking, and assessing edibility. These findings make significant contributions to the growing literature on the drivers of food waste behavior at the household level in Vietnam.
We extend our heartfelt thanks to the editors and reviewers of the IJSDP for their valuable comments, which have significantly improved the quality of our article. We would also like to sincerely thank the University of Economics Ho Chi Minh City and the Industrial University of Ho Chi Minh City for their financial support.
Survey measurements and their sources
Habits [18]
On a 1 to 5 scale (1 = strongly disagree, 7 = strongly agree), please indicate whether you agree/disagree with the following statement.
Planning [8]
1. Plan meals before grocery shopping;
2. Create a shopping list before grocery shopping;
3. Inventory checking before grocery shopping;
4. Communicate with household members about your grocery list before going shopping.
Shopping [8]
1. Often grocery shopping;
2. Place for food shopping;
3. Previous food left-over influencing purchasing decisions for the following day;
4. Promotion influences grocery purchasing decisions;
5. Preparation and cooking time influence grocery purchasing decisions.
Storage [8]
1. Organize food items in refrigerator, freezer, pantry, or cabinets;
2. Check the expiration dates or freshness of food items;
3. Change their location in the refrigerator, freezer, or dry cabinet according to usage priority;
4. Temperature of a refrigerator to increase the self-life of food;
5. Check the fridge's temperature.
Cooking [8]
1. Time to cook at home;
2. Estimate food volume to prepare or serve for each family member or/and for the whole family when eating at home;
3. Leftover food at home when they are served in the following ways.
Eating [8]
1. Served in family-style platters where everyone can share;
2. Served in individual portions, everyone has their own plate and portion sizes;
3. Consume convenience food, e.g., ready-made meals or/take out orders;
4. Eat/dine outside;
5. Satisfaction with portion sizes when eating/dining in and out;
6. Reasons for having leftover food from your meals;
Left-over [8]
1. Reasons for having leftover food from your meals;
2. Bring home the leftovers meal when eating outside;
3. Eat leftover food;
4. Reason of eating leftover food;
5. Main drawbacks of eating leftover food.
Edibility [8]
1. Read the food label before purchasing/ consuming;
2. Methods to assess food labels, e.g., expiration date, best before date, etc.;
3. Methods to assess by advice from food experts, e.g., nutritionists, chefs, doctors, etc.;
4. Methods to assess by Personal experience and/or intuition…;
5. Methods to assess by food color, texture, and taste;
6. Methods to assess by social influence, e.g., family, friends, peers, etc.;
7. Meaning of food labels (Used by date; Best before date; Expiry date);
8. Throw away the food products that have passed their food label "best before date";
9. Point of view on the current format and wording of the food label.
Redistribution/Disposal [8]
1. What do you do with your non-edibility leftovers;
2. Store them in the fridge or freezer for later use;
3. Reheat them and eat them as another meal or snack;
4. Reuse them into new dishes or recipes;
5. Compost them or feed them to livestock animals;
6. Throw them away.
Food waste volume [3]
Volume of food waste thrown away in a day from family: Food waste/capita/day.
[1] Gustavsson, J., Cederberg, C., Sonesson, U., Van Otterdijk, R., Meybeck, A. (2011). Global food losses and food waste- Extent, causes and prevention. Rome.
[2] Scialabba, N., Jan, O., Tostivint, C., et al. (2013). Food Wastage Footprint: Impacts on Natural Resources. Summary Report. Food and Agriculture Organization of the United Nations.
[3] UNEP. (2021). Food waste index report.
[4] Thanh, N.P., Matsui, Y., Fujiwara, T. (2010). Household solid waste generation and characteristic in a Mekong Delta city, Vietnam. Journal of Environmental Management, 91(11): 2307-2321. https://doi.org/10.1016/j.jenvman.2010.06.016
[5] Vetter-Gindele, J., Braun, A., Warth, G., Bui, T.T.Q., Bachofer, F., Eltrop, L. (2019). Assessment of household solid waste generation and composition by building type in Da Nang, Vietnam. Resources, 8(4): 171. https://doi.org/10.3390/resources8040171
[6] Ho Nguyen Thao. (2022). Food waste hinders sustainable development. https://english.thesaigontimes.vn/food-waste-hinders-sustainable-development/.
[7] Vittuari, M., Herrero, L.G., Masotti, M., Iori, E., Caldeira, C., Qian, Z., Bruns, H., van Herpen, E., Obersteiner, G., Kaptan, G., Liu, G., Mikkelsen, B.E., Swannell, R., Kasza, G., Nohlen, H., Sala, S. (2023). How to reduce consumer food waste at household level: A literature review on drivers and levers for behavioural change. Sustainable Production and Consumption, 38: 104-114. https://doi.org/10.1016/j.spc.2023.03.023
[8] Schanes, K., Dobernig, K., Gözet, B. (2018). Food waste matters-A systematic review of household food waste practices and their policy implications. Journal of Cleaner Production, 182: 978-991. https://doi.org/10.1016/j.jclepro.2018.02.030
[9] Principato, L., Mattia, G., Di Leo, A., Pratesi, C.A. (2021). The household wasteful behaviour framework: A systematic review of consumer food waste. Industrial Marketing Management, 93: 641-649. https://doi.org/10.1016/j.indmarman.2020.07.010
[10] Mishra, M., Chauhan, S., Velramar, B., Soni, R.K., Pamidimarri, S.D.V.N. (2021). Facile bioconversion of vegetable food waste into valuable organic acids and green fuels using synthetic microbial consortium. Korean Journal of Chemical Engineering, 38: 833-842. https://doi.org/10.1007/s11814-020-0735-7
[11] Thi, N.B.D., Tuan, N.T., Thi, N.H.H. (2018). Assessment of food waste management in Ho Chi Minh City, Vietnam: current status and perspective. International Journal of Environment and Waste Management, 22(1-4): 111-123. https://doi.org/10.1504/IJEWM.2018.094100
[12] Nguyen, X.C., Tran, T.P.Q., Nguyen, T.T.H., La, D.D., Nguyen, V.K., Nguyen, T.P., Nguyen, X.H., Chang, S.W., Balasubramani, R., Chung, W.J., Nguyen, D.D. (2020). Call for planning policy and biotechnology solutions for food waste management and valorization in Vietnam. Biotechnology Reports, 28: e00529. https://doi.org/10.1016/j.btre.2020.e00529
[13] Pham, N.B., Do, T.N., Tran, V.Q., Trinh, A.D., Liu, C., Mao, C. (2021). Food waste in Da Nang city of Vietnam: Trends, challenges, and perspectives toward sustainable resource use. Sustainability, 13(13): 7368. https://doi.org/10.3390/su13137368
[14] Diana, R., Martianto, D., Baliwati, Y. F., Sukandar, D., Hendriadi, A. (2023). Determinants of household food waste in southeast Asia: A systematic review. Journal of Hunger & Environmental Nutrition, 1-12. https://doi.org/10.1080/19320248.2023.2174060
[15] Tuu, H.H. (2023). The role of impulsiveness and habit strength in reducing food waste. Journal of Asian Business and Economic Studies, 30(4): 257-269. https://doi.org/10.1108/JABES-03-2022-0053
[16] Stancu, V., Haugaard, P., Lähteenmäki, L. (2016). Determinants of consumer food waste behaviour: Two routes to food waste. Appetite, 96: 7-17. https://doi.org/10.1016/j.appet.2015.08.025
[17] Barnhill, A., Civita, N. (2020). Food waste: Ethical imperatives & complexities. Physiology & Behavior, 223: 112927. https://doi.org/10.1016/j.physbeh.2020.112927
[18] Ölander, F., Thøgersen, J. (1995). Understanding of consumer behaviour as a prerequisite for environmental protection. Journal of Consumer Policy, 18: 345-385. https://doi.org/10.1007/bf01024160
[19] Abeliotis, K., Lasaridi, K., Chroni, C. (2014). Attitudes and behaviour of Greek households regarding food waste prevention. Waste Management & Research, 32(3): 237-240. https://doi.org/10.1177/0734242X14521681
[20] Farr-Wharton, G., Foth, M., Choi, J.H.J. (2014). Identifying factors that promote consumer behaviours causing expired domestic food waste. Journal of Consumer Behaviour, 13(6): 393-402. https://doi.org/10.1002/cb.1488
[21] Radzymińska, M., Jakubowska, D., Staniewska, K. (2016). Consumer attitude and behaviour towards food waste. Journal of Agribusiness and Rural Development, 39(1): 175-181. https://doi.org/10.17306/JARD.2016.20
[22] Graham-Rowe, E., Jessop, D.C., Sparks, P. (2014). Identifying motivations and barriers to minimising household food waste. Resources, Conservation and Recycling, 84: 15-23. https://doi.org/10.1016/j.resconrec.2013.12.005
[23] Evans, D. (2015). Blaming the consumer–once again: the social and material contexts of everyday food waste practices in some English households. In Food and Public Health, pp. 62-73.
[24] Mallinson, L.J., Russell, J.M., Barker, M.E. (2016). Attitudes and behaviour towards convenience food and food waste in the United Kingdom. Appetite, 103: 17-28. https://doi.org/10.1016/j.appet.2016.03.017
[25] Parizeau, K., Von Massow, M., Martin, R. (2015). Household-level dynamics of food waste production and related beliefs, attitudes, and behaviours in Guelph, Ontario. Waste Management, 35: 207-217. https://doi.org/10.1016/j.wasman.2014.09.019
[26] Cappellini, B., Parsons, E. (2012). Practising thrift at dinnertime: Mealtime leftovers, sacrifice and family membership. The Sociological Review, 60(2_suppl): 121-134. https://doi.org/10.1111/1467-954X.12041
[27] Neff, R.A., Spiker, M.L., Truant, P.L. (2015). Wasted food: US consumers' reported awareness, attitudes, and behaviors. PloS One, 10(6): e0127881. https://doi.org/10.1371/journal.pone.0127881
[28] Hair, J., Hult, G.T.M., Ringle, C.M., Sarstedt, M. (2017). A Primer on Partial Least Squares Structural Equation Modeling (PLS-SEM). SAGE Publications, Inc.
[29] Cohen, J. (2013). Statistical power analysis for the behavioral sciences. Routledge.
[30] Stone, M. (1974). Cross-validatory choice and assessment of statistical predictions. Journal of the Royal Statistical Society: Series B (Methodological), 36(2): 111-133. https://doi.org/10.1111/j.2517-6161.1974.tb00994.x
[31] Henseler, J., Ringle, C.M., Sarstedt, M. (2015). A new criterion for assessing discriminant validity in variance-based structural equation modeling. Journal of the academy of marketing science, 43: 115-135. https://doi.org/10.1007/s11747-014-0403-8
[32] Fornell, C., Larcker, D.F. (1981). Evaluating structural equation models with unobservable variables and measurement error. Journal of Marketing Research, 18(1): 39-50. https://doi.org/10.1177/002224378101800104
[33] Guide Jr, V.D.R., Ketokivi, M. (2015). Notes from the Editors: Redefining some methodological criteria for the journal⋆. Journal of Operations Management, 37(1): v-viii. https://doi.org/10.1016/S0272-6963(15)00056-X
[34] Kock, N. (2015). Common method bias in PLS-SEM: A full collinearity assessment approach. International Journal of E-Collaboration (IJEC), 11(4): 1-10. https://doi.org/10.4018/ijec.2015100101
[35] Kock, N. (2021). WarpPLS 7.0 User Manual.
[36] Henseler, J., Ringle, C.M., Sarstedt, M. (2016). Testing measurement invariance of composites using partial least squares. International Marketing Review, 33(3): 405-431. https://doi.org/10.1108/IMR-09-2014-0304
[37] Hu, L.T., Bentler, P.M. (1998). Fit indices in covariance structure modeling: Sensitivity to under parameterized model misspecification. Psychological Methods, 3(4): 424-453. https://psycnet.apa.org/doi/10.1037/1082-989X.3.4.424.
[38] Secondi, L., Principato, L., Laureti, T. (2015). Household food waste behaviour in EU-27 countries: A multilevel analysis. Food Policy, 56: 25-40. https://doi.org/10.1016/j.foodpol.2015.07.007
[39] Principato, L., Secondi, L., Pratesi, C.A. (2015). Reducing food waste: an investigation on the behaviour of Italian youths. British Food Journal, 117(2): 731-748. https://doi.org/10.1108/BFJ-10-2013-0314
[40] Akter, S., Gunasekaran, A., Wamba, S.F., Babu, M.M., Hani, U. (2020). Reshaping competitive advantages with analytics capabilities in service systems. Technological Forecasting and Social Change, 159: 120180. https://doi.org/10.1016/j.techfore.2020.120180