Manindra Pratap Singh*![]() | Bangar Raju Totakura
| Bangar Raju Totakura![]()
© 2024 The authors. This article is published by IIETA and is licensed under the CC BY 4.0 license (http://creativecommons.org/licenses/by/4.0/).
OPEN ACCESS
Container vessel accidents risk maritime safety and the environment, and understanding their causes and consequences is vital to developing effective preventive measures. This study analyzes the distribution of latent factors and active events related to container vessel accidents by applying the Human Factors Analysis and Classification System (HFACS) derived NASAFACS framework. The study employs a varied dataset comprising different types of container vessel accidents that occurred worldwide from 2010 to 2021. Findings suggest that latent factors, i.e., 'Preconditions,' are the predominant causative agents behind container vessel accidents, followed by 'Acts,' which involve active events leading to them. Damage to vessels is usually the most common outcome, and container loss and environmental pollution are sizeable. Collision incidents frequently involve both latent factors and active errors, while fire incidents typically are solely driven by latent ones; other accident types, including heavy weather damage, grounding, and allision incidents, show evidence of both latent and active factors; heavy weather damage incidents tend to exhibit higher incidences of environmental pollution than other accident types. This research offers unique insight into container vessel accidents, underlining the need for enhanced securing practices, accurate cargo declaration, and stricter cargo stowage compliance to improve safety and reduce pollution.
maritime safety, container vessel accidents, NASAHFACS, human error, latent factors, active events, accident consequences, environmental pollution
First introduced in the 60s, containerization has transformed international shipping and the global trade significantly. Before the advent of the container vessels, goods were shipped in unpacked boxes and other makeshift arrangements. These traditional ways often resulted in damages and wastages during the loading and the unloading processes. Besides, was also subject to pilferage, as the whole process was carried out manually. With the advent of the container vessels, it is now possible to move goods seamlessly within plants, roads, rails or oceans. Containers are loaded and sealed at the origin and need only be checked by the receiver at the destination, thus making this mode of transportation efficient and more secured.
Modern container liner services can be said to operate like timetabled train or bus service, plying on established routes and covering major ports around the world. These ships symbolize intricate supply chains, whether they transport patio furniture from Thailand to Milan or avocados from Chile to Berlin. As per the World Shipping Council, container ships transport more than half of the global sea trade value, which is a testimony to the effectiveness of this method.
Several pivotal factors drive the growth and dominance of container shipping in the global trade.
Larger vessel size: Economies of scale have led to mega-ships that reduce the transportation costs per container.
Efficiency and technology: Automation and digital advancements have streamlined operations.
Global manufacturing networks: Global sourcing and assembly boost demand for container shipping.
E-commerce growth: Increasing consumer demand necessitates efficient global transportation.
Emerging markets: Opening new trade opportunities increases global trade volume.
Specialization and JIT inventory: Reduces excess storage needs.
Trade agreements: Reduced tariffs foster global trade.
Intermodal transportation: Containers can be moved on different modes of transport i.e., ships, trains, trucks etc.
Infrastructure development: Modern ports and logistics infrastructure support fast turnaround of vessels.
However, global container trade networks remain vulnerable. One striking reminder was the grounding of the Ever Given in March 2021 in the Suez Canal, a critical maritime route that participates in approximately 12 percent of global trade. When blocked, this brought home just how vulnerable global supply chains genuinely are. The Ever Given grounding proved that even seemingly isolated incidents could have wide-reaching repercussions for global cargo transportation networks. Shipping delays, inventory shortages, and economic disruption were all experienced as a result of this grounding incident.
Container shipping constitutes a significant portion of global trade and experiences continuous annual growth. It is anticipated to witness even more rapid expansion in the future. Container ships play a vital role in facilitating global supply chains. However, accidents involving container vessels have become a growing concern worldwide due to the substantial financial losses and disruptions they cause.
Table 1 provides an overview of the various types of accidents in which container vessels may be involved.
Table 1. Description of various types of maritime accidents
|
Accident Type |
Description |
|
Allision |
Striking of a ship against a stationary object. |
|
Collision |
Physical contact and impact between ships. |
|
Fire |
Fire onboard with exposure to cargo, vessel, personnel or all. |
|
Foundering |
Sinking of a ship. |
|
Grounding |
The vessel touches the seabed because of the lack of water depth. |
|
Heavy Weather Damage |
Damage caused to a ship or cargo owing to exposure to heavy weather in the passage. |
The shipping industry has taken various steps to improve safety, with the International Maritime Organization (IMO) adopting stringent regulations. Still, marine accidents do occur, highlighting gaps in the existing safety measures. As container vessels play an integral part in world trade and supply chain systems, any accidents involving these ships have the potential to impact global supply chains. It is essential to understand the causes of these accidents and adopt measures for prevention.
This study investigates the roles of human and organizational factors in container vessel incidents, aiming to uncover their root causes and assess current preventive measures. It delves into several key areas: the Literature Review section examines methodologies for analyzing maritime accident investigation reports; the Methodology section comprehensively describes the approaches employed in this study; the Analysis and Discussion section analyzes and discusses the research findings; the Conclusion section presents the overall findings and implications of the study; finally, the Gaps section identifies shortcomings within the study and outlines prospects for future research.
This section explores the study encompassing the analysis of maritime accidents and the varied methodologies used since 2009.
Shipping accidents remain a primary global concern despite technological developments and safety legislation. This has emphasised the need for consistent and coherent accident investigation reports that aid isolating the most critical contributors to these events. Celik and Cebi [1] came up with an advanced version of HFACS while combining it with the Fuzzy Analytical Hierarchy Process (FAHP) to effectively assess the human error and its role in the marine accidents. This integration augments decision-making and offers a robust analytical basis for quantitatively assessing maritime events.
Celik et al. [2] suggested a risk-based model to expand shipping accident investigations (SAI). The combined the new risk framework with the Fuzzy extended Fault tree Analysis (FFTA), to tackle organizational restraints and technical failures. Their approach aids understanding and gives insight in to the various causes including operational errors and technical failures, leading to marine accidents. It stresses on the benefits of using SAI reports as a means to formulate risk mitigation strategy to address risks in marine operations. The study also looks at combining FTA with SAI with an objective to standardize data and boost maritime accident investigation and prevention process.
Schröder-Hinrichs et al. [3] used the HFACS to examine forty-one maritime accident reports related to fires and explosions in machinery spaces. Their study discovered that these investigations mainly zeroed upon the technical issues leading to the accidents but often disregarded the organizational factors. This finding brings forward and underlines a significant gap between existing investigation methods and their reports.
Salmon et al. [4] compared three modern accident analysis methods, Accimap, HFACS, and STAMP, using case studies. Accimap and STAMP offered a broader view of contributory factors, whereas HFACS stood out for its reliability and recognized taxonomy. Nonetheless, the HFACS having been designed for the aviation, encountered challenges in classifying every failure, outside the aviation sector, due to the non-availability of specific taxonomies for other fields and broader organizational levels. The study suggests improving the Accimap model's utility for future investigations and accident analyses by including flexible taxonomies at all examination levels.
Chen et al. [5] developed the Human Factors Analysis and Classification System for Maritime Accidents (HFACS-MA) to analyze human and organizational factors in marine events. This five-tiered structure integrates critical concepts from the HFACS, Reason's Swiss Cheese Model, and Hawkins' SHEL model and aligns with IMO regulations. The HFACS-MA is further enriched by combining it with a Why-Because Graph, thereby allowing an additional approach to incentivize the benefits of the HFACS framework.
Akyuz and Celik [6] proposed a marine accident analysis and prevention model called HFACS–CM. The model combines the HFACS with the Cognitive Map (CM) technique to analyze the role of the human factor in marine accidents. The model provides an effective solution for users to find the pertinent causes of marine accidents. Hence, the model can identify and prioritize an accident's active or latent reasons. The applicability of the model was verified using it on a serious marine incident involving a man overboard situation during a lifeboat drill.
Wu et al. [7] introduced an enhanced version of the Cognitive Reliability and Error Analysis Method (CREAM) using an evidential reasoning approach. This refined CREAM aims to precisely evaluate linguistic variables related to the standard performance metrics in maritime accidents. Additionally, the new model addresses the inadequacies of previous CREAM models by overcoming uncertainties owing to insufficient data.
The oil and gas sector has been marred with noteworthy disasters owing to operational and organizational mistakes. As been designed for aviation sector, HFACS can have its limitations when applied to other domains, and its constraints became apparent when applied to the oil and gas sector, especially regarding regulatory oversights and issues such as sabotage. To tide over these identified gaps specific to the oil and gas industry, Theophilus et al. [8] devised a customised version, HFACS-OGI, for the oil and gas industry, enhancing the utility of HFACS in oil and gas industry, for effective investigation.
Recognizing safety as an important focus in the marine industry, Akyuz [9] presented an exclusive hybrid model to analyze shipboard accidents. The model integrates the HFACS, offering a structured framework for assessing human errors, with the Analytical Network Process (ANP) method, which examines intercomponent correlations. The outcome of this integration is a reliable instrument for ascertaining the causal factors in marine accidents.
The HFACS and the accident causation "2-4" model (24Model) are two important accident investigation models in the industry. Fu et al. [10] conducted a theoretical and application comparison of the HFACS and 24Model on the criteria, namely theoretical foundation cause classification and analysis process. It concluded following the study that the 24Model is scientific and has a certain practicability. Safety and accident investigators can use the above conclusions to select the most appropriate model for scientific research and accident causation analysis.
Kim and Na [11] suggested a human factor study methodology to ascertain and classify the fundamental variables that contribute to human error, determine the chronological order of marine accidents, and devise safety measures to mitigate the likelihood of such incidents.
Kececi and Arslan [12] devised a specialized technique, the SHip Accident Root cause Evaluation (SHARE), designed specifically for maritime incidents, as they recognized the limitations associated with the root cause analysis methodologies available for the ship operations. The methodology is structured upon the Fuzzy SWOT AHP Method, has many features like usage of standardized terminology, allowing for data quantification, identification of responsible entities for action and help devising risk-mitigation plans. The method been validated through its application to actual maritime incidents.
Total-loss marine casualties represent grave maritime disasters, causing significant economic, human, and environmental losses. Chen et al. [13] investigated the critical factors behind global total-loss marine incidents using the fuzzy matter element method. Using this model, they also performed a trend analysis on the factors related to these casualties. Based on the fuzzy matter element theory and associated principles, this research presents a comprehensive study of existing measurement methods. The study analyzes global data from 2001 to 2015 in order to test the accuracy and efficiency of their models. The study can help the policy makers in devising strategies to prevent marine accidents in future.
Batalden and Sydnes [14] evaluated marine incidents using a tailored version of the HFACS initially formulated by them in the study [15]. They analyzed investigative reports from the UK's Marine Accident Investigation Branch from July 1, 2002, to July 1, 2010. The review examined 133 contributing factors in 22 serious marine incidents, and concluded that "Very Serious" mishaps was highly related to organisational structure and provided an insight into significant problems with both onboard planning and monitoring.
Uğurlu et al. [16] reviewed a total of seventy passenger ship collision and contact incidents from the years 1991 through to 2015, analysing these events with their customized Human Factor Analysis and Classification System for Passenger Vessel accidents (HFACS-PV). The modified system based on fundamental HFACS framework has added operating conditions. The modified framework identified three main areas of concerns being abuse of authority, breach of procedures and rule violations.
Zhang et al. [17] using the ship accident investigation reports, quantitatively analyzed the relationship between ship accidents impacts and contributing factors. The study took a two-phase approach, wherein the standardization of contributing factors from the accident reports was completed, followed by a statistical analysis of this standardized data using three methods i.e., the Kruskal-Wallis test, Cramer's V analysis, and Kendall's tau coefficient, to pinpoint the primary elements influencing ship accident outcomes.
Yildiz et al. [18] assessed the potentiality of the Human Factor Analysis and Classification System for Passenger Vessel collisions (HFACS-PV) to classify marine accidents. The study spanning 51 passenger vessel groundings incidents which occurred between 1991 and 2017 and were analyzed through HFACS-PV. The research showed that HFACS-PV version for passenger vessel accidents is suitable for analysis of allision, collision, grounding and sinking incidents. The framework in addition to providing comprehensive analysis of the above incidents, can be integrated with other tools to effect qualitative and quantitative analysis.
Sánchez-Beaskoetxea et al. [19] analyzed marine accident reports by the USA National Transportation Safety Board (NTSB) from June 1975 to September 2017 to determine the impact of crew and other parties (pilots, companies, etc.) on incident causation and to identify error types. The study reviews the outcome of application of international regulations related to seafarers. Results indicate that crew errors onboard cargo and passenger fleets were exceedingly rare, highlighting the value of international conventions such as STCW. Nevertheless, the fact that pilot waters have among the highest human error rates suggests improving coordination between the bridge team. The study also highlights high crew error rates in fishing vessels and tugs, pointing to the need for specific training to lower navigation errors in these vessels.
Safe and accident-free shipping is a crucial goal for the maritime industry. Analyzing past marine accidents to identify causes and implement corrective measures is crucial. Recognizing that human error accounts for 80–85% of marine accidents, Hasanspahić et al. [20] focused on human factors and examined 135 accident reports from the UK Marine Accident Investigation Branch (MAIB) database (2010-2019) using the Human Factor Analysis and Classification System for Maritime Accidents (HFACS-MA).
The research categorizes and summarizes potentially frequent causal factors and then applies multiple linear regression to correlate the degree of accident frequency with these causes. The study suggests that focusing on two critical human factors identified by the study can help reduce accident rates and thus collectively improve safety in shipping.
Maritime risk research often needs more data for precise prediction and analysis. Li et al. [21] addressed this gap by incorporating the latest maritime accident data (2017-2021) from the Global Integrated Shipping Information System (GISIS) and Lloyd's Register Fair Play (LRF) databases into a Bayesian network (BN) model. The assessment determines 23 critical risk influential factors (RIFs) in static and dynamic risk categories, of which some are prominent. The BN-based model not only provides robust risk prediction and scenario analysis but also facilitates the formulation of accident prevention strategies in the maritime domain.
Cao et al. [22] analyzed 491 literature sources from the Web of Science database, covering the period from 2000-2022, to study marine accidents. They used CiteSpace and VOS viewer for knowledge network mapping and cluster analysis to identify research hotspots and trends. The results demonstrate strong collaboration within and among journals, researchers, institutions, and countries. The study focuses on two main aspects: integrating current and emerging technologies and discussing critical factors and outcomes of accidents. Attention is particularly given to the human aspects of remote-controlled ships and reducing accidents in the Arctic. Techniques like deep data mining and machine learning are highlighted as essential for uncovering new factors. Additionally, the study provides a theoretical foundation for enhancing marine safety, assessing trends, and visualizing cooperative networks.
2.1 Gaps identified
Container vessels are crucial to the intricate global trade network, forming the backbone of modern international commerce. Several factors have driven the increased participation of these vessels in global trade, reshaping the dynamics of international commerce and supply chains. Consequently, container trade has adapted and evolved to meet the demands of the rapidly changing global economy. The literature review reveals gaps in the analysis of container vessel accidents, particularly the need for a targeted study to address sector-specific issues, which will help identify and analyze the various causal factors and develop associated mitigating and control measures.
This study employs a qualitative approach to examine accident investigation reports involving container vessels.
3.1 Data
For this study, accident investigation reports of container vessels were selected from repositories maintained by marine accident investigation authorities of various Flag States. The details of these reports are presented in Table 2.
Table 2. Details of the data sources
|
Details of Accident Investigation Authority |
Website |
|
Federal bureau of maritime casualty investigation, Germany |
https://www.bsu-bund.de |
|
Japan transport safety board |
https://www.mlit.go.jp/jtsb/shipmenu_en.html |
|
Marine accident investigation branch, United Kingdom |
https://www.gov.uk/government/organisations/marine-accident-investigation-branch/about |
|
The Bahamas maritime authority |
https://www.bahamasmaritime.com |
|
The Danish maritime accident investigation board |
https://dmaib.com |
|
The transport safety investigation bureau of Singapore |
https://www.mot.gov.sg/what-we-do/transport-investigations |
The investigation reports considered for the analysis met the following criteria:
- Accidents that have occurred from the year 2010.
- Vessel size exceeding 15000 GRT.
The rationale for the above criteria is as follows:
- The size of container vessels has grown manifold since 2010.
- A container vessel exceeding 15000 GRT ensures that the ship is big enough for analysis, as a small container vessel may not have a sizeable impact on the supply chain.
Container vessels with a GRT exceeding 15,000 are further classified into the following subcategories based on their container carrying capacity. The classification details can be found in Table 3.
Table 3. Classification of container vessels basis carrying capacity
|
Classification of Container Vessel |
Container Carrying Capacity |
|
Feedermax |
1001 - 3000 TEUs |
|
Panamax |
3001 - 4500 TEUs |
|
Suezmax |
4500 - 11000 TEUs |
|
Ultra Large Container Vessel (ULCS) |
Greater than 11001 TEUs |
Twenty-nine accident investigation reports met the above criteria for analysis. The summary of the incidents is included in the Appendix - Annexure 1.
3.2 Method
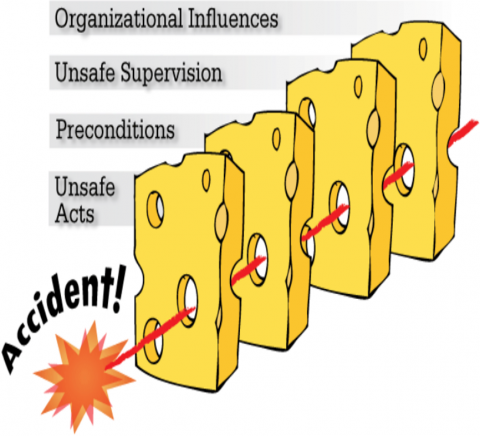
The study uses HFACS as the analysis framework. The HFACS was formulated by Shappell and Wiegmann [23] in 2000. The United States Air Force first developed a human error framework to examine and evaluate various human variables involved in flying. The HFACS is based on the theoretical framework known as the Swiss Cheese Model, initially proposed by James Reason, pictorially depicted in Figure 1. The HFACS framework facilitates investigation and effectively directs training and preventative initiatives. Researchers can methodically detect active and latent problems leading to accidents. The primary objective of the HFACS is not to assign culpability but rather to comprehend the fundamental causative elements that contribute to an accident.
Figure 1. An accident in making (Based Reason, 1990, as adapted by Shappell and Wiegmann [23])
This study uses NASAHFACS (read as NASAFACS) to analyze accident reports, as it is the latest and most advanced methodology within the HFACS arena. The study also helped check the suitability of NASAFACS for analyzing maritime accidents.
The NVivo programme (NVivo R14.23.0) serves as the coding platform in this investigation. NVivo is extensively used in scholarly research, policy analysis, and other domains, necessitating qualitative data analysis. This methodology offers a structured and methodical framework for analyzing qualitative data, assisting researchers in extracting significant findings from their study materials.
3.2.1 Description of active events and latent factors of NASAFACS
‘Active Events’
Acts are errors of commission / omission, or violations. These factors are often observed at the time of the mishap.
‘Latent Factors’
Preconditions are pre-existing environmental, individual, or personnel factors associated with the mishap.
Supervision includes guidance, training, feedback, oversight, modelling, discipline, selection, and other expectations associated with supervisory accountability and responsibility associated with the mishap.
Organizational include processes, policies, resources, and climate/culture that effect unsafe supervision, preconditions and/or acts associated with the mishap.
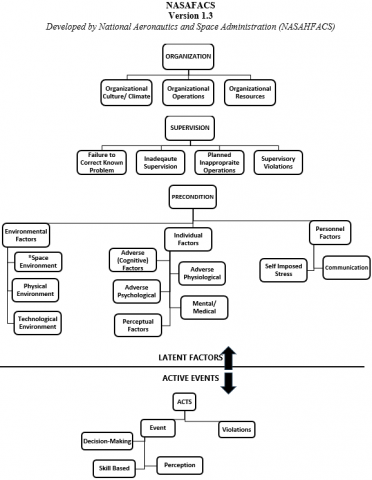
NSAFACS structure and the distribution of ‘Latent Factors’ and ‘Active Events’ is described pictorially in Figure 2.
Note: *Space Environment: Not applicable to marine accidents
Figure 2. NASAFACS structure
3.2.2 How to apply NASAHFACS
Ask: What Acts did the person or team do?
Was it an error? Skill, Decision or Perception?
(Made a decision error or pushed the wrong button, misinterpreted the gauge reading etc.)
Was it a violation, i.e. deliberate departure from established process?
(Violated Directives, Requirements or Procedures)
Determine the Preconditions:
What conditions existed before the person committed the unsafe act?
Was the physical or technological environment a factor?
(Bad weather, visibility restrictions from dust I smoke, blind spots, badlocation of switch / control etc.) Was it the Physical or Mental limitations of the person / Team?
(Personal life issues, complacency, trying too hard to complete the task, lack of sleep, illness, prescribed medications etc.)
Communications, planning or self-stressors play a factor?
(Nutrition, lack of proper rest PT, alcohol, poor communications, improper planning, poor situational awareness etc.)
Supervisor Issues:
Who knew about the preconditions but did not take steps to prevent the act?
(Did the Supervisor fail to provide proper guidance, training opportunity or act as a proper role model?)
Did the Supervisor improperly plan the operation and why?
Did the Supervisor fail to correct a known problem with the subordinate, provide training, or stop hazardous practices?
Did the Supervisor violate policy?
Organization Issues:
Are there organizational vulnerabilities that affected Supervisory practices and/or set the stage for unsafe preconditions or acts?
(Did policies, climate, Ops Tempo, inadequate risk assessments, processes or funding have a role?)
(‘NASAFACS Chart, Description & Application sourced from www.nasa.gov’)
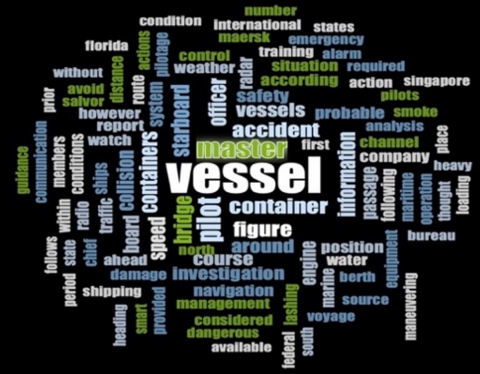
4.1 Word cloud for high frequency words in the reports
The word cloud (Figure 3) is generated from the coding and analysis of various accident investigation reports.
Figure 3. Word cloud
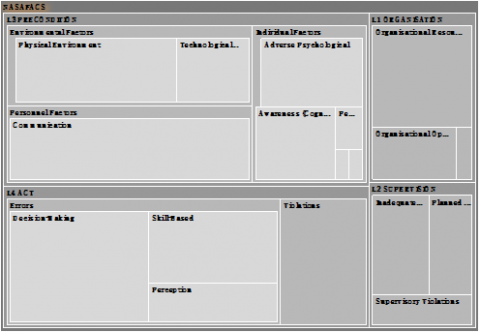
Figure 4. NASAFACS coded cases analysis
4.2 NASAFACS coded cases analysis
Figure 4 describes the files and the distribution of the codes assigned to them during analysis.
4.3 NASAFACS NVIVO output
After completing the coding of the causal factors as analyzed in the container vessel accident reports, hierarchy charts were generated to comprehensively understand the relationships and better understand the outcomes of the exercise. The codebook is appended in Annexure 2, providing details of the exercise. The various charts generated and their analyses are presented below:
4.3.1 NASAFACS analysis showing distribution of latent and active factors
The analysis of the distribution of latent factors and active events (Figure 5), based on the coding of investigation reports of container vessel accidents, highlights that 'L3 – Preconditions' have the highest share as the causative factor of all these accidents studied and investigated. This is followed by 'L4 – Acts,' then 'L1 - Organizational Factors,' with 'L2 – Supervision' being the least significant.
Figure 5. Distribution of latent factors and active events
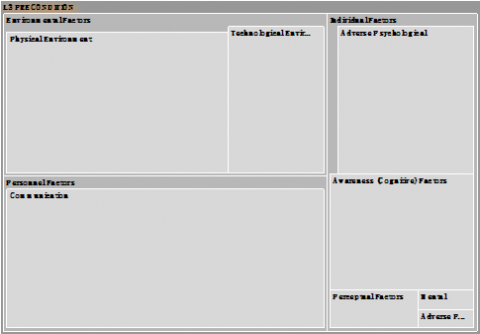
Environmental, Personnel and Individual Factors have a sizeable share within the Preconditions (Figure 6).
Figure 6. Distribution of ‘L3 – Preconditions’
Environmental Factors: The prominence of Environmental Factors within the Preconditions category suggests that external conditions and factors contribute significantly to the accidents. These might include weather conditions, visibility issues, and sea-state. Mitigating these factors may involve improved weather forecasting, better navigational aids, and stricter safety protocols during adverse conditions.
Personnel Factors: The fact that Personnel Factors also have a sizeable share within the Preconditions category highlights the importance of addressing communications, i.e., human-related aspects, and encompasses crew failure, task planning, risk assessment, inadequate crew coordination, lack of cross-checking, and rank intimidation. Improving personnel factors may involve training programs on resource management, task planning, risk assessment, and highlighting the importance of toolbox talk prior to the commencement of the task to ensure better crew engagement during the task.
Individual Factors: Adverse Psychological and Awareness (Cognitive) Factors make up for the Individual Factors, contributing to the role of Precondition as a significant cause of container vessel accidents. Individual Factors, though contribute on a lesser scale than Environmental and Personnel Factors.
Adverse Psychological conditions reflect the mental and emotional state of the individual, which can cause accidents. Promoting a supportive work environment and implementing mental and emotional health programs are crucial for mitigating Adverse Psychological Factors. Training programs can help individuals develop coping strategies for stress and adversity.
Awareness (Cognitive) Factors encompass and impact an individual’s mental processes and decision-making abilities. Awareness or cognitive factors are essential for maintaining situational awareness, making timely and practical assessments, and responding effectively to changing conditions. Creating an organizational culture that encourages openness and promotes the importance of cognitive skills is essential.
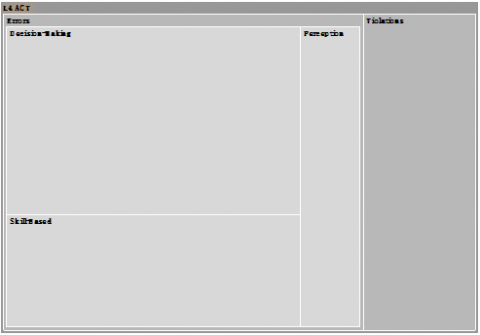
‘L4 – Acts’ stands next to the precondition as the causative element in the accidents (Figure 5). Acts are errors of commission/omission or violations, often observed during the mishap. Errors take a higher share in Acts than Violations. Decision-Making has the highest share within the Errors category, followed by Skill-Based and Perceptual Errors (Figure 7).
Figure 7. Distribution of ‘L4 – Acts’
Notably, Decision-Making Errors have the highest share in the Errors category, implying that decision making plays a crucial role in accidents and can include, but is not limited to, cognitive biases, situational factors, and the ability to adapt to changing conditions.
Skill-Based Errors refer to mistakes made by individuals, despite having the necessary skills, during routine or well-learned tasks. These errors can result from slips or lapses in attention, miss-out on following procedures, and inadvertent errors, even when individuals can perform the task correctly.
Perceptual Errors include misestimating distances, misreading instruments, or simply missing essential clues by individuals. They occur when people misunderstand the information in their environment and can sometimes be critical. For example, it is more important to have a high-precision perception in navigation or while monitoring equipment; and the error will be very relevant in these scenarios.
Organizations aiming to enhance safety performance and reduce Act related incidents must address decision-making errors, skill-based errors and perceptual errors. Equally important is the commitment to continuous improvement and learning from incidents, which is pivotal in preventing accidents.
Container vessel accident analysis has shown that the Violations, too, contribute to the Acts. When policies, guidelines, norms, or standards are breached intentionally, it is a violation. Such deviations can lead to dangerous situations or behaviors that increase the risk of accidents. Violations, by definition, are acts of intention, but a person may have reasons for the deviation and may make the situation complicated. Time constraints, insufficient resources available, and organizational culture can be reasons for a person deviating from the established norms. As a result, dealing with violations necessitates a multidimensional strategy that considers both human behavior and the organizational setting in which violations occur.
‘L1 Organization’ (Figure 5), too, plays a role in container vessel accidents albeit has a lesser share as causative compared to Preconditions and Acts. Organizational Resources are the most conspicuous as a causative, followed by Organizational Operations and, finally, Organizational Culture (Figure 8).
Figure 8. Distribution of ‘L1 – Organization’
Organizational Resources refer to the allocation and availability of resources necessary for safe operation, i.e., personnel, funds, materials/ spares, equipment, design, operational information, and infrastructure.
Organizational Operations encompass the processes, procedures, and practices that impact safety.
Organizational Culture/ Climate plays a pivotal role in shaping employee attitudes and behaviours related to safety.
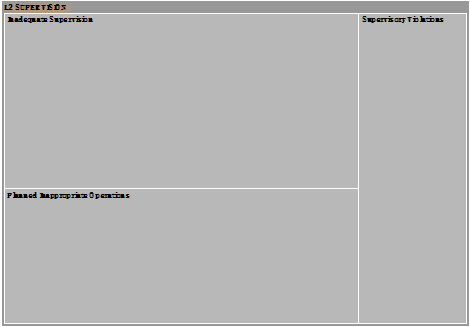
‘L2 Supervision’ (Figure 5), though an essential element, has been observed to play the minimum role as a causative in container vessel accidents. ‘Inadequate Supervision’ occupies the most prominent space, followed by Planned Inappropriate Operations and Supervisory Violations (Figure 9).
Inadequate Supervision refers to situations in which the supervision provided for vessel operations is insufficient or fails to meet the necessary standards.
Planned Inappropriate Operations suggest that certain operational decisions and actions were taken, but these actions did not align with safety standards or best practices.
Supervisory Violations reflect of supervisors involving themselves in violation of rules and regulations and are a cause for serious concern.
4.3.2 NASAFACS analysis showing distribution of consequences of the accidents analyzed
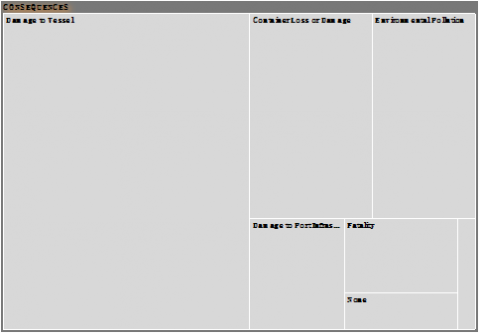
Analysis of the distribution of consequences of the accidents (Figure 10) highlights Damage to Vessel as the most frequently occurring and having the highest share, followed by Container Loss or Damage and, after that, Environmental Pollution,' as these three consequential elements take a significant share. Understanding the distribution of consequences is crucial for assessing the impact of container vessel accidents. It underscores the importance of prioritising safety, environmental protection, and effective risk management in the container vessel industry.
Figure 9. Distribution of ‘L2 – Supervision’
Figure 10. Distribution of accident consequences
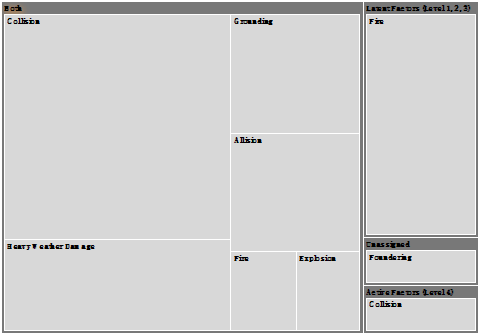
Figure 11. NASAFACS factors and type of accident
4.3.3 Relationship between the NASAFACS factors and type of accident
Figure 11 shows the relationship between the NASAFACS factors and the type of accident which contributes significantly to understanding the underlying factors contributing to accidents in the container vessel industry. it especially highlights the role of the latent factors and active events in various accident categories.
Fire: In the case of fire incidents on container vessels, latent factors are the primary causative factors rather than active events, often due to containerized cargo's unique nature and challenges. Several factors contribute to this scenario.
- Cargo composition: The composition of cargo within the containers can vary widely, and some goods may be prone to spontaneous combustion, especially if improperly packaged/ stored or stowed onboard. This latent risk may only be apparent once a fire breaks out.
- Stuffing and stowage: Container stuffing and stowage are typically done ashore, and vessel staff may have limited control over the process or knowledge about each container's specific contents. This lack of control and information can make it challenging to assess and mitigate the fire risk associated with the cargo.
- Misdeclaration: Misdeclarations or insufficient information about the contents and weight of the containers can further complicate matters. Without accurate information, it is difficult for vessel staff to assess compatibility and stowage requirements.
Addressing fire incidents in container vessels requires improved cargo inspection, verification, and declaration processes.
Collision: The analysis of the collision accident investigation reports, as reflected in the above chart, suggests a mix of active events (operator errors) and latent factors contributing to accidents. A combination of latent factors and active events causes a majority of collisions. In contrast, a small part is caused solely by active events, underscoring the complexity of navigation and collision avoidance at sea.
The other accident categories, namely Heavy Weather Damage, Grounding, Allision, Foundering, and Explosion have both active events and latent factors as causative elements.
The analysis above highlights the intricate interplay between latent factors and active events in accidents in the container vessel industry. Recognizing and addressing these factors is essential for enhancing safety and preventing accidents.
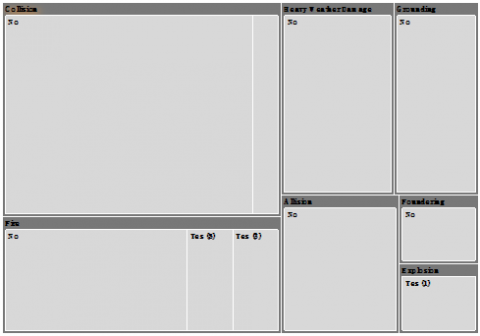
4.3.4 Relationship between type of accident and fatality
The relationship between Type of Accident and Fatality in container vessels is significant in understanding the safety implications of the various accent categories (Figure 12). Fire and Explosion accidents that result in fatalities highlight the severe risks and potential consequences of these incidents, and underscore the immediate life-threatening dangers posed by onboard fires and explosion accidents.
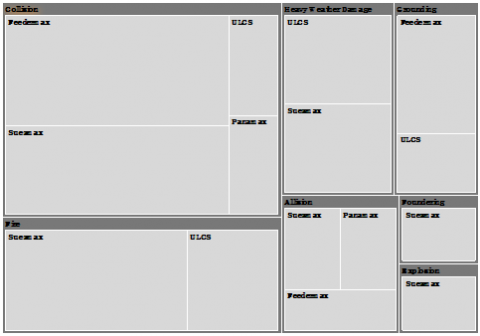
4.3.5 Relationship between type of accident and vessel size
Figure 13 explores if any relationship exists between the Type of Accident and Vessel Size. It is interesting to note that the Suezmax container vessel had the highest involvement across the accident categories, followed by the ULCS container vessels, highlighting the trend that larger container vessels are more prone to accidents. Feedermax vessel’s participation in Collision, Grounding, and Allision is likely due to these vessels trading near the coast, making frequent port calls, and having higher exposure to navigation hazards.
Figure 12. Type of accident and fatality
Figure 13. Type of accident and vessel size
4.4 Quantitative analysis of NASAFACS NVIVO output
The results from the coding and analysis conducted by NASAFACS were adapted for use in SPSS software to perform statistical analysis and detect any notable patterns. A cross-tabulation study was conducted to analyze the relationship between the variables, followed by a chi-square test to determine the presence of any association between them. The chi-square test, a statistical method used to assess the association or independence between two categorical variables, helps evaluate whether the observed data significantly deviates from the expected data. A comparative analysis of the two datasets can determine a meaningful link between the variables. In all tests of statistical significance, a p-value of less than 0.05 indicates a statistically significant relationship between the two factors. The various cross-tabulations performed are discussed as follows:
4.4.1 Incident type and fatality
Please refer to the case processing summary in Table 4, which details the Incident Type and Fatality cross-tabulation.
Table 4. Incident type and fatality cross-tabulation
|
Case Processing Summary |
|||||||||
|
|
Cases |
||||||||
|
Valid |
Missing |
Total |
|||||||
|
N |
Percent |
N |
Percent |
N |
Percent |
||||
|
Incident Type * Fatality |
29 |
100.0% |
0 |
0.0% |
29 |
100.0% |
|||
|
Incident Type * Fatality Cross-Tabulation |
|||||||||
|
Count |
|||||||||
|
|
Fatality |
Total |
|||||||
|
No |
Yes |
||||||||
|
Incident Type |
Grounding |
3 |
0 |
3 |
|||||
|
Explosion |
0 |
1 |
1 |
||||||
|
Collision |
10 |
1 |
11 |
||||||
|
Heavy Weather Damage |
4 |
0 |
4 |
||||||
|
Allision |
3 |
0 |
3 |
||||||
|
Foundering |
1 |
0 |
1 |
||||||
|
Fire |
4 |
2 |
6 |
||||||
|
Total |
25 |
4 |
29 |
||||||
|
Chi-Square Tests |
|||||||||
|
|
Value |
df |
Asymptotic Significance (2-sided) |
||||||
|
Pearson Chi-Square |
10.141a |
6 |
.119 |
||||||
|
Likelihood Ratio |
8.929 |
6 |
.178 |
||||||
|
Linear-by-Linear Association |
.368 |
1 |
.544 |
||||||
|
N of Valid Cases |
29 |
|
|
||||||
|
a. 12 cells (85.7%) have expected count less than 5. The minimum expected count is 0.14. |
|||||||||
Table 5. Incident type and NASAFACS cross-tabulation
|
Case Processing Summary |
|||||||||||
|
|
Cases |
||||||||||
|
Valid |
Missing |
Total |
|||||||||
|
N |
Percent |
N |
Percent |
N |
Percent |
||||||
|
Incident Type*NASAFACS |
29 |
100.0% |
0 |
0.0% |
29 |
100.0% |
|||||
|
Incident Type * NASAFACS Cross-Tabulation |
|||||||||||
|
Count |
|||||||||||
|
|
NASAFACS |
Total |
|||||||||
|
Active Errors |
Latent Factors |
Both |
Unassigned |
||||||||
|
Incident Type |
Grounding |
0 |
0 |
3 |
0 |
3 |
|||||
|
Explosion |
0 |
0 |
1 |
0 |
1 |
||||||
|
Collision |
1 |
0 |
10 |
0 |
11 |
||||||
|
Heavy Weather Damage |
0 |
0 |
4 |
0 |
4 |
||||||
|
Allision |
0 |
0 |
3 |
0 |
3 |
||||||
|
Foundering |
0 |
0 |
0 |
1 |
1 |
||||||
|
Fire |
0 |
5 |
1 |
0 |
6 |
||||||
|
Total |
1 |
5 |
22 |
1 |
29 |
||||||
|
Chi-Square Tests |
|||||||||||
|
|
Value |
df |
Asymptotic Significance (2-sided) |
||||||||
|
Pearson Chi-Square |
53.506a |
18 |
<.001 |
||||||||
|
Likelihood Ratio |
31.094 |
18 |
.028 |
||||||||
|
Linear-by-Linear Association |
3.355 |
1 |
.067 |
||||||||
|
N of Valid Cases |
29 |
|
|
||||||||
|
a. 27 cells (96.4%) have expected count less than 5. The minimum expected count is 0.03. |
|||||||||||
The above analysis, with a p-value of 0.119 being greater than 0.05, suggests no strong statistical evidence exists to conclude a significant relationship between the Incident Type and Fatality. When the p-value is greater than the chosen significance level (commonly set at 0.05 or 5%), it indicates that there is insufficient evidence to reject the null hypothesis, which in this case would be that there is not enough statistical evidence to claim that the type of accident is significantly related to fatalities in container vessel accidents.
Although the statistical analysis did not find a significant relationship, it is essential to remember that other factors not included in this analysis could still play a role in the occurrence of fatalities.
4.4.2 Incident type and NASAFACS
Please refer to the case processing summary in Table 5, which details the Incident Type and NASAFACS cross-tabulation.
The above analysis, with a p-value of less than 0.001, suggests that strong statistical evidence exists to conclude a significant relationship between Incident Type and NASAFACS analysis. This significant relationship indicates that the type of incident was associated with specific factors or causal elements identified in the NASAFACS analysis. In other words, particular types of incidents are more likely to be linked to particular factors, latent or active, or both, contributing to accidents.
In Collision incidents, the analysis revealed a predominant presence of latent factors and active errors as the causative elements, suggesting that Collision accidents often result from various factors, including navigational challenges, external conditions, and crew errors. In addition, a subset of Collision incidents is solely attributed to active errors, emphasising the role of human error in container vessel collision incidents. In the case of Fire incidents in container vessels, latent factors emerged as the primary causal elements. This highlights the unique and challenging nature of Fire incidents, often related to cargo composition, cargo stowage, and misdeclaration. The prevalence of latent factors suggests that fire incidents may not always result from immediate crew errors but may be linked to factors beyond the crew's control. Other accident categories, including Heavy Weather Damage, Grounding, Allision, Foundering, and Explosions, had both latent and active errors as causal factors. This pattern suggests that a mix of internal (active) and external (latent) factors contribute to accidents across various categories.
4.4.3 Incident type and vessel size
Please refer to the case processing summary in Table 6, which details the Incident Type and Vessel Size cross-tabulation.
Table 6. Incident type and vessel size cross-tabulation
|
Case Processing Summary |
||||||||||||
|
|
Cases |
|||||||||||
|
Valid |
Missing |
Total |
||||||||||
|
N |
Percent |
N |
Percent |
N |
Percent |
|||||||
|
Incident Type*Vessel Size |
29 |
100.0% |
0 |
0.0% |
29 |
100.0% |
||||||
|
Incident Type * Vessel Size Cross-Tabulation |
||||||||||||
|
Count |
||||||||||||
|
|
Size Vessel |
Total |
||||||||||
|
Feedermax |
Panamax |
Suezmax |
ULCS |
|||||||||
|
Incident Type |
Grounding |
2 |
0 |
0 |
1 |
3 |
||||||
|
Explosion |
0 |
0 |
1 |
0 |
1 |
|||||||
|
Collision |
5 |
1 |
4 |
1 |
11 |
|||||||
|
Heavy Weather Damage |
0 |
0 |
2 |
2 |
4 |
|||||||
|
Allision |
1 |
1 |
1 |
0 |
3 |
|||||||
|
Foundering |
0 |
0 |
1 |
0 |
1 |
|||||||
|
Fire |
0 |
0 |
4 |
2 |
6 |
|||||||
|
Total |
8 |
2 |
13 |
6 |
29 |
|||||||
|
Chi-Square Tests |
||||||||||||
|
|
Value |
df |
Asymptotic Significance (2-sided) |
|||||||||
|
Pearson Chi-Square |
18.167a |
18 |
.445 |
|||||||||
|
Likelihood Ratio |
21.907 |
18 |
.236 |
|||||||||
|
Linear-by-Linear Association |
3.506 |
1 |
.061 |
|||||||||
|
N of Valid Cases |
29 |
|
|
|||||||||
|
a. 28 cells (100.0%) have expected count less than 5. The minimum expected count is 0.07. |
||||||||||||
Table 7. Incident type and casualty type cross-tabulation
|
Case Processing Summary |
||||||||||||
|
|
Cases |
|||||||||||
|
Valid |
Missing |
Total |
||||||||||
|
N |
Percent |
N |
Percent |
N |
Percent |
|||||||
|
Incident Type*Casualty Type |
29 |
100.0% |
0 |
0.0% |
29 |
100.0% |
||||||
|
Incident Type * Casualty Type Cross-Tabulation |
||||||||||||
|
Count |
||||||||||||
|
|
Casualty Type |
Total |
||||||||||
|
Less Serious Marine Casualty |
Serious Marine Casualty |
Very Serious Marine Casualty |
||||||||||
|
Incident Type |
Grounding |
0 |
3 |
0 |
3 |
|||||||
|
Explosion |
0 |
0 |
1 |
1 |
||||||||
|
Collision |
0 |
8 |
3 |
11 |
||||||||
|
Heavy Weather Damage |
1 |
3 |
0 |
4 |
||||||||
|
Allision |
0 |
3 |
0 |
3 |
||||||||
|
Foundering |
0 |
0 |
1 |
1 |
||||||||
|
Fire |
0 |
5 |
1 |
6 |
||||||||
|
Total |
1 |
22 |
6 |
29 |
||||||||
|
Chi-Square Tests |
||||||||||||
|
|
Value |
df |
Asymptotic Significance (2-sided) |
|||||||||
|
Pearson Chi-Square |
16.714a |
12 |
.161 |
|||||||||
|
Likelihood Ratio |
15.000 |
12 |
.241 |
|||||||||
|
Linear-by-Linear Association |
.008 |
1 |
.928 |
|||||||||
|
N of Valid Cases |
29 |
|
|
|||||||||
|
a. 20 cells (95.2%) have expected count less than 5. The minimum expected count is 0.03. |
||||||||||||
The above analysis suggests that, as the p-value of 0.445 is greater than the common significance level of 0.05, there is insufficient statistical evidence to conclude a significant relationship between Incident Type and Vessel Size in the analyzed dataset.
While the analysis did not find a significant relationship in this dataset, it is essential to note that other factors that were not considered may influence the incident type and vessel size.
4.4.4 Incident type and casualty type
Please refer to the case processing summary in Table 7, which details of Incident Type and Casualty Type cross-tabulation.
The above analysis yielded a p-value of 0.16, exceeding the common significance threshold of 0.05. This indicates insufficient statistical evidence to establish a significant relationship between Incident Type and Casualty Type (Less Serious Marine Casualty, Serious Marine Casualty, and Very Serious Marine Casualty) in the dataset.
While the analysis did not find a significant relationship in this dataset, it is essential to note that other factors that were not considered may influence the incident types and types of casualties.
4.4.5 Incident type and operational state
Please refer to the case processing summary in Table 8, which details the Incident Type and Operational State cross-tabulation.
The analysis, with a p-value of 0.010. shows statistical evidence suggesting a significant relationship between the Incident Type and Operational State in the studied dataset. The significant relationship between the Incident Type and Operational State implies that the incident type is associated with the operational state of the vessel at the time of the incident. In other words, specific incidents are more likely to occur when the vessels are in specific operational states.
Looking at the tabular dataset, it is evident that there is a higher frequency of grounding incidents during the arrival port phase than during the departure from the port phase. The frequency of collision incidents is higher during the arrival port phase than during open-sea navigation, coastal navigation, and departure from the port. Although it is normal for the collision risk to be higher while operating in a port vicinity, i.e., when making port calls, the above finding highlights the criticality of arrival port operations concerning collision accidents in container vessels compared to departure port operations. Allision incidents were more frequent during the berthing phase than during unberthing. These observations underscore the possible hazards linked to vessels coming into contact with structures, other vessels, or port infrastructure while manoeuvring to berth.
These observations provide valuable insights into incident frequency patterns in different operational contexts. Recognising these patterns can guide safety practices and accident prevention efforts to enhance the safety of container vessel operations, particularly during the critical phases. The above analysis reiterates and re-establishes the criticality of the port approach and berthing operations compared to departure port and unberthing operations.
Table 8. Incident type and operational state cross-tabulation
|
Case Processing Summary |
|||||||||||||||
|
|
Cases |
||||||||||||||
|
Valid |
Missing |
Total |
|||||||||||||
|
N |
Percent |
N |
Percent |
N |
Percent |
||||||||||
|
Incident Type* Operational State |
29 |
100.0% |
0 |
0.0% |
29 |
100.0% |
|||||||||
|
Incident Type * Operational State Cross-Tabulation |
|||||||||||||||
|
Count |
|||||||||||||||
|
|
Operational_State |
|
|||||||||||||
|
Approaching Port |
Open Sea Navigation |
Coastal Navigation |
Berthing |
Unberthing |
Departure Port |
Total |
|||||||||
|
Incident Type |
Grounding |
2 |
0 |
0 |
0 |
0 |
1 |
3 |
|||||||
|
Explosion |
0 |
0 |
0 |
1 |
0 |
0 |
1 |
||||||||
|
Collision |
7 |
1 |
3 |
0 |
0 |
0 |
11 |
||||||||
|
Heavy Weather Damage |
0 |
3 |
1 |
0 |
0 |
0 |
4 |
||||||||
|
Allision |
0 |
0 |
0 |
2 |
1 |
0 |
3 |
||||||||
|
Foundering |
0 |
1 |
0 |
0 |
0 |
0 |
1 |
||||||||
|
Fire |
1 |
2 |
2 |
1 |
0 |
0 |
6 |
||||||||
|
Total |
10 |
7 |
6 |
4 |
1 |
1 |
29 |
||||||||
|
Chi-Square Tests |
|||||||||||||||
|
|
Value |
df |
Asymptotic Significance (2-sided) |
||||||||||||
|
Pearson Chi-Square |
50.714a |
30 |
.010 |
||||||||||||
|
Likelihood Ratio |
42.405 |
30 |
.066 |
||||||||||||
|
Linear-by-Linear Association |
.210 |
1 |
.647 |
||||||||||||
|
N of Valid Cases |
29 |
|
|
||||||||||||
|
|||||||||||||||
Table 9. Incident type and pollution cross-tabulation
|
Case Processing Summary |
|||||||||||||
|
|
Cases |
||||||||||||
|
Valid |
Missing |
Total |
|||||||||||
|
N |
Percent |
N |
Percent |
N |
Percent |
||||||||
|
Incident Type*Pollution |
29 |
100.0% |
0 |
0.0% |
29 |
100.0% |
|||||||
|
Incident_Type * Pollution Cross-Tabulation |
|||||||||||||
|
Count |
|||||||||||||
|
|
Pollution |
Total |
|||||||||||
|
Yes |
No |
||||||||||||
|
Incident Type |
Grounding |
0 |
3 |
3 |
|||||||||
|
Explosion |
0 |
1 |
1 |
||||||||||
|
Collision |
3 |
8 |
11 |
||||||||||
|
Heavy Weather Damage |
4 |
0 |
4 |
||||||||||
|
Allision |
0 |
3 |
3 |
||||||||||
|
Foundering |
1 |
0 |
1 |
||||||||||
|
Fire |
2 |
4 |
6 |
||||||||||
|
Total |
10 |
19 |
29 |
||||||||||
|
Chi-Square Tests |
|||||||||||||
|
|
Value |
df |
Asymptotic Significance (2-sided) |
||||||||||
|
Pearson Chi-Square |
13.441a |
6 |
.037 |
||||||||||
|
Likelihood Ratio |
16.834 |
6 |
.010 |
||||||||||
|
Linear-by-Linear Association |
1.209 |
1 |
.271 |
||||||||||
|
N of Valid Cases |
29 |
|
|
||||||||||
|
a. 13 cells (92.9%) have expected count less than 5. The minimum expected count is .34. |
|||||||||||||
4.4.6 Incident type and pollution
Please refer to the case processing summary in Table 9, which details of Incident Type and Pollution cross-tabulation.
The above analysis between the Incident Type and Pollution yielded a p-value of 0.037, less than the common significance level of 0.05, indicating a strong statistical significance between the two variables within the studied dataset.
Exposure of container vessels to heavy weather and subsequent damage frequently leads to loss of container overboard. These containers may contain various goods, including hazardous materials, chemicals, and pollutants. Loss of containers at sea can result in pollution risks owing to cargo spills. Container spills at sea can cause considerable damage to the marine environment. Cargo may contain elements harmful to marine life and ecosystems. The pollution caused by lost containers can impact coastal waters, marine ecosystems, and the general health of the marine environment. There are national and international rules, e.g., IMO guidelines on container securing to address these risks, but with lashings giving way in heavy weather and frequent container loss incidents, there is a need to revisit these requirements and make them suitable for the increasing size of the container vessels, to reduce such occurrences. Preventing container loss requires improved securing procedures and compliance with container stowage regulations. Enhancing vessel construction and stability for better response in severe weather conditions will help decrease these occurrences. Container tracking can help trace the containers and aid in recovery.
Table 10. Summary of the association between attributes and accidents
|
Associations |
P value |
Chi Square |
Significant/ Insignificant |
|
Incident Type and Fatality |
0.119 |
10.141a |
Insignificant |
|
Incident Type and NASAFACS |
< 0.001 |
53.506a |
Significant |
|
Incident Type and Vessel Size |
0.445 |
18.167a |
Insignificant |
|
Incident Type and Casualty |
0.161 |
16.714a |
Insignificant |
|
Incident Type and Operational State |
0.010 |
50.714a |
Significant |
|
Incident Type and Pollution |
0.037 |
20.137a |
Significant |
4.4.7 Summary of associations between different attributes of the container vessel accidents
Table 10 summarizes the association between the various attributes and variables studied during the analysis.
4.4.8 Suggestions based on above findings to improve maritime safety
Enhanced training programs: Training programs that enhance decision-making skills, situational awareness, and response to adverse conditions should be considered. Underscoring the importance of pre-task planning and risk assessment can assist in preventing accidents.
Improved safety and operational procedures: Developing and implementing robust safety protocols for various operational phases, especially during critical phases like port calls, heavy weather scenarios can reduce accident risks. Regular audits and reviews of these procedures can ensure their effectiveness.
Mental health and support programs: Promoting mental health programs and ensuring a supportive work environment onboard vessels can help mitigate adverse psychological factors contributing to accidents. Open communication and teamwork can aid in improving overall safety.
Policy and regulatory enhancements: Regulatory bodies should consider these findings to enhance maritime safety regulations. Policies focusing on improved securing arrangements, stricter measures to ensure cargo stuffing and stowage compliance, enhanced training standards, and stricter implementation of safe practices can significantly reduce accident incidences.
Technological advancements: Investing in advanced navigational aids, weather forecasting systems, and automated safety checks can help alleviate environmental and human error factors. Technology can play a crucial role in augmenting situational awareness and decision-making capabilities.
Organizational culture: Fostering a safety-centric organizational culture is essential. Leadership commitment to safety and continuous improvement initiatives can instill a heightened safety culture among crew members.
This study underscores the vital importance of container vessels in global trade and the pressing need for targeted research on container vessel accidents. Through a comprehensive analysis of container vessel accident reports applying the NASAFACS framework, this research has identified key aspects, both latent factors and active errors, that contribute to container vessel accidents.
The analysis of the distribution of latent factors and active events, based on the analysis of the investigation reports of container vessel accidents, highlights that ‘L3 – Preconditions’ have the highest share as being the causative factor of all these accidents studied and investigated. ‘L4 – Acts’ stand next to the Precondition as the causative element in accidents. Acts are errors of commission/omission or violations, often observed during the mishap. Analysis of the distribution of consequences of the accidents highlights Damage to Vessel as the most frequently occurring and having the highest share, followed by Container Loss or Damage and, after that, Environmental Pollution, as these three consequential elements take a significant share. The analysis also revealed that a combination of latent factors and active errors influences various incident types in container vessel accidents. Collision incidents often involve both latent factors and active error. However, they may sometimes have active errors solely responsible for collision incidents, emphasising the complexity of navigation and the role of human error. Fire incidents are predominantly driven by latent factors beyond the control of the vessel crew. Other categories of accidents, such as Heavy Weather Damage, Grounding, Allision, Foundering, and Explosion, exhibit latent and active causal factors. The incident frequencies varied across the different operational states and locations. The analysis identified a significant relationship between Heavy Weather Damage and a higher incidence of Environmental Pollution.
Improved securing practices taking in to account the size of the vessel & adverse weather conditions faced enroute will help tackle the loss of containers and subsequent environmental pollution. Stricter cargo stowage standards in terms stuffing of containers as required, declaration of contents and stowage onboard as mandated, can help address the safety challenges. Addressing these gaps will pave the way for safer and more efficient container vessel operations, thereby safeguarding the global supply chain and the broader economy.
Although the above study provides insights into container vessel accidents, it is essential to acknowledge its limitations. Every research effort has constraints that can affect the interpretation and generalization of the findings. The findings of this study may be specific to the dataset and may not fully represent the entire container vessel industry. Some aspects of incident classification, coding, and analysis may involve subjective judgments. Analysts may categorise incidents differently by introducing subjectivity into the results.
The study used NASAFACS to perform the HFACS analysis of container vessel accidents. NASAFACS has been designed and developed by NASA to analyze space accidents. Although it broadly serves the purpose of accident analysis, its adaption to maritime accident analysis will serve this purpose better in the future.
This study provides qualitative insights based on the analysis of container vessel accident investigations. Other qualitative perspectives, such as interviews or surveys of industry experts and crew members, would complement the analysis by offering deeper context and understanding.
Annexure 1 – Container Vessel Accident Information
|
Sr. No. |
Accident Information |
Year |
HFACS Category |
Incident Location |
Name of the Vessel |
Size of Container Vessel |
Accident Categorization |
|
01. |
Cases\\07~07~2010Charlotte Maersk Fire |
2010 |
Latent Factors (Level 1, 2, 3) |
At Sea |
Charlotte Maersk |
Suezmax |
Fire |
|
02. |
Cases\\15~05~2011Platon Allision |
2011 |
Both |
In Port |
CMA CGM Platon |
Feedermax |
Allision |
|
03. |
Cases\\11~12~2011ACX Hibiscus & Hyundai Discovery Collision |
2011 |
Both |
At Sea |
Hyundai Discovery |
Suezmax |
Collision |
|
04. |
Cases\\14~02~2014 Svendborg Maersk Heavy Weather Damage |
2012 |
Both |
At Sea |
Svendborg Maersk |
Suezmax |
Heavy Weather Damage |
|
05. |
Cases\\14~07~2012MSC Flamina Fire |
2012 |
Latent Factors (Level 1, 2, 3) |
At Sea |
MSC Flaminia |
Suezmax |
Fire |
|
06. |
Cases\\05~06~2012Spring Glory & Josephine Maersk Collision |
2012 |
Both |
At Sea |
Josephine Maersk |
Feedermax |
Collision |
|
07. |
Cases\\18~06~201 Eugen Maersk Fire |
2013 |
Latent Factors (Level 1, 2, 3) |
At Sea |
Eugene Maersk |
Suezmax |
Fire |
|
08. |
Cases\\10~07~2013MOL Comfort Sinking |
2013 |
Unassig-ned |
At Sea |
MOL Comfort |
Suezmax |
Foundering |
|
09. |
Cases\\19~03~2013CMA CGM Florida & Chou Shan Collision |
2013 |
Both |
At Sea |
CMA CGM Florida |
Suezmax |
Collision |
|
10. |
Cases\\11~02~2015Eversmart & Alexandra1 Collision |
2015 |
Both |
In Port |
Ever Smart |
Suezmax |
Collision |
|
11. |
Cases\\26~08~2015Caroline Maersk Fire In Containers |
2015 |
Latent Factors (Level 1, 2, 3) |
At Sea |
Carioline Maersk |
Suezmax |
Fire |
|
12. |
Cases\\07~06~2016Estelle Maersk & JJ Skya Collision |
2016 |
Both |
In Port |
Estelle Maersk |
ULCS |
Collision |
|
13. |
Cases\\22~08~2016CMA CGM Vasco De Gama Grounding |
2016 |
Both |
In Port |
CMA CGM Vasco De Gama |
ULCS |
Grounding |
|
14. |
Cases\\04~05~2017CMA CGM Centaurus Allison |
2017 |
Both |
In Port |
CMA CGM Centaurus |
Suezmax |
Allision |
|
15. |
Cases\\19~01~2017Manhattan Bridge Boiler Explosion |
2017 |
Both |
In Port |
Manhattan Bridge |
Suezmax |
Explosion |
|
16. |
Cases\\30~10~2017 EverSmart Heavy Weather Damage |
2017 |
Both |
At Sea |
Ever Smart |
Suezmax |
Heavy Weather Damage |
|
17. |
Cases\\10~02~2017Victoria Grounding |
2017 |
Both |
At Sea |
Victoria |
Feedermax |
Grounding |
|
18. |
Cases\\17~06~2017ACX Crystal & USS Fitzgerald Collision |
2017 |
Both |
At Sea |
ACX Crystal |
Feedermax |
Collision |
|
19. |
Cases\\17~08~2018OOCLNagoya Allision |
2018 |
Both |
In Port |
OOCL Nagoya |
Panamax |
Allision |
|
20. |
Cases\\06~03~2018Maesrk Honam Fire |
2018 |
Both |
At Sea |
Maersk Honam |
ULCS |
Fire |
|
21. |
Cases\\20~01~2018CMACGM G. Washington Heavy Weather Damage |
2018 |
Both |
At Sea |
CMA CGM G. Washington |
ULCS |
Heavy Weather Damage |
|
22. |
Cases\\04~08~2018ANL Wyong & King Arthur Coliision |
2018 |
Both |
At Sea |
ANL Wyong |
Panamax |
Collision |
|
23. |
Cases\\04~05~2018NYK Venus& SITC Osaka Collision |
2018 |
Both |
In Port |
NYK Venus |
Suezmax |
Collision |
|
24. |
Cases\\21~03~2019APL Guam, Marcliff & Hansa Steinberg Collision |
2019 |
Active Factors (Level 4) |
In Port |
APL Guam |
Feedermax |
Collision |
|
25. |
Cases\\24~10~2019SITC Bangkok Resurgence Collision |
2019 |
Both |
In Port |
SITC Bangkok |
Feedermax |
Collision |
|
26. |
Cases\\04~04~2019Wan Hai Grounding |
2019 |
Both |
In Port |
Wan Hai |
Feedermax |
Grounding |
|
27. |
Cases\\26~12~2020Maersk Elba Fire |
2020 |
Latent Factors (Level 1, 2, 3) |
At Sea |
Maersk Elba |
ULCS |
Fire |
|
28. |
Cases\\15~10~2020APL Pusan & Shoutokumaru Collision |
2020 |
Both |
In Port |
APL Pusan |
Feedermax |
Collision |
|
29. |
Cases\\16~02~2021 Maersk Essen Heavy Weather Damage |
2021 |
Both |
At Sea |
Maersk Essen |
ULCS |
Heavy Weather Damage |
|
Sr. No. |
Investigating Authority |
Fatality |
Injury |
Pollution |
Operational State |
Pilot Onboard |
Marine Casualty Information |
|
01. |
DMAIB |
No |
No |
No |
Coastal Navigation |
NA |
Serious Marine Casualty |
|
02. |
UKMAIB |
No |
No |
No |
Unberthing |
Yes |
Serious Marine Casualty |
|
03. |
UKMAIB |
No |
No |
Yes |
Coastal Navigation |
NA |
Very Serious Marine Casualty |
|
04. |
DMAIB |
No |
Minor |
Yes |
Coastal Navigation |
NA |
Serious Marine Casualty |
|
05. |
FBMCI |
Yes (3) |
Yes (2) |
Yes |
Open Sea Navigation |
NA |
Very Serious Marine Casualty |
|
06. |
DMAIB |
No |
No |
Yes |
Coastal Navigation |
NA |
Serious Marine Casualty |
|
07. |
DMAIB |
No |
No |
No |
Coastal Navigation |
NA |
Serious Marine Casualty |
|
08. |
TBMA |
No |
Minor |
Yes |
Open Sea Navigation |
NA |
Very Serious Marine Casualty |
|
09. |
UKMAIB |
No |
No |
Yes |
Open Sea Navigation |
NA |
Serious Marine Casualty |
|
10. |
UKMAIB |
No |
No |
No |
Approaching Port |
Yes |
Very Serious Marine Casualty |
|
11. |
DMAIB |
No |
No |
No |
Coastal Navigation |
NA |
Serious Marine Casualty |
|
12. |
JTSB |
No |
No |
No |
Approaching Port |
Yes |
Unassigned |
|
13. |
UKMAIB |
No |
No |
No |
Approaching Port |
Yes |
Serious Marine Casualty |
|
14. |
UKMAIB |
No |
Yes (10) |
No |
Berthing |
Yes |
Serious Marine Casualty |
|
15. |
JTSB |
Yes (1) |
Yes (1) |
No |
Berthing |
Yes |
Very Serious Marine Casualty |
|
16. |
UKMAIB |
No |
No |
Yes |
Open Sea Navigation |
NA |
Less Serious Marine Casualty |
|
17. |
DMAIB |
No |
No |
No |
Approaching Port |
No |
Serious Marine Casualty |
|
18. |
JTSB |
Yes (7) |
Yes (3) |
No |
Coastal Navigation |
NA |
Very Serious Marine Casualty |
|
19. |
JTSB |
No |
No |
No |
Berthing |
Yes |
Unassigned |
|
20. |
TSIB |
Yes (5) |
Yes (22) |
Yes |
Open Sea Navigation |
NA |
Serious Marine Casualty |
|
21. |
UKMAIB |
No |
No |
Yes |
Open Sea Navigation |
NA |
Serious Marine Casualty |
|
22. |
UKMAIB |
No |
No |
No |
Approaching Port |
No |
Serious Marine Casualty |
|
23. |
JTSB |
No |
No |
No |
Approaching Port |
Yes |
Unassigned |
|
24. |
JTSB |
No |
No |
No |
Approaching Port |
Yes |
Unassigned |
|
25. |
JTSB |
No |
No |
No |
Approaching Port |
Yes |
Unassigned |
|
26. |
JTSB |
No |
No |
No |
Departure from Port |
Yes |
Unassigned |
|
27. |
DMAIB |
No |
No |
No |
Coastal Navigation |
NA |
Serious Marine Casualty |
|
28. |
JTSB |
No |
No |
No |
Approaching Port |
Yes |
Unassigned |
|
29. |
DMAIB |
No |
No |
Yes |
Open Sea Navigation |
NA |
Serious Marine Casualty |
Annexure 2 - Code Book
NASAFACS analysis
|
Name |
File |
References |
|
NASAFACS |
28 |
289 |
|
L1 ORGANIZATION |
14 |
35 |
|
Organizational Culture/ Climate |
2 |
2 |
|
Organizational Operations |
6 |
10 |
|
Organizational Resources |
14 |
23 |
|
L2 SUPERVISION |
14 |
30 |
|
Failure to Correct Known Problem |
0 |
0 |
|
Inadequate Supervision |
9 |
13 |
|
Planned Inappropraite Operations |
6 |
10 |
|
Supervisory Violation |
4 |
7 |
|
L3 PRECONDITION |
27 |
123 |
|
Environmental Factors |
19 |
43 |
|
Physical Environment |
17 |
29 |
|
Technological Environment |
10 |
13 |
|
*Space Environment |
0 |
0 |
|
Individual Factors |
16 |
39 |
|
Adverse Physiological |
1 |
1 |
|
Adverse Psychological |
12 |
18 |
|
Awareness (Cognitive) Factors |
9 |
15 |
|
Mental |
1 |
1 |
|
Perceptual factors |
3 |
3 |
|
Personnel Factors |
16 |
41 |
|
Communication |
16 |
41 |
|
Self Imposed Stress |
0 |
0 |
|
L4 ACT |
22 |
101 |
|
Errors |
21 |
77 |
|
Decision-Making |
19 |
40 |
|
Perception |
9 |
13 |
|
Skill-Based |
15 |
24 |
|
Violations |
11 |
24 |
Note: *Space Environment: Not applicable to marine accidents
Consequence analysis
|
Name |
File |
References |
|
CONSEQUENCES |
29 |
71 |
|
Container loss or Damge |
12 |
12 |
|
Damage to Port Infrastructure |
3 |
6 |
|
Damage to Vessel |
27 |
37 |
|
Environmental Pollution |
10 |
10 |
|
Fatality |
4 |
4 |
|
Injury to Personnel |
6 |
6 |
|
None |
2 |
2 |
|
Total Loss of Vessel |
1 |
1 |
Investigating agency details
|
Name |
File |
References |
|
Investigating Agency |
29 |
29 |
|
Federal Bureau of Maritime Casualty Investigation |
1 |
1 |
|
Japan Transport Safety Board |
9 |
9 |
|
Marine Accident Investigation Branch, UK |
9 |
9 |
|
The Bahamas Maritime Authority |
1 |
1 |
|
The Danish Maritime Accident Investigation Board |
8 |
8 |
|
The Transport Safety Investigation Bureau of Singapore |
1 |
1 |
Incident details
|
Name |
File |
References |
|
Type of Incident |
29 |
29 |
|
Allision |
3 |
3 |
|
Collision |
11 |
11 |
|
Explosion |
2 |
2 |
|
Fire |
6 |
6 |
|
Flooding |
3 |
3 |
|
Foundering |
1 |
1 |
|
Grounding |
3 |
3 |
|
Heavy Weather Damage |
5 |
5 |
[1] Celik, M., Cebi, S. (2009). Analytical HFACS for investigating human errors in shipping accidents. Accident Analysis & Prevention, 41(1): 66-75. https://doi.org/10.1016/j.aap.2008.09.004
[2] Celik, M., Lavasani, S.M., Wang, J. (2010). A risk-based modelling approach to enhance shipping accident investigation. Safety Science, 48(1): 18-27. https://doi.org/10.1016/j.ssci.2009.04.007
[3] Schröder-Hinrichs, J.U., Baldauf, M., Ghirxi, K.T. (2011). Accident investigation reporting deficiencies related to organizational factors in machinery space fires and explosions. Accident Analysis & Prevention, 43(3): 1187-1196. https://doi.org/10.1016/j.aap.2010.12.033
[4] Salmon, P.M., Cornelissen, M., Trotter, M.J. (2012). Systems-based accident analysis methods: A comparison of Accimap, HFACS, and STAMP. Safety Science, 50(4): 1158-1170. https://doi.org/10.1016/j.ssci.2011.11.009
[5] Chen, S.T., Wall, A., Davies, P., Yang, Z., Wang, J., Chou, Y.H. (2013). A Human and Organisational Factors (HOFs) analysis method for marine casualties using HFACS-Maritime Accidents (HFACS-MA). Safety Science, 60: 105-114. https://doi.org/10.1016/j.ssci.2013.06.009
[6] Akyuz, E., Celik, M. (2014). Utilisation of cognitive map in modelling human error in marine accident analysis and prevention. Safety Science, 70: 19-28. https://doi.org/10.1016/j.ssci.2014.05.004
[7] Wu, B., Yan, X., Wang, Y., Soares, C.G. (2017). An evidential reasoning-based CREAM to human reliability analysis in maritime accident process. Risk Analysis, 37(10): 1936-1957. https://doi.org/10.1111/risa.12757
[8] Theophilus, S.C., Esenowo, V.N., Arewa, A.O., Ifelebuegu, A.O., Nnadi, E.O., Mbanaso, F.U. (2017). Human factors analysis and classification system for the oil and gas industry (HFACS-OGI). Reliability Engineering & System Safety, 167: 168-176. https://doi.org/10.1016/j.ress.2017.05.036
[9] Akyuz, E. (2017). A marine accident analysing model to evaluate potential operational causes in cargo ships. Safety Science, 92: 17-25. https://doi.org/10.1016/j.ssci.2016.09.010
[10] Fu, G., Cao, J.L., Zhou, L., Xiang, Y.C. (2017). Comparative study of HFACS and the 24Model accident causation models. Petroleum Science, 14: 570-578. https://doi.org/10.1007/s12182-017-0171-4
[11] Kim, H.T., Na, S. (2017). Development of a human factors investigation and analysis model for use in maritime accidents: A case study of collision accident investigation. Journal of Navigation and Port Research, 41(5): 303-318. https://doi.org/10.5394/KINPR.2017.41.5.303
[12] Kececi, T., Arslan, O. (2017). SHARE technique: A novel approach to root cause analysis of ship accidents. Safety Science, 96: 1-21. https://doi.org/10.1016/j.ssci.2017.03.002
[13] Chen, J., Zhang, F., Yang, C., Zhang, C., Luo, L. (2017). Factor and trend analysis of total-loss marine casualty using a fuzzy matter element method. International Journal of Disaster Risk Reduction, 24: 383-390. https://doi.org/10.1016/j.ijdrr.2017.07.001
[14] Batalden, B.M., Sydnes, A.K. (2017). What causes “very serious” maritime accidents? Safety and Reliability—Theory and Applications, 3067-3074. https://doi.org/10.1201/9781315210469-389
[15] Batalden, B.M., Sydnes, A.K. (2014). Maritime safety and the ISM code: A study of investigated casualties and incidents. WMU Journal of Maritime Affairs, 13: 3-25. https://doi.org/10.1007/s13437-013-0051-8
[16] Uğurlu, Ö., Yıldız, S., Loughney, S., Wang, J. (2018). Modified human factor analysis and classification system for passenger vessel accidents (HFACS-PV). Ocean Engineering, 161: 47-61. https://doi.org/10.1016/j.oceaneng.2018.04.086
[17] Zhang, L., Wang, H., Meng, Q., Xie, H. (2019). Ship accident consequences and contributing factors analyses using ship accident investigation reports. Proceedings of the Institution of Mechanical Engineers, Part O: Journal of Risk and Reliability, 233(1): 35-47. https://doi.org/10.1177/1748006X18768917
[18] Yildiz, S., Uğurlu, Ö., Wang, J., Loughney, S. (2021). Application of the HFACS-PV approach for identification of human and organizational factors (HOFs) influencing marine accidents. Reliability Engineering & System Safety, 208: 107395. https://doi.org/10.1016/j.ress.2020.107395
[19] Sánchez-Beaskoetxea, J., Basterretxea-Iribar, I., Sotés, I., Machado, M.D.L.M.M. (2021). Human error in marine accidents: Is the crew normally to blame? Maritime Transport Research, 2: 100016. https://doi.org/10.1016/j.martra.2021.100016
[20] Hasanspahić, N., Vujičić, S., Frančić, V., Čampara, L. (2021). The role of the human factor in marine accidents. Journal of Marine Science and Engineering, 9(3): 261. https://doi.org/10.3390/jmse9030261
[21] Li, H., Ren, X., Yang, Z. (2023). Data-driven Bayesian network for risk analysis of global maritime accidents. Reliability Engineering & System Safety, 230: 108938. https://doi.org/10.1016/j.ress.2022.108938
[22] Cao, Y., Wang, X., Yang, Z., Wang, J., Wang, H., Liu, Z. (2023). Research in marine accidents: A bibliometric analysis, systematic review and future directions. Ocean Engineering, 284: 115048. https://doi.org/10.1016/j.oceaneng.2023.115048
[23] Shappell, S.A., Wiegmann, D.A. (2000). The human factors analysis and classification system - HFACS. https://commons.erau.edu/publication/737/.