Ameer Hayder Salman*![]() | Jasim Ahmed Jasim | Mohammed Khudhair Alwan Aljuboori
| Jasim Ahmed Jasim | Mohammed Khudhair Alwan Aljuboori![]() | Ayad Awad Zaidan
| Ayad Awad Zaidan![]()
OPEN ACCESS
The efficiency of evaporative media typically ranges from 80% to 90%. The most effective systems can reduce the temperature of dry air to 95% of the wet-bulb temperature, while the least effective systems can only accomplish 50%. The rate of evaporation efficiency experiences little decline over time. The climate in Iraq has a more extended period of summer in comparison to other nations. The ambient temperature during this season exceeds 50oC, making the evaporative cooling system appropriate for this region. The evaporative cooler in this study is created by incorporating multiple heat exchanger stages (water-air) to cool the input air indirectly and indirectly before cooling directly inside the traditional evaporative cooler. When compared to compression refrigeration systems, the multistage evaporative cooler helps to reduce energy use, environmental pollution, the effects of global warming, and manufacturing costs. The multistage evaporative cooler is appropriate for use in homes and sizable structures with high relative humidity and temperatures. The developed evaporative cooler's experimental findings demonstrated that the addition of a cooling stage to a conventional cooler reduces the out-dry bulb temperature by about 50% and the specific humidity by about 80%.
evaporative cooling, multi-stage evaporative, air-air heat exchanger, indirect evaporative cooling, air conditioning, energy efficiency
The principal environmental ramifications of refrigeration and air conditioning (ACR) systems on a worldwide scale stem from the discharge of refrigerants and energy-related gases. The aforementioned gases are typically emitted from power plants that supply the necessary electricity, steam, or hot water for the production, transportation, installation, operation, maintenance, and eventual disposal of equipment and related devices [1]. On-site occurrences of equipment operation can be facilitated through the utilization of engines or turbines, or via direct-fired absorption cycles. The primary sources of impact, as per [2], are the emissions resulting from the use of refrigerants and combustion for generating operational power. The release or seepage of stable refrigerants that contain chlorine, bromine, and other halogens, although typically insignificant, have an impact on the balance of stratospheric ozone. Similarly, both the prevalent refrigerants and the byproducts of combustion, particularly carbon dioxide (CO2) and to a minor degree nitrous oxide (N2O), function as greenhouse gases (GHGs). The release of refrigerants can have multiple consequences, including but not limited to depletion of the ozone layer due to their breakdown, direct impact as greenhouse gases, and reduced efficacy resulting in higher energy consumption [3-7]. Performance decreases are observed when there are deviations from the optimal charge or, in the case of refrigerant blends, from the optimal combination of charge and composition. Therefore, the primary concerns regarding the mitigation of ozone depletion in the stratosphere and global warming in air conditioning and refrigeration (ACR) systems revolve around the careful selection of refrigerants that have minimal environmental impacts, the reduction of their release, and the enhancement of net efficiencies to decrease energy-related greenhouse gas (GHG) emissions [8].
One of the most cost-effective methods for providing cooling was humidification-de humidification technology. Four packings are inserted into four distinct slots and a cam follower mechanism is employed to drive the new reciprocating packing humidification system that [9] concentrated on developing and building. To ascertain the impact on outlet variables like energy conversion rates and factors, humidification efficacy, and specific cooling capacity, inlet operating parameters like air velocity and camshaft rotation were modified. With better magnitudes for the performance parameters, the reciprocating multi-stages evaporative cooler outperforms the single-stage cooler. The evaporation rate, humidification efficiency (HE), and energy conversion factor (ECF) all decrease as the camshaft speed rises (ER). Air velocity raises ER and ECF while decreasing HE. The ECF attained is 2.9, which corresponds to an air velocity=5.6 m/s and a camshaft speed of 10rpm, and the greatest humidification efficiency is 72.6%. A multi-stage evaporating cooling system may save 7 percent of energy as compared to traditional VCR-based cooling solutions. According to sensitivity study, the air flow rate has a bigger impact on output responses than camshaft rpm. To improve the multi-stages reciprocating cooler's performance, operating parameters have been modified. The findings showed that maintaining an air velocity of 5.3-6 m/s and a camshaft speed of 16-18 rpm improved the evaporation cooler's overall performance while using less energy.
To develop a suitable design for multi-stages IEC systems, devised a performance assessment approach. The indirect evaporation cooler was already given a mathematical basis (IEC). Following validation, the mathematical model had been utilized to examine the assessment criteria while simultaneously considering the effects of the cooling capacity, pressure drop, and multi-stages IEC functioning in two modes [10]. The Mode-2 IEC has a regenerative M-cycle system, whereas the Mode-1 IEC is a typical counter flow device. The IECs work in tandem with one another. The multi-stages system can increase cooling efficiency and lower exhaust air temp. Additionally, the multi-stages system exhibits a greater pressure drop, which causes a larger fan power usage. According to the study of performance assessment criteria, the recommended max stages for the Mode 1 and 2 IECs, respectively, are three stages and two stages [11].
A small counter flow heat exchanger with louvre fins on both sides was developed by Boxem et al. [12] as a model for an indirect evaporative cooler. They showed that the cooler performance was overstated by their estimations by 20 percent for intake air temps under 24 degrees centigrade and by 10 percent for higher inlet temps. The impacts of air stream direction in the channels of the indirect evaporative cooler (IEC) were examined by Shariati and Gilani [13]. They discovered that employing the indirect evaporative cooler with counter-current design led to a greater performance. The IEC heat exchanger technique was described by You et al. [14] using the CFD approach. They looked at factors including input air temp, relative humidity, mass flow rate, and exchanger channel height. They concluded that lower output moisture content and temp could be achieved with lower intake relative humidity and temp. In order to explore the associated mass and heat transport properties in IEC with counter-flow configurations, Wan et al. [15] created a novel method. They looked closely at how various criteria affected the mean Nusselt and Sherwood magnitudes in their investigation. An experimental and computational investigation the effectiveness of a counter-flow dew point evaporative cooling system was conducted by Pakari and Ghani [16]. They discovered that the cooling system's anticipated outlet temp from 1-dimensional and three d models and the experimental findings agreed rather well. A cross-flow heat exchanger-based indirect evaporative cooler was explored [17]. They built a novel IEC system model in their research that considered working circumstances as well as the impacts of secondary air humidification and surface wettability parameter.
A CFD model was utilized to take counter flow dew point evaporative coolers into account [18]. The highest deviation predicted by the model from experimental data was 6 percent. The length and breadth of the cooling system's channels were the two dimensions that were examined in the model. A counter-cross flow plate heating recovery exchanger, which serves as an indirect evaporative air cooler, was the subject of a comparative research by Li et al. [19]. According to their findings, the exchanger installed vertically had a lower exit temp than the exchanger set horizontally.
A thermal model of a desiccant aided dispersed fan-pad ventilated greenhouse system to estimate the air's temp within the greenhouse. They used reference model research that was already published in the literature in order to validate the model [20]. It was discovered that during a hot and humid season, a greenhouse was able to achieve a temperature reduction of 4.3 degrees Celsius below the ambient temperature, but a standard fan-pad system only achieved a temperature reduction of 2.5 degrees Celsius below the ambient temperature. In addition to this, they included a cumulative cash flow model into their analysis so that they could determine the payback time and the Net Present Magnitude of the greenhouse system.
The current investigation aims to create an evaporative cooler by incorporating multiple heat exchanger stages (water-air) to cool the input air indirectly and indirectly before cooling directly inside the traditional evaporative cooler: Creating a mathematical model for the system components by ANSYS software to simulate the performance of multi-stage evaporative cooling systems. Investigating the effect of relative humidity and the distance between the heat exchanger plates on a Multi-stage Evaporative Cooling System. Also determine the cooling system efficiency throughout February and July to track the system's performance under various weather temperatures.
2.1 Model description
Greenhouses located in regions with warm summers often have a difficult time producing crops during the summer months due to the fact that the temp within the greenhouse increases over the range that is suitable for growing [21]. Cooling methods are necessary to permit cultivation at any time of the year; yet traditional cooling technologies like as vapor compression and evaporative cooling have severe drawbacks that prevent their widespread use. Evaporative cooling is only a viable option in regions that have a plentiful supply of water and takes a significant amount of energy to operate. Compressing vapors often involves the use of refrigerants that contribute to climate change. Vapor compression. As a result, there is not currently a market for water- and resource-efficient greenhouses that are suitable for hot climes [22]. To fill this significant void, there is a pressing need for more efficient thermal processes that use less water.
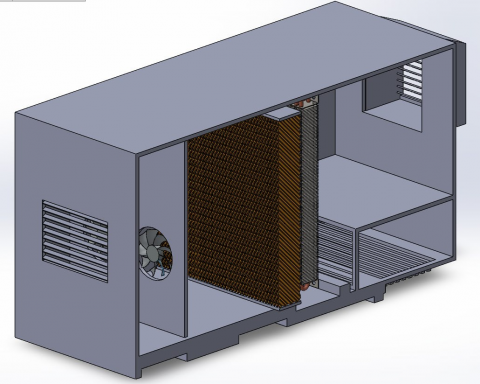
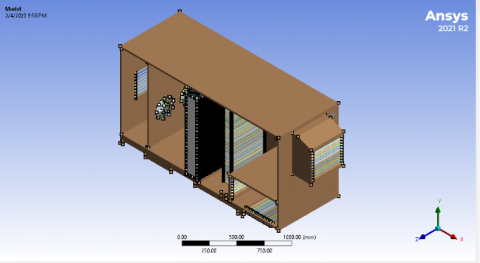
In the current investigation, 10-row chilled water-cooling coils with dimensions of 75cm in length, 0.0125m in diameter, and 5cm between each coil have been employed. For implementing the boundary conditions, the complete coil set was contained in a rectangular cube with dimensions of 2 meters long by 0.75 meters wide by 1 meters high [23] depicts the indirect evaporative cooling system's geometry, as shown in Table 1.
2.1.1 Air fan
In three stages cooling system, a big air fan has been placed in the ceiling of the evaporation cooling system unit to give enough space for entering the hot air into the system, as well as when change the system from three stages to two stages cooling system just close or remove the ceiling fan. While in both three and two stages cooling system, the second fans were (two small fans) to give high opportunity for air path to move on.
Table 1. Model geometry
|
Bounding Box |
||
|
Length X |
2258.1 mm |
|
|
Length Y |
1000 mm |
|
|
Length Z |
770 mm |
|
|
Properties |
||
|
Volume |
1.3872e+009mm³ |
|
|
Scale Factor Magnitude |
1 |
|
|
Statistics |
||
|
Nodes |
409867 |
|
|
Elements |
2212351 |
|
2.1.2 Multi-pipes heat exchanger
The double pipe heat exchanger is a specialized type of conduit that features a centrally located conductive barrier. This barrier effectively prevents the formation of an annulus shape between the two flowing liquids and an adjacent pipe. The inner half of the pipe functions as a conduit for the working fluid. The inner tube functions as a conduit for the subsequent thermal exchange. As the cold fluid passes through the outer shell, the heated fluid flows through the inner tube. Double pipe exchangers are often used in high-pressure and high-temp applications because of their strong structure and capacity to expand. When the hot flow surpasses the cold flow, they could also undergo temp cross throughout counterflow. A twin pipe heat exchanger is often employed in situations where the more common shell and tube exchangers are ineffective at transferring the required amounts of heat. To raise the temp, it may be employed either in parallel or in series.
2.1.3 Water pad
In order to reduce the air temp, wet curtain (water curtain) cooling primarily employs water in the evaporation process to absorb heat from the air. Used in practice along with a negative pressure fan, a wet curtain is installed on one end of an airtight building's gable or side wall, and a fan is installed on the opposite end. This creates a negative pressure that forces outdoor air to flow through the wet curtain's porous surface, reducing the temp of the indoor air by 10 to 15 degree centigrade while also burning a lot of calories.
Figure 1. Two stages evaporation cooling models
At the heart of the cooling pad cooling process is the finished paper pad, which has a thin layer of water film on the surface of corrugated fiber. Once outdoor hot air is drawn through the paper by a suction fan, the water on the water film would then absorb the heat and turn into steam, causing the indoor temp to drop more than 5 or 10 degrees as a result as shown in Figure 1.
2.2 Governing equations
The flow was regarded as incompressible, turbulent, and three-dimensional in the current investigation. The ANSYS CFD code Fluent can handle species transport problems as well as energy, momentum, and continuity formulas. The momentum and continuity formulas applied in this situation are represented by formulas (1) and (2), respectively. Furthermore, we investigate the acceleration caused by droplet particles and viscous forces [24].
$\frac{\partial \rho}{\partial \mathrm{t}}+\nabla \cdot(\rho \overrightarrow{\mathrm{v}})=S_{D P M}+S_{\text {Other }}$ (1)
where, as ρ = fluid density phase, $\overrightarrow{\mathrm{v}}$= velocity in vector formula, SDPM = discrete phase model source, SOther = extra mass source.
$\frac{\partial \overrightarrow{\rho v}}{\partial \mathrm{t}}+\nabla \cdot(\rho \vec{vv})=-\nabla \mathrm{p}+\nabla \tau+\rho \mathrm{g}+F_{D P M}$ (2)
where, as DPM force acceleration is FDPM, gravitational acceleration is g, statical pressure is P, and stress tensor is $\tau$.
In ANSYS Fluent 20, the species transportation formula is used to simulate the movement of water vapor in the atmosphere. The species transport formula is expressed in formula (3).
$\frac{\partial \rho \mathrm{Y}_i}{\partial \mathrm{t}}+\nabla \cdot\left(\rho \overrightarrow{\mathrm{Y}_{\imath}}\right)=-\nabla \cdot \overrightarrow{\mathrm{J}_i}+\overrightarrow{\mathrm{S}_l}$ (3)
where, as: species created by DPM is known as Si, flux diffusion is Ji, local fractional mass for every species is presented by Yi.
The energy formula shown in Eq. (4) controls how heating is transferred [24].
$\frac{\partial \rho \mathrm{E}}{\partial \mathrm{t}}+\nabla \cdot(\vec{v}(\rho \mathrm{E}+\mathrm{p}))=\nabla \cdot\left(\mathrm{k}_{e f f} \nabla \mathrm{T}-\sum_j h_j \vec{J}_i+\bar{\tau}_{e f f} \cdot \vec{v}\right)$ (4)
where, as: enthalpy is characterized by E, effective thermally conductive is Keff, flux diffusion is Ji since species.
The flow simulation that uses the allowing species transfer formula and k-k turbulence model was already done utilizing the governing formulas mentioned above. The k-εk-ε turbulence model's formulas were just as following:
Kinetics energy for turbulent (k) [25]:
$\rho \frac{\partial \mathrm{k}}{\partial \mathrm{t}}+\rho \mathrm{u}_{\mathrm{i}} \frac{\partial \mathrm{k}}{\partial \mathrm{x}_{\mathrm{i}}}=\tau_{\mathrm{ij}} \frac{\partial \mathrm{u}_{\mathrm{j}}}{\partial \mathrm{x}_{\mathrm{i}}}-\rho \varepsilon+\frac{\partial}{\partial \mathrm{x}_{\mathrm{i}}}\left[\left(\mu+\mu_{\mathrm{t}} / \sigma_{\mathrm{k}}\right) \frac{\partial \mathrm{k}}{\partial \mathrm{x}_{\mathrm{j}}}\right]$ (5)
The ratio at which turbulent energy is dissipated (ε) [24]:
$\rho \frac{\partial \varepsilon}{\partial \mathrm{t}}+\rho \bar{\mathrm{u}_{\mathrm{j}}} \frac{\partial \varepsilon}{\partial \mathrm{x}_{\mathrm{j}}}=\mathrm{C}_{\varepsilon 1} \frac{\varepsilon}{\mathrm{k}} \tau_{\mathrm{ij}} \frac{\partial \bar{\mathrm{u}_{\mathrm{i}}}}{\partial \mathrm{x}_{\mathrm{j}}}-\mathrm{C}_{\varepsilon 2} \rho \frac{\varepsilon^2}{\mathrm{k}}+\frac{\partial}{\partial \mathrm{x}_{\mathrm{i}}}\left[\left(\mu+\mu_{\mathrm{t}} / \sigma_{\varepsilon}\right) \frac{\partial \varepsilon}{\partial \mathrm{x}_{\mathrm{j}}}\right]$ (6)
2.3 Grid generation and numerical method
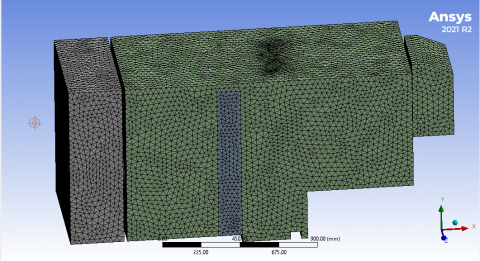
Tetrahedral mesh was employed in the current work for the computing area's inlet and outflow areas. Further, to achieve high calculation accuracy, fine meshes were used for the most sensitive sections. Figure 2 shows the grid from both the top and side, respectively.
Figure 2. The grid’s lateral view
2.3.1 Bounding conditions
The bounding conditions are defined to the intake velocities for the inlet and the outlet pressures for the outlet side. The coils were also given the no-slip boundary conditions. The working fluids have been thought to be water, which has a density=998.2 kg/m3 and a viscosity= 0.001003 kg/m3, and air, which has a density=1.225 kg/m3 and a viscosity of 1.7894 10-5 kg/m3. With a moisture content of 34.9 percent, the warm air intake temp is 300 Kelvin, and the temp of the water is 275 Kelvin. The boundary situation for the coils' input portion has been adjusted to inlet velocity, while the boundary situation for the coils' outlet part was set to outlet pressures. With a water entry velocity of 0.5 m/s, the Reynolds number ranged from 6300-12,640 for various coils sizes, leading to the assumption that the flow was turbulent.
Utilizing ANSYS Fluent 20, the numerical analyzing has been performed depending on the CFD codes that are utilized to represent the complicated behaviors of mass and heating flow [26-28] and were also employed in a number of issues [29, 30]. Formulas for energy, momentum, and continuity were discretized using the upwind second-order approach. Additionally, pressure computation was second order, and the SIMPLE method was employed for pressure-velocity couplings [30]. For all formulas, the convergence conditions were regarded as smaller than 106. The Reynolds-Average Navier-Stokes (RANS) formulas regulate the flow because of the great Reynolds number flow within the coils. In accordance with the recommendations of other research for comparable flows [31, 32], the turbulence behavior within the coil were modelled utilizing a typical k-ε turbulence model.
2.4 Selected site of study
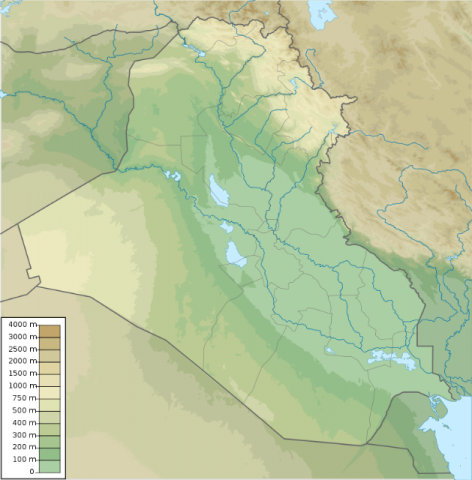
The nation of Iraq, formally referred to as the Republic of Iraq, is geographically situated in Western Asia as shown in Figure 3. There are two distinct climate zones in Iraq: The dry, hot lowlands, which include the alluvial plains and the deserts, and the wetter, cooler northeast, which is located at a higher elevation and has lower average temps.
In the lowlands, there are only two distinct seasons: summer and winter, with just a few weeks of in-between transitional weather. The summer, which begins in May and continues until October, is marked by cloudless sky, very high temps, and low relative humidity; throughout the months of June through September, there is no precipitation that happens. Temps over 123 degrees Fahrenheit (51 degrees Celsius) have been reported in Baghdad during the summer months of July and August. Mean daily temps during those months hover around 95 degrees Fahrenheit (35 degrees Celsius). In the summer, there is a significant difference in temp between night and day.
The pathways of westerly air depressions that travel across the Middle East throughout the winter move southward, delivering rain to southern Iraq. The typical annual precipitation in the lowlands varies from 4 to 7 inches (100 to 180 mm); almost all of this precipitation falls between November and April. Yearly totals fluctuate greatly from year to year, but the mean annual precipitation is between these two extremes.
Figure 3. The map of study area (Iraq)
December and February are the months during which the lowlands experience winter. Temps are normally temperate; however, it is possible to experience both very hot and extremely cold weather, including frost. Temps in Baghdad during the wintertime vary from roughly 2 to 15 degrees Celsius, which is 35 to 60 degrees Celsius.
Depending on the previous information of the location and climate of Iraq the following parameters have been selected to investigated in the simulated application of the evaporation cooling case as shown in Tables 2 and 3.
Table 2. Selected parameters for investigating
|
Parameter |
Magnitudes |
|
Temp (C) |
February=12.5 July=45 October=37 |
|
Reynolds number |
1000, 2500, 10000 |
|
Fan air velocity |
1m/s, 2m/s |
|
Relative humidity |
15%, 52% |
Table 3. Summary of temperature results with two stages evaporative cooling system at three months
|
Cases |
Input Temperature |
Outlet Temperature |
||
|
Min |
Average |
Max |
||
|
1 |
12.5 |
0.15 |
11.59 |
12.54 |
|
2 |
37 |
0.15 |
18.41 |
36.66 |
|
3 |
45 |
0.15 |
21.91 |
43.67 |
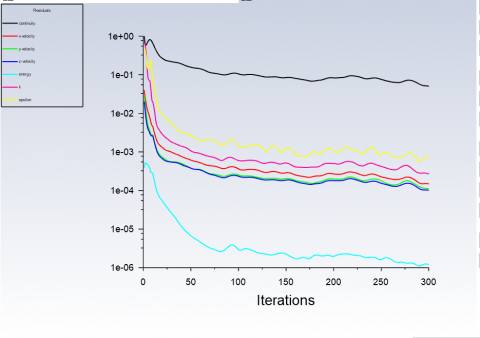
In relation to the maximum number of iterations, it is important to note that the purpose of iterations is to obtain the optimal converged solution. For instance, it is not uncommon to observe initial iterations exhibiting non-smooth behavior, but as the number of iterations increases, convergence stabilizes and remains constant. Consequently, selecting several iterations beyond this point, such as 20, would be unnecessary and would only serve to prolong simulation calculation time without yielding any additional benefits. This could potentially impede progress towards meeting project deadlines.
Upon conducting 300 computations and executing the relevant computations, the resultant iteration graph was visualized within the Fluent interface. The residual velocity graphs for 300 iterations in the direction of continuity, (x, y & z)-velocity, k and omega are depicted in Figure 4.
Figure 4. Residual velocity graphs of 300 iteration for model two with two stages cooling system
3.1 Velocity streamline
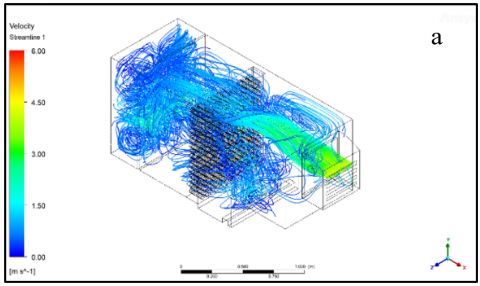
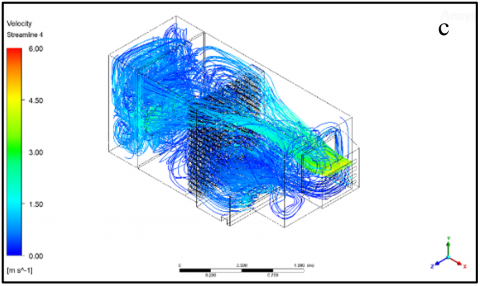
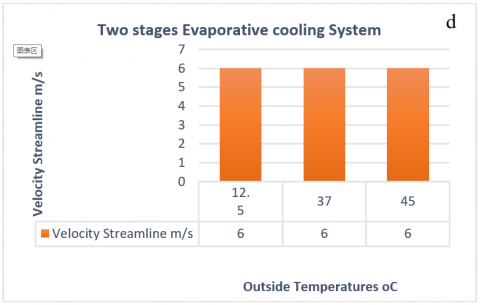
Figure 5(a-c) show the streamline distribution of cooling three stages evaporating system with three different temps (12.5, 37 and 45) degree centigrade. In two stages evaporative cooling system the velocity streamline magnitudes are constant despite changing the inlet temps. From Figure 5(d) demonstrates that the velocity streamline magnitudes have not changed in two stages evaporative cooling system and increasing the weather temp from 12.5 to 45 degrees centigrade are changed due to absence of water pad that change the surrounding environment.
Figure 5. Velocity streamline for model one with a) 12.5, b) 37, c) 45 degrees centigrade and d) relationship between Velocity Streamline and outside temperature
3.2 Velocity volume rendering
The observed relationship between inlet design and height with flow uniformity and average velocity is in accordance with expectations. Nevertheless, the elimination of spatter particles lacks clarity. The findings suggest that there is no direct correlation between an increased local velocity and the elimination of spatter particulates from the processing area. The observed phenomenon may be attributed to the formation of a recirculation zone within the chamber, causing the particles to evade the bulk flow as a result of their initial velocities. The recirculation zone of the argon flow has the potential to confine particulates within the machine, impeding their effective removal from the built chamber and resulting in their deposition in other regions of the chamber. Regrettably, an effective quantification of the recirculation zone is currently unattainable. The spatter particulates could have been eliminated from the process area, but their removal from the system through the outlet may not have been entirely successful.
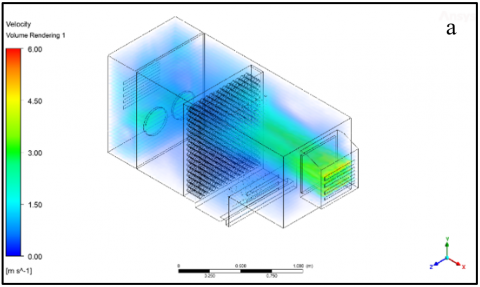
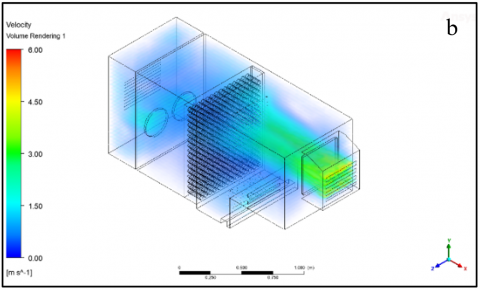
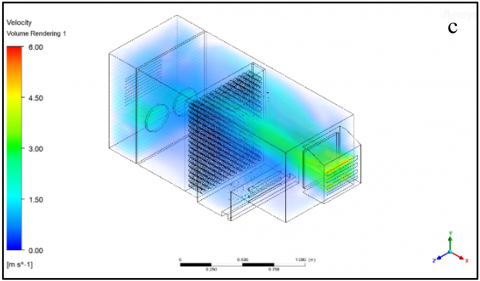
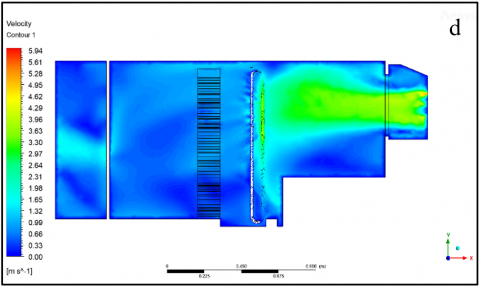
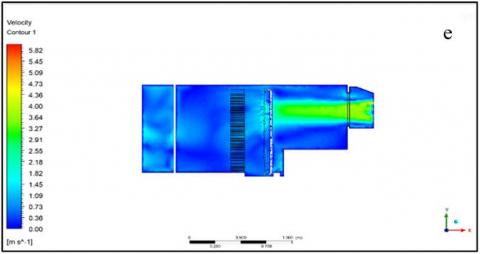
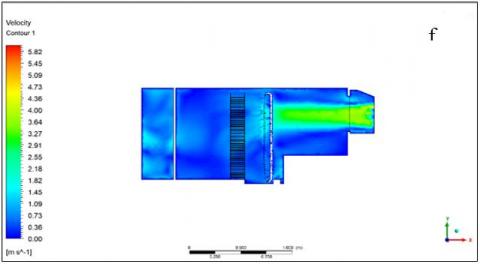
Figure 6. Velocity volume rendering 1 for model two a) 12.5, b) 37, c) 45 degrees centigrade, and Velocity counter 1 for model two with d) 12.5, e) 37, f) 45 degree centigrade
Figure 6(a-c) demonstrate that the velocity volume rendering magnitudes have not changed in two stages evaporative cooling system and increasing the weather temp from 12.5 to 45 degrees centigrade are changed due to absence of water pad that change the surrounding environment.
Figure 6(d-f) show the velocity counter distribution of cooling two stages evaporating system with three different temps (12.5, 37 and 45) degree centigrade. In two stages of evaporative cooling system the velocity counter magnitudes are reduced with increasing the weather temps from 12.5 to 37 degree centigrade constant but increasing the weather temp to 45 has no effective change on velocity counter.
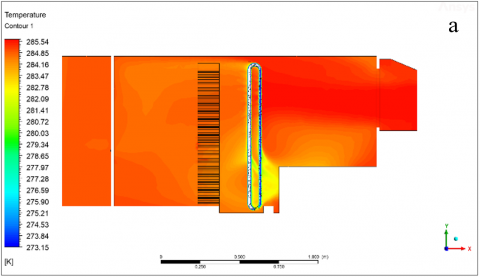
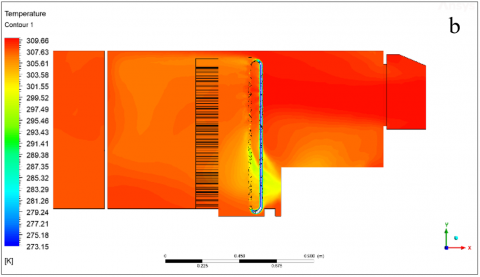
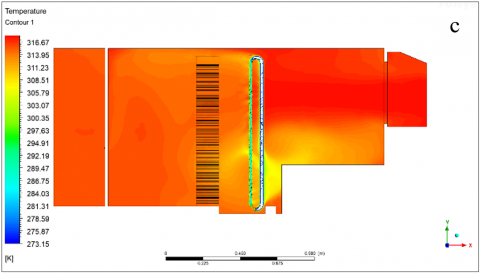
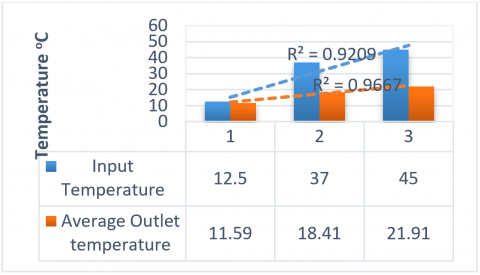
Figure 7. Temperature distribution for model two with a) 12.5, b) 37, c) 45 degrees centigrade and d) relationship between input temperature and output temperature
3.3 Temperature distribution
With two stages evaporative cooling, the temperature distribution counter for three selected months is shown in figure Figures 7(a-c). Based on simulation results increasing the input temperature with similar inlet velocity 6m/s the reduction in the temperatures were increase with increased the inlet temperature. In February with 12.5℃, the cooling system was reduced the temperature to 11.59℃, while with increasing the temperature in October and July (37, 45℃) show reduction to 50% and more. And the obtained results from ANSYS software show good correlation between increasing temperature and reduction temperature when using two stages evaporative cooling system as shown in Figure 7(d).
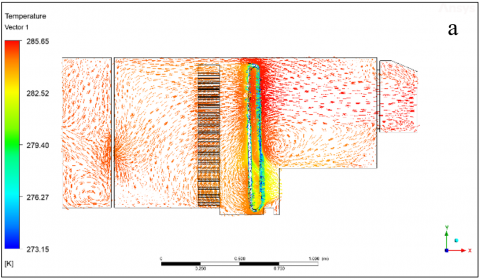
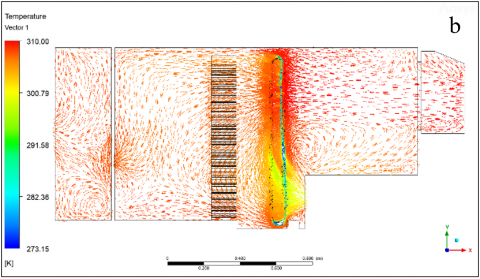
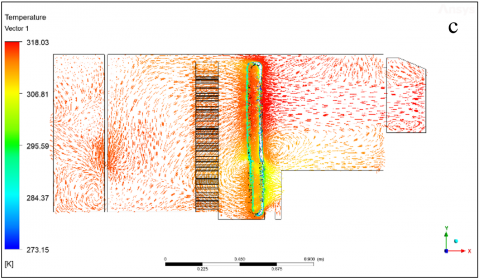
3.4 Temperature vector
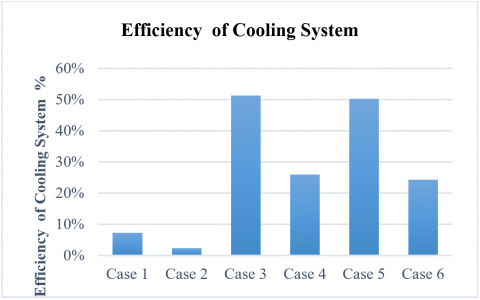
The temperature vector gives an indication about the places that increase temperature or decreased it, Figures 8(a-c) show that the highest temperature is records in the entrance and this value increased significantly before heat-exchanges, while it reduced after it and reduced significantly after water pad due to working the pad on drop down the temperature of outside weather, as shown in Figure 8 and Figure 9 is the efficiency of cooling system and the Table 4 is show the effect of relative humidity.
Figure 8. Temperature vector 1 for model two with a) 12.5, b) 37, and c) 45 degrees centigrade
Figure 9. Efficiency of cooling system for two stages evaporative cooling system
Table 4. The effect of relative humidity on the outlet temp for two stages evaporative cooling system
|
Cases |
Inlet-Temp |
Relative Humidity |
Outlet Temp |
Efficiency of Cooling System |
|
1 |
12.5 |
15% |
11.59 |
7% |
|
2 |
12.5 |
52% |
12.21 |
2% |
|
3 |
45 |
15% |
21.91 |
51% |
|
4 |
45 |
52% |
33.3 |
26% |
|
5 |
37 |
15% |
18.41 |
50% |
|
6 |
37 |
52% |
28 |
24% |
The focus of the present study was on fan-pad evaporation cooling, and other potentially useful cooling systems such as desiccated pad evaporative cooling, two-stage and three-stage evaporative cooling, and greenhouses. The study placed a strong emphasis on the most important aspects of evaporative cooling as well as the performance characteristics of the systems. According to the findings of the research, evaporative cooling is not used in greenhouses on its own but rather in conjunction with other methods, like ventilation and shade. There are various benefits and drawbacks associated with using each kind of evaporative cooling system.
[1] Calm, J.M. (2002). Emissions and environmental impacts from air-conditioning and refrigeration systems. International Journal of Refrigeration, 25(3): 293-305. https://doi.org/10.1016/S0140-7007(01)00067-6
[2] Calm, J.M. (2006). Comparative efficiencies and implications for greenhouse gas emissions of chiller refrigerants. International Journal of Refrigeration, 29(5): 833-841. https://doi.org/10.1016/j.ijrefrig.2005.08.017
[3] Casper, J.K. (2010). Greenhouse Gases: Worldwide Impacts. Infobase Publishing.
[4] Al-Naely, H., Al-Khafaji, Z., Khassaf, S. (2018). Effect of opening holes on the hydraulic performance for crump weir. International Journal of Engineering, 31(12): 2022-2027.
[5] Radhi, S.S., Al-Khafaji, Z.S., Falah, M.W. (2022). Sustainable heating system by infrared radiators. Heritage and Sustainable Development, 4(1): 42-52. https://doi.org/10.37868/hsd.v4i1.82
[6] Hamad, M.A., Nasr, M., Shubbar, A., Al-Khafaji, Z., Al Masoodi, Z., Al-Hashimi, O., Kot, P., Alkhaddar, R., Hashim, K. (2021). Production of ultra-high-performance concrete with low energy consumption and carbon footprint using supplementary cementitious materials instead of silica fume: A review. Energies, 14(24): 8291. https://doi.org/10.3390/en14248291
[7] Sharaf-Eldin, M.A., Yaseen, Z.M., Elmetwalli, A.H., Elsayed, S., Scholz, M., Al-Khafaji, Z., Omar, G.F. (2023). Modifying walk-in tunnels through solar energy, fogging, and evaporative cooling to mitigate heat stress on tomato. Horticulturae, 9(1): 77. https://doi.org/10.3390/horticulturae9010077
[8] Zeggio, F. (2020). Environmentally friendly technologies for energy systems in the cold chain for food. Master's Thesis, Universitat Politècnica de Catalunya. http://hdl.handle.net/2117/333505.
[9] Kumar, S., Reddy, S.K., Salins, S.S. (2022). Experimental investigation on the humidification parameters of the reciprocating multistage evaporative Cooler-A novel approach. International Journal of Thermal Sciences, 177: 107539. https://doi.org/10.1016/j.ijthermalsci.2022.107539
[10] Cui, X., Yang, X., Kong, Q., Meng, X., Jin, L. (2020). Performance evaluation and comparison of multistage indirect evaporative cooling systems in two operation modes. International Journal of Energy Research, 44(12): 9298-9308. https://doi.org/10.1002/er.4803
[11] Al-Juwayhel, F., El-Dessouky, H., Ettouney, H., Al-Qattan, M. (2004). Experimental evaluation of one, two, and three stage evaporative cooling systems. Heat Transfer Engineering, 25(6): 72-86. https://doi.org/10.1080/01457630490486292
[12] Boxem, G., Boink, S., Zeiler, W. (2007). Performance model for small scale indirect evaporative Cooler. in: Clima 2007, Helsinki, Finland, FINVAC, 2007.
[13] Shariati, N.M., Gilani, N. (2009). An investigation of indirect evaporative coolers, IEC with respect to thermal comfort criteria. Iranian Journal of Chemical Engineering, 6(2).
[14] You, Y., Jiang, H., Lv, J. (2019). Analysis of influence of IEC heat exchanger based on CFD method. Energy Procedia, 158: 5759-5764. https://doi.org/10.1016/j.egypro.2019.01.555
[15] Wan, Y., Ren, C., Xing, L. (2017). An approach to the analysis of heat and mass transfer characteristics in indirect evaporative cooling with counter flow configurations. International Journal of Heat and Mass Transfer, 108: 1750-1763. https://doi.org/10.1016/j.ijheatmasstransfer.2017.01.019
[16] Pakari, A., Ghani, S. (2019). Comparison of 1D and 3D heat and mass transfer models of a counter flow dew point evaporative cooling system: Numerical and experimental study. International Journal of Refrigeration, 99: 114-125. https://doi.org/10.1016/j.ijrefrig.2019.01.013
[17] De Antonellis, S., Joppolo, C.M., Liberati, P., Milani, S., Romano, F. (2017). Modeling and experimental study of an indirect evaporative cooler. Energy and Buildings, 142: 147-157. https://doi.org/10.1016/j.enbuild.2017.02.057
[18] Wan, Y., Lin, J., Chua, K.J., Ren, C. (2018). Similarity analysis and comparative study on the performance of counter-flow dew point evaporative coolers with experimental validation. Energy Conversion and Management, 169: 97-110. https://doi.org/10.1016/j.enconman.2018.05.043
[19] Li, W.Y., Li, Y.C., Zeng, L.Y., Lu, J. (2018). Comparative study of vertical and horizontal indirect evaporative cooling heat recovery exchangers. International Journal of Heat and Mass Transfer, 124: 1245-1261. https://doi.org/10.1016/j.ijheatmasstransfer.2018.04.041
[20] Banik, P., Ganguly, A. (2017). Performance and economic analysis of a floricultural greenhouse with distributed fan-pad evaporative cooling coupled with solar desiccation. Solar Energy, 147: 439-447. https://doi.org/10.1016/j.solener.2017.03.057
[21] Davies, P.A. (2005). A solar cooling system for greenhouse food production in hot climates. Solar Energy, 79(6): 661-668. https://doi.org/10.1016/j.solener.2005.02.001
[22] Misra, D., Ghosh, S. (2018). Evaporative cooling technologies for greenhouses: A comprehensive review. Agricultural Engineering International: CIGR Journal, 20(1): 1-15.
[23] Zhou, X., Braun, J.E. (2004). Transient modeling of chilled water cooling coils. https://docs.lib.purdue.edu/iracc/652/.
[24] Fluent, A.N.S.Y.S. (2013). Release 15.0, theory guide. ANSYS Inc, Canonsburg.
[25] Malalasekera, W. (2007). An introduction to computational fluid dynamics: The finite volume method. Pearson Prentice Hall.
[26] Fatahian, H., Salarian, H., Nimvari, M.E., Fatahian, E. (2018). Numerical study of thermal characteristics of fuel oil-alumina and water-alumina nanofluids flow in a channel in the laminar flow. IIUM Engineering Journal, 19(1): 251-269. https://doi.org/10.31436/iiumej.v19i1.857
[27] Lima, A.A.S., Ochoa, A.A.V., Da Costa, J.A.P., Henríquez, J.R. (2019). CFD simulation of heat and mass transfer in an absorber that uses the pair ammonia/water as a working fluid. International Journal of Refrigeration, 98: 514-525. https://doi.org/10.1016/j.ijrefrig.2018.11.010
[28] Qian, Y., Han, Z., Zhan, J.H., Liu, X., Xu, G. (2018). Comparative evaluation of heat conduction and radiation models for CFD simulation of heat transfer in packed beds. International Journal of Heat and Mass Transfer, 127: 573-584. https://doi.org/10.1016/j.ijheatmasstransfer.2018.06.127
[29] Fatahian, E., Nichkoohi, A.L., Fatahian, H. (2019). Numerical study of the effect of suction at a compressible and high Reynolds number flow to control the flow separation over Naca 2415 airfoil. Progress in Computational Fluid Dynamics, an International Journal, 19(3): 170-179. https://doi.org/10.1504/PCFD.2019.099598
[30] Yue, C., Zhang, Q., Zhai, Z., Ling, L. (2018). CFD simulation on the heat transfer and flow characteristics of a microchannel separate heat pipe under different filling ratios. Applied Thermal Engineering, 139: 25-34. https://doi.org/10.1016/j.applthermaleng.2018.01.011
[31] Montazeri, H., Blocken, B., Hensen, J.L.M. (2015). Evaporative cooling by water spray systems: CFD simulation, experimental validation and sensitivity analysis. Building and Environment, 83: 129-141. https://doi.org/10.1016/j.buildenv.2014.03.022
[32] Gebrehiwot, B., Dhiman, N., Rajagopalan, K., Agonafer, D., Kannan, N., Hoverson, J., Kaler, M. (2013). CFD modeling of indirect/direct evaporative cooling unit for modular data center applications. In International Electronic Packaging Technical Conference and Exhibition. American Society of Mechanical Engineers, 55768: V002T08A054. https://doi.org/10.1115/IPACK2013-73302