Yan Liu*![]() | Zeqing Hou
| Zeqing Hou![]() | Ziye Feng
| Ziye Feng![]()
© 2024 The authors. This article is published by IIETA and is licensed under the CC BY 4.0 license (http://creativecommons.org/licenses/by/4.0/).
OPEN ACCESS
This study aims to explore the effects of temperature cycling on the performance of alkali-activated fly ash-slag cementitious materials (AAFS) under various slag contents, alkali concentrations, and alkali modulus conditions. Through analyses using XRD, SEM, and FT-IR, the research examines the evolution of mass loss, drying shrinkage characteristics, and compressive strength of AAFS subjected to 60℃ temperature cycles. The findings reveal that temperature cycling significantly promotes the hydration reaction of AAFS, enhancing its compressive strength, particularly after 60 cycles of temperature exposure. The hydration products C-S-H and C-A-S-H contribute positively to compressive strength, with notable effects observed from 0 to 60 cycles. Increasing slag content magnifies its impact on AAFS performance, reducing mass loss and increasing both shrinkage rate and compressive strength. When the slag content reaches 100%, the rate of mass loss during temperature cycling is minimized, and both drying shrinkage and compressive strength are significantly improved. However, the effect becomes less pronounced when the slag content exceeds 50%. Higher alkali concentration and modulus lead to an increased matrix density, yet the compressive strength of AAFS peaks at an alkali concentration of 6% and a modulus of 1.0, due to a reduction in [SiO4]4- ions and a shift from dual to single activation. Considering both economic and practical aspects, it is recommended to use AAFS combinations with no more than 50% slag content, an alkali concentration of 6%, and an alkali modulus of 1.0. These discoveries provide theoretical support for the application of AAFS in specific environmental conditions.
alkali-activated materials, fly ash, slag, compressive strength, mass change, drying shrinkage, microstructure
Silicate cement is used in large quantities in construction engineering [1], with China's production reaching 2.13 billion tons in 2022, ranking first in the world. However, the production process of cement requires high-temperature decomposition of limestone to produce reactive silicate and aluminate phases [2], which significantly pollutes air quality. To meet the demands of developing a "resource-saving" and "environmentally friendly" society, it is imperative to develop a new type of green, low-carbon cementitious material as an alternative to ordinary silicate cement to promote sustainable development.
Alkali-activated cementitious materials are a new type of binder made by mixing siliceous, aluminous, or calcium-aluminosilicate solid waste with an alkali solution [3]. They offer advantages such as high strength, low energy consumption, green and low carbon footprint, and good chemical resistance. Their production can consume a large amount of accumulated industrial by-products, significantly saving resources. The properties of alkali-activated cementitious materials depend on the hydration products, which are closely related to the chemical composition of the raw materials. Fly ash and slag contain high levels of silicon and aluminum and have potential reactivity, making them common raw materials for producing geopolymeric materials in practical applications [4]. The advantage of the alkali-activated fly ash-slag system is based on the "complementary effect" [5], where alkali-activated slag materials set quickly and have high strength [6], but their drawback is significant drying shrinkage, leading to cracking during use [7], and mixing in fly ash can solve this problem to some extent.
In recent years, many scholars have studied the mechanical properties and microstructural characterization of alkali-activated cementitious materials. However, there is less research on the performance evolution mechanism of alkali-activated cementitious materials under temperature cycling in specific environments, focusing only on the effects of low and high temperatures. Tran et al. [8] found that alkali-activated slag mortar specimens could maintain good compressive strength after high-temperature curing; Zheng et al. [9] studied the performance of alkali-activated slag cementitious materials at high temperatures and found their high-temperature resistance to be superior to that of ordinary cement stone. Singh and Subramaniam [10] discovered that rising temperatures accelerated the dissolution rate of the glass phase in fly ash, increasing the formation of amorphous reaction products. Pan et al. [11] used XRD, SEM, and FTIR techniques to study the microstructural changes of different alkali-activated cementitious materials after thermal exposure, finding that slag-based specimens had the worst high-temperature performance, especially at 300℃, mainly due to their different raw materials. Chen et al. [12] studied the effect of different temperatures and curing conditions on the performance of alkali-activated slag mortars, indicating that thermal curing hindered the late strength development of alkali-activated slag mortars, and raising the curing temperature was more effective than extending the curing time in reducing mortar drying shrinkage. Due to the impact of climate change, the variability of environmental conditions, and other factors, mid-temperature environments are very common in engineering applications, yet few studies exist. For example, the working temperature of cross-sea bridge piers can reach 60-70℃ in summer. When the piers are rapidly cooled by seawater, this surface temperature change is known as temperature cycling. The internal temperature changes in concrete lead to stress redistribution, reducing the stability of the structure and easily causing overall structural damage. In production and life, many concrete structures work at temperatures of 60-70℃ [13], but research on the impact of temperature cycling on the performance of alkali-activated cementitious materials is still scarce. Therefore, studying the effect of temperature cycling on the performance of alkali-activated cementitious materials within this range has practical engineering significance. According to previous studies, slag content and alkali concentration may affect material performance, which may show different trends under temperature cycling. Therefore, this study uses S95 grade slag, grade I fly ash, NaOH, Na2SiO3 as the main raw materials, adjusting slag content, Na2O concentration, and alkali activator modulus to study the shrinkage characteristics and mechanical performance evolution mechanism of AAFS under 60℃ temperature cycling, aiming to provide a theoretical basis for the application of alkali-activated fly ash-slag cementitious materials under specific temperature cycling conditions and guidance for engineering practice. This research mainly includes the introduction of the specific operation steps for preparing specimens, followed by studies on the materials' mass loss rate, drying shrinkage characteristics, compressive strength, and microstructural performance.
2.1 Raw materials
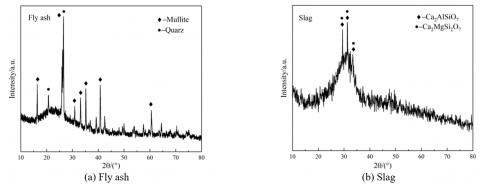
Fly ash (Grade I), with its chemical composition shown in Table 1 and XRD spectrum presented in Figure 1(a); Slag (Grade S95, finely ground), with its chemical composition shown in Table 1 and XRD spectrum presented in Figure 1(b); Alkali activator: Solid NaOH (96% purity); Mixed solution of Na2SiO3 with a modulus of 3.22 (26.5% SiO2; 8.5% Na2O; 65% H2O); Isopropanol (analytical grade).
Table 1. Main chemical components of cementitious materials
|
Materials |
CaO |
MgO |
Al2O3 |
SiO2 |
Fe2O3 |
SO3 |
LOI |
|
Slag |
35.58 |
7.16 |
16.32 |
36.10 |
0.23 |
1.71 |
2.90 |
|
Fly ash |
0.85 |
2.53 |
30.06 |
56.11 |
3.01 |
0.65 |
1.51 |
Figure 1. X-ray diffraction
Table 2. Mixture ratio of alkali activated fly ash-slag slurry
|
Samples |
Fly Ash/wt% |
Slag/wt% |
Na2O Concentration/wt% |
Modulus |
Liquid-Solid Ratio |
|
S0-4-1 |
100 |
0 |
4 |
1.0 |
0.3 |
|
S25-4-1 |
75 |
25 |
4 |
1.0 |
0.3 |
|
S50-2-1 |
50 |
50 |
2 |
1.0 |
0.3 |
|
S50-4-0.5 |
50 |
50 |
4 |
0.5 |
0.3 |
|
S50-4-1 |
50 |
50 |
4 |
1.0 |
0.3 |
|
S50-4-1.5 |
50 |
50 |
4 |
1.5 |
0.3 |
|
S50-6-1 |
50 |
50 |
6 |
1.0 |
0.3 |
|
S50-8-1 |
50 |
50 |
8 |
1.0 |
0.3 |
|
S75-4-1 |
25 |
75 |
4 |
1.0 |
0.3 |
|
S100-4-1 |
0 |
100 |
4 |
1.0 |
0.3 |
Note: S0-4-1 refers to a slag content of 0%, an alkali concentration of 4%, and an alkali activator modulus of 1.00.
2.2 Mix proportion
Based on the research results and experience of our research group in recent years on alkali-activated cementitious materials, the mix proportion of AAFS is shown in Table 2. Five groups of mix proportions were set according to different slag contents (0%, 25%, 50%, 75%, and 100%); four groups of mix proportions were set according to different Na2O concentrations (2%, 4%, 6%, and 8%); three different mix proportions were set according to different alkali activator moduli (0.5, 1.0, and 1.5, with a water-to-solid ratio of 0.3), controlled by adjusting the ratios of NaOH, NaSiO3, and water.
The alkali-activated mixing solution was prepared 24 hours in advance, to ensure it was thoroughly mixed and cooled to room temperature before use. For each mix proportion, eighteen 50mm×50mm×50mm cubic specimens were made for the cube compression experiment and microstructure detection, and three 40mm×40mm×160mm specimens were made for the drying shrinkage experiment.
2.3 Experimental design and performance testing
2.3.1 Specimen preparation
(1) Preparation: The alkali-activated mixing solution should be prepared at least 24 hours in advance to ensure it is thoroughly mixed and cooled to room temperature before use. Before preparing specimens, the molds must be cleaned to prevent contamination with other impurities. After cleaning, assemble the molds and apply oil on the inside to facilitate demolding later. The oil should be applied evenly to avoid excessive oil in some areas, which could accumulate at the bottom of the mold and affect the final shape of the specimen. For preparing 40mm×40mm×160mm specimens, install shrinkage measuring pins in the molds in advance.
(2) Weighing: Calculate the required amounts of each material according to the designed mix proportion and weigh them in advance for later use.
(3) First Mixing: Pour the weighed fly ash and slag into the mixing bowl and mix at a low speed to prevent the material from being flung out of the bowl due to excessive speed, causing inaccuracies in the amount used. Mix at a low speed for three minutes to ensure the materials are uniformly mixed.
(4) Second Mixing: After the materials are mixed uniformly, keep the mixer running at low speed and slowly pour the weighed alkali activator solution into the mixing bowl. After mixing at low speed for 1 minute, the material will change from a powdery state to gradually become sticky. Then, increase the mixer to high speed and mix for another minute before molding.
(5) Molding: Due to the characteristics of AAFS material, proceed with molding quickly to prevent the material from setting. After molding, place the mold on a vibrating table and vibrate 12-15 times before smoothing and covering with film. For the 40mm×40mm×160mm specimens, use manual vibration to prevent the pins from falling off. After vibrating and smoothing, cover with cling film.
(6) Numbering: After the specimens have been left to set for 24 hours, remove them from the molds and number them according to the set mix proportions. Clean and store the molds promptly after demolding for next use.
(7) Curing: Place the numbered specimens in a standard curing box (temperature = 20±2℃, relative humidity = 95±1%) for 21 days, followed by dry curing for 7 days.
2.3.2 Mass change test
Subject the 50mm×50mm×50mm cubic specimens to 21 days of standard curing, followed by 7 days of dry curing. Then, place the specimens in a high-temperature oven for temperature cycling tests, weighing specimens at 0, 30, 60, 90, 180, and 300 cycles to study the impact of temperature cycling on material mass loss rate.
2.3.3 Drying shrinkage test
After demolding the 40mm×40mm×160mm specimens, perform drying shrinkage tests. Before testing, assemble the comparator on a flat surface and calibrate using a 160mm standard rod, adjusting the dial indicator to zero. Clean the measuring pins on both ends of the demolded specimen, gently place them in the slots at the ends of the comparator to avoid impacting accuracy, and record the dial indicator reading. Test the shrinkage of specimens after curing for 1, 2, 3, 7, 14, and 28 days, and after undergoing thermal cycles (30, 60, 90, 180, and 300 times), repeating each measurement six times. The final test result is the arithmetic mean of six data sets.
Compressive Strength Test: Before testing, ensure there are no foreign objects on the upper and lower surfaces of the testing machine's loading platform and use sandpaper to smooth these surfaces. Also, check that the loading platform is parallel to the ground to avoid unnecessary impact on test data. After adjusting equipment parameters, place the specimen at the center of the loading platform to ensure even pressure distribution on its surfaces. Start the testing machine with a load applied at a constant rate of 1kN/s until the specimen reaches its load-bearing limit and stops loading, recording the peak strength. Clean the loading point before placing the next specimen and repeat the process. During the test, the specimen may fracture when it reaches its load-bearing limit, impacting the load-bearing platform and potentially causing it to tilt. In this case, adjust the platform to a level position. For each mix proportion, prepare three specimens, taking the arithmetic mean of the compressive strengths of these three specimens as the compressive strength of the specimens. The difference between the maximum and minimum compressive strengths and the median value should be within 15%. If the difference exceeds 15%, discard the outlier, and the result is the average of the remaining two specimens. If the differences between the maximum and minimum values and the median exceed 15%, the data set is void, and the test result is invalid.
Microstructural Examination: After crushing the specimens, cores are extracted by removing the outer layer of the specimen with a small hammer. Core samples, including block, flake, and powder samples, are then bagged for XRD, FT-IR, and SEM testing. For specimens not subjected to thermal cycling, isopropanol is added to the cores to prevent further hydration.
The drying shrinkage test refers to the JC/T 603-2004 Standard Test Method for Drying Shrinkage of Mortar, with three 40mm×40mm×160 mm specimens prepared for each mix proportion, and the test results are the average of three groups. The compressive strength test refers to JGJ/T 70-2009 Standard for Test Method of Performance on Building Mortar, with three 50mm×50mm×50mm specimens formed for each mix proportion, and the test strength results are the average of three groups. The specimens used for the mass loss experiment are consistent with those used for the compressive strength test, with mass change results being the average of three groups. Testing instruments and models include: mass change test (XMT-5000T high-temperature oven); drying shrinkage test (dual-column cement comparator with digital micrometer); compressive strength test (YAW-2000D electro-hydraulic servo universal testing machine); XRD (D8 ADVANCE X-ray diffractometer, Germany); FT-IR (Nicolet 6700 Fourier Transform Infrared Spectrometer); SEM (SU8020 field emission scanning electron microscope, Japan).
3.1 Mass loss rate
Table 3. Mass loss rate of AAFS under the influence of the number of thermal cycles in different slag content groups
|
Number of Thermal Cycles |
Mass Loss Rate (%) |
||||
|
S0-4-1 |
S25-4-1 |
S50-4-1 |
S75-4-1 |
S100-4-1 |
|
|
0 |
0 |
0 |
0 |
0 |
0 |
|
30 |
6.48 |
5.58 |
3.92 |
3.12 |
2.50 |
|
60 |
9.48 |
6.50 |
4.71 |
4.63 |
4.21 |
|
90 |
12.43 |
9.31 |
5.33 |
5.80 |
5.30 |
|
180 |
14.94 |
11.01 |
7.61 |
7.77 |
6.79 |
|
300 |
15.75 |
12.24 |
9.49 |
9.27 |
9.04 |
Table 4. Mass loss rate of AAFS under the influence of the number of thermal cycles in different alkali concentration groups
|
Number of Thermal Cycles |
Mass Loss Rate (%) |
|||
|
S50-2-1 |
S50-4-1 |
S50-6-1 |
S50-8-1 |
|
|
0 |
0 |
0 |
0 |
0 |
|
30 |
5.41 |
3.92 |
3.93 |
4.47 |
|
60 |
7.71 |
4.71 |
5.27 |
5.77 |
|
90 |
9.63 |
5.33 |
5.56 |
6.25 |
|
180 |
11.56 |
7.61 |
9.09 |
9.23 |
|
300 |
12.08 |
9.49 |
10.61 |
10.72 |
Table 5. Mass loss rate of AAFS in different modulus arrays under the influence of the number of thermal cycles
|
Number of Thermal Cycles |
Mass Loss Rate (%) |
||
|
S50-4-0.5 |
S50-4-1 |
S50-4-1.5 |
|
|
0 |
0 |
0 |
0 |
|
30 |
5.13 |
3.92 |
6.74 |
|
60 |
5.78 |
4.71 |
7.37 |
|
90 |
7.14 |
5.33 |
8.03 |
|
180 |
9.99 |
7.61 |
10.65 |
|
300 |
11.11 |
9.49 |
11.51 |
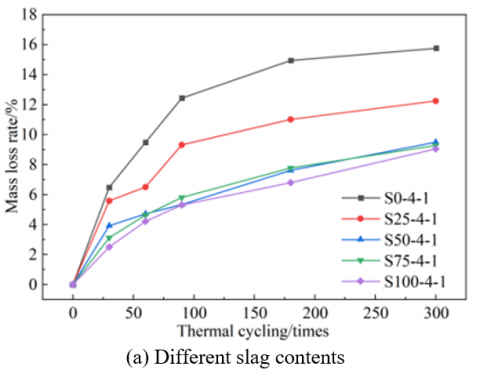
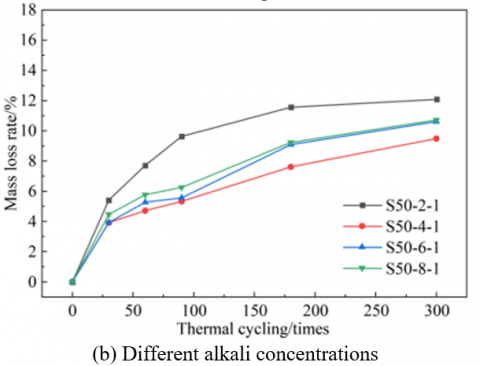
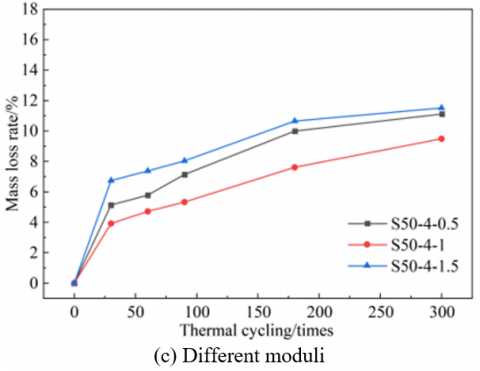
The corresponding data for the mass loss rate are shown in Tables 3-5. As shown in Figure 2, under the effect of thermal cycling damage, due to the continuous evaporation of free water and capillary water in the system during the heat treatment process and the decomposition of unstable gel phases [14], the mass loss rate of AAFS shows an increasing trend. As shown in Figure 2(a), the higher the slag content (0%, 25%, 50%, 75%, and 100%), the lower the mass loss rate of AAFS under thermal cycling, with rates of 15.75%, 12.24%, 9.49%, 9.27%, and 9.04%, respectively. The reduction in mass loss rate is fastest when the slag content is between 0-50%, and similar changes in mass loss rate are observed when the slag content exceeds 50%. As shown in Figure 2(b), the impact of Na2O concentration on the mass loss rate of AAFS is related to the level of alkali concentration, showing higher mass loss rates at both low and high concentrations, with rates of 12.08% and 10.72%, respectively, suggesting that the Na2O concentration in AAFS should be maintained within a reasonable range. As shown in Figure 2(c), the mass loss rates of AAFS specimens from highest to lowest are: S50-4-1.5 > S50-4-0.5 > S50-4-1, indicating that the mass loss rate of AAFS specimens first decreases and then increases with the increase in alkali activator modulus, reaching the lowest mass loss when the modulus is around 1.
Figure 2. AAFS mass loss rate under the influence of thermal cycling
3.2 Drying shrinkage characteristics
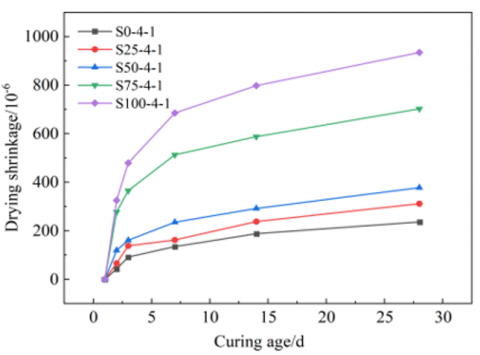
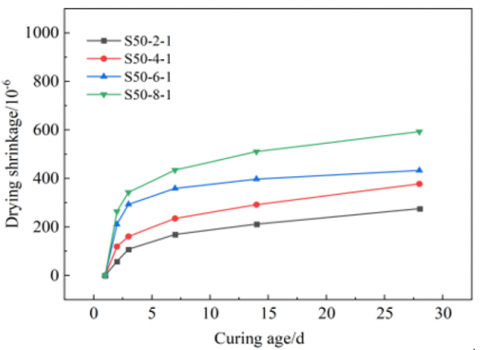
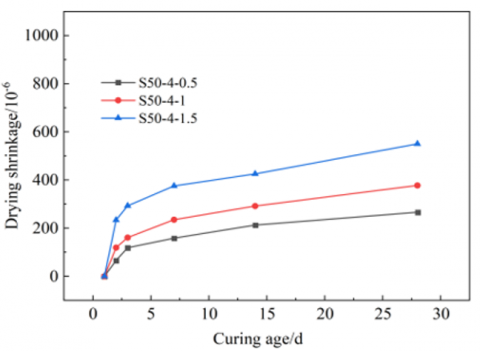
The drying shrinkage data of AAFS specimens in each group under the influence of curing age are shown in Tables 6-8. As shown in Figure 3, AAFS is an early-strength and rapid-setting material, where drying shrinkage is mostly developed in the early stages and only shows a slight increasing trend in the later stages, which is consistent with literature findings [15, 16]. With the increase in curing age, the drying shrinkage rate of AAFS shows an upward trend. As shown in Figure 3(a), with the increase in slag content (0%, 25%, 50%, 75%, and 100%), the drying shrinkage rate increases, respectively, to 236.11×10⁻⁶, 311.24×10⁻⁶, 377.08×10⁻⁶, 702.10×10⁻⁶, and 934.5×10⁻⁶. This is because slag can produce hydration products with a fine pore structure, increasing the proportion of pores in the system, leading to greater capillary stress internally and thus increasing the drying shrinkage of the structure [17, 18]; as shown in Figure 3(b), with the increase in alkali concentration (2%, 4%, 6%, and 8%), the drying shrinkage performance gradually strengthens, respectively, to 275.00×10⁻⁶, 377.08×10⁻⁶, 432.50×10⁻⁶, and 592.50×10⁻⁶. This is because the higher the alkali content, the higher the concentration of OH- ions, accelerating the polymerization reaction within the alkali-activated system and increasing the production of hydration products, which affects the system's drying shrinkage. Additionally, when the alkali content is too high, the surface tension of the pore solution increases, also affecting the system's shrinkage [19]. As shown in Figure 3(c), with the increase in alkali activator modulus (0.5, 1, and 1.5), the drying shrinkage performance is enhanced, respectively, to 265.63×10⁻⁶, 377.08×10⁻⁶, and 550.50×10⁻⁶. This is due to the reduction in porosity within the system with increasing alkali activator modulus, causing more severe shrinkage.
Table 6. Drying shrinkage rate of AAFS in different slag content groups under the influence of curing age
|
Curing Age (d) |
Drying Shrinkage Rate (10-6) |
||||
|
S0-4-1 |
S25-4-1 |
S50-4-1 |
S75-4-1 |
S100-4-1 |
|
|
1 |
0 |
0 |
0 |
0 |
0 |
|
2 |
42.54 |
65.63 |
118.75 |
277.08 |
325.00 |
|
3 |
91.25 |
137.50 |
160.42 |
365.00 |
479.00 |
|
7 |
134.33 |
161.70 |
234.65 |
512.50 |
685.00 |
|
14 |
187.62 |
237.50 |
291.67 |
587.50 |
797.50 |
|
28 |
236.11 |
311.24 |
377.08 |
702.10 |
934.50 |
Table 7. Drying shrinkage of AAFS in different alkali concentration groups under the influence of curing age
|
Curing Age (d) |
Drying Shrinkage Rate (10-6) |
|||
|
S50-2-1 |
S50-4-1 |
S50-6-1 |
S50-8-1 |
|
|
1 |
0 |
0 |
0 |
0 |
|
2 |
57.50 |
118.75 |
210.42 |
263.33 |
|
3 |
107.50 |
160.42 |
292.91 |
342.50 |
|
7 |
168.75 |
234.65 |
358.33 |
434.17 |
|
14 |
211.25 |
291.67 |
397.20 |
510.42 |
|
28 |
275.00 |
377.08 |
432.50 |
592.50 |
Table 8. Drying shrinkage of AAFS in different base modulus groups under the influence of curing age
|
Curing Age (d) |
Drying Shrinkage Rate (10-6) |
||
|
S50-4-0.5 |
S50-4-1 |
S50-4-1.5 |
|
|
1 |
0 |
0 |
0 |
|
2 |
65.63 |
118.75 |
233.33 |
|
3 |
118.13 |
160.42 |
292.50 |
|
7 |
158.13 |
234.65 |
375.00 |
|
14 |
212.50 |
291.67 |
425.00 |
|
28 |
265.63 |
377.08 |
550.00 |
(a) Different slag contents
(b) Different alkali concentrations
(c) Different moduli
Figure 3. Drying shrinkage curves of AAFS under the influence of curing age
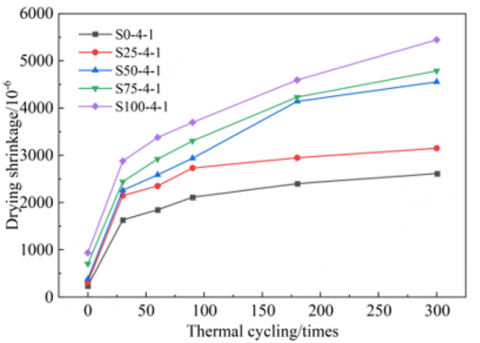
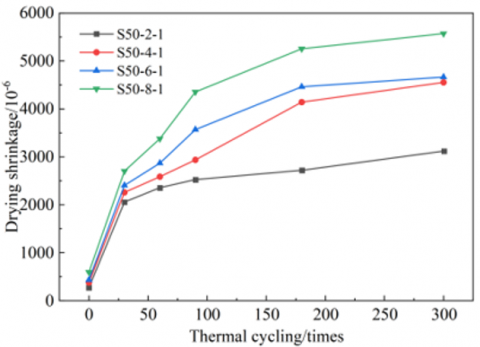
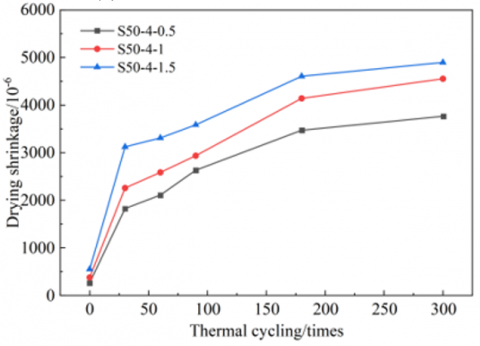
The drying shrinkage data of AAFS specimens in each group under the influence of thermal cycling are shown in Tables 9-11. As shown in Figure 4, due to changes in the C-A-S-H gel content within the AAFS system, the coarse pore structure formed by C-A-S-H gel at high temperatures has to some extent reduced the capillary pressure. Additionally, with an increase in the number of thermal cycles, significant evaporation of water occurs within the system, causing substantial shrinkage. The drying shrinkage rate increases most notably after 30 thermal cycles. Moreover, when the external temperature variation reaches 15~20℃, differences in thermal properties among the components within the system lead to internal stresses. Under the effect of these stresses, the specimens also experience shrinkage [20].
Table 9. Drying shrinkage of AAFS under the influence of the number of thermal cycles in different slag content groups
|
Number of Thermal Cycles |
Drying Shrinkage Rate (10-6) |
||||
|
S0-4-1 |
S25-4-1 |
S50-4-1 |
S75-4-1 |
S100-4-1 |
|
|
0 |
236.11 |
311.24 |
377.08 |
702.10 |
934.50 |
|
30 |
1632.40 |
2146.88 |
2258.33 |
2441.67 |
2877.08 |
|
60 |
1845.55 |
2350.00 |
2585.42 |
2920.83 |
3377.08 |
|
90 |
2111.78 |
2731.25 |
2935.42 |
3304.17 |
3695.83 |
|
180 |
2399.71 |
2946.88 |
4141.67 |
4231.25 |
4593.75 |
|
300 |
2613.44 |
3150.00 |
4554.17 |
4787.50 |
5445.83 |
Table 10. Drying shrinkage of AAFS under the influence of the number of heat cycles in different alkali concentration groups
|
Number of Thermal Cycles |
Drying Shrinkage Rate (10-6) |
|||
|
S50-2-1 |
S50-4-1 |
S50-6-1 |
S50-8-1 |
|
|
0 |
275.00 |
377.08 |
432.50 |
592.50 |
|
30 |
2056.25 |
2258.33 |
2404.17 |
2702.08 |
|
60 |
2356.25 |
2585.42 |
2868.75 |
3379.17 |
|
90 |
2525.00 |
2935.42 |
3568.75 |
4354.47 |
|
180 |
2718.75 |
4141.67 |
4462.50 |
5256.25 |
|
300 |
3118.75 |
4554.17 |
4664.58 |
5572.90 |
Table 11. Drying shrinkage of AAFS in different modulus groups under the influence of the number of thermal cycles
|
Number of Thermal Cycles |
Drying Shrinkage Rate (10-6) |
||
|
S50-4-0.5 |
S50-4-1 |
S50-4-1.5 |
|
|
0 |
265.63 |
377.08 |
550.00 |
|
30 |
1825.00 |
2258.33 |
3122.92 |
|
60 |
2109.38 |
2585.42 |
3310.42 |
|
90 |
2631.25 |
2935.42 |
3585.42 |
|
180 |
3471.88 |
4141.67 |
4606.25 |
|
300 |
3765.63 |
4554.17 |
4897.92 |
(a) Different slag contents
(b) Different alkali concentrations
(c) Different moduli
Figure 4. Drying shrinkage curves of AAFS under the influence of thermal cycling
3.3 Compressive strength
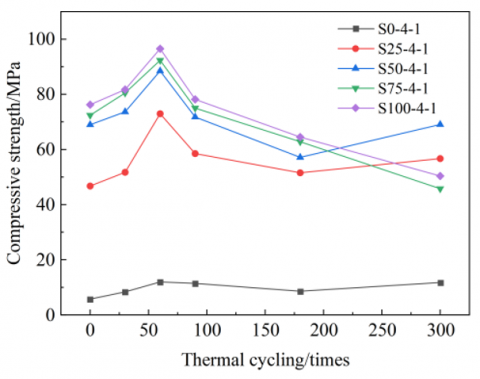
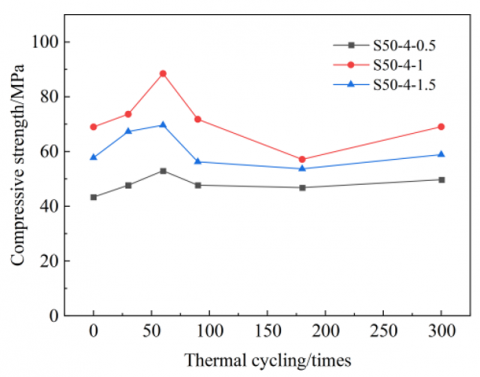
The compressive strength data of each group of AAFS specimens under the influence of thermal cycling are shown in Tables 12-14. As shown in Figure 5(a), when the number of thermal cycles is 0, the compressive strength of AAFS increases by 716.78%, 1105.59%, 1165.73%, and 1232.87% with the increase in slag content (25%, 50%, 75%, and 100%), respectively. The growth rate of AAFS's compressive strength is highest when the slag content ranges from 0% to 50%. With the continued increase in slag content, the growth rate of compressive strength significantly decreases [21, 22], indicating that the contribution of slag to compressive strength gradually reaches saturation. This suggests that adding slag positively affects the compressive strength of AAFS. The introduction of thermal cycling promotes the rehydration process of AAFS, filling its internal microstructural pores with hydration products and increasing the matrix density [23], thereby making the structure denser and increasing its compressive strength. The compressive strength of AAFS reaches its peak at the 60th thermal cycle, with increases of 109.09%, 56.16%, 28.31%, 27.51%, and 26.60%, respectively. It can be observed that under the effect of thermal cycling, the increase in compressive strength of AAFS gradually decreases with the increase in slag content. Subsequently, as the number of thermal cycles increases, the microstructure of the gel matrix is damaged, and the material strength decreases, showing an overall downward trend in compressive strength. When the slag content is less than 50%, the compressive strength of AAFS slightly fluctuates with the number of thermal cycles; when the slag content exceeds 50%, high temperatures cause water evaporation between slag particles, reducing the connectivity between slag particles, and the compressive strength gradually and steadily decreases with the increase in the number of thermal cycles.
Table 12. Compressive strength of AAFS in different slag content groups under the influence of the number of thermal cycles
|
Number of Thermal Cycles |
Compressive Strength (MPa) |
||||
|
S0-4-1 |
S25-4-1 |
S50-4-1 |
S75-4-1 |
S100-4-1 |
|
|
0 |
5.72 |
46.72 |
68.96 |
72.4 |
76.24 |
|
30 |
8.33 |
51.72 |
73.64 |
80.48 |
81.72 |
|
60 |
11.96 |
72.96 |
88.48 |
92.32 |
96.52 |
|
90 |
11.43 |
58.49 |
71.76 |
75 |
78.16 |
|
180 |
8.58 |
51.52 |
57.12 |
62.8 |
64.48 |
|
300 |
11.73 |
56.67 |
69.04 |
45.76 |
50.36 |
Table 13. Compressive strength of AAFS under the influence of the number of thermal cycles in different alkali concentration groups
|
Number of Thermal Cycles |
Compressive Strength (MPa) |
|||
|
S50-2-1 |
S50-4-1 |
S50-6-1 |
S50-8-1 |
|
|
0 |
16.1 |
68.96 |
76.35 |
53.08 |
|
30 |
18.32 |
73.64 |
88.32 |
64.08 |
|
60 |
27.81 |
88.48 |
92.32 |
72.12 |
|
90 |
23.46 |
71.76 |
73.44 |
52.8 |
|
180 |
21.86 |
57.12 |
67.61 |
50.56 |
|
300 |
26.66 |
69.04 |
74.16 |
47.12 |
Table 14. Compressive strength of AAFS with different modulus groups under the influence of the number of thermal cycles
|
Number of Thermal Cycles |
Compressive Strength (MPa) |
||
|
S50-4-0.5 |
S50-4-1 |
S50-4-1.5 |
|
|
0 |
43.35 |
68.96 |
57.72 |
|
30 |
47.68 |
73.64 |
67.28 |
|
60 |
52.96 |
88.48 |
69.64 |
|
90 |
47.69 |
71.76 |
56.24 |
|
180 |
46.8 |
57.12 |
53.68 |
|
300 |
49.72 |
69.04 |
58.87 |
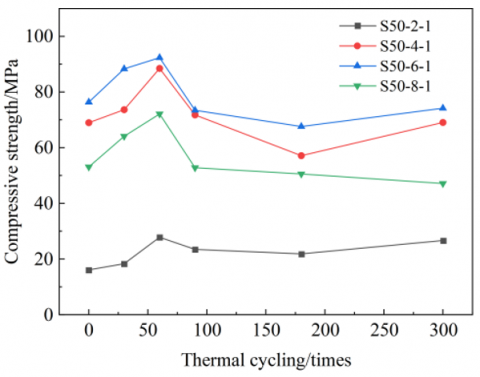
As shown in Figure 5(b), when the number of thermal cycles is 0, the compressive strength of AAFS increases with the Na2O concentration (2%, 4%, 6%, and 8%), showing strengths of 16.10, 68.96, 76.35, and 56.08 MPa, respectively. As the Na2O concentration increases, the concentration of OH- in the system also increases, under which conditions Al-O and Si-O bonds are highly susceptible to breaking, forming [SiO4]4- and [AlO4]5- tetrahedral ions. These ions combine with metal cations produced during hydration to form gel phases, filling the gaps between particles, enhancing the degree of hydration polymerization, promoting the hydration reaction, and generating more hydration gel to fill internal voids, thereby making the structure denser and improving the compressive strength. With the continuous increase in alkali concentration, the rate of formation of hydration products becomes too fast to diffuse adequately, and metal cations form a passivation film on the surface of fly ash spheres, hindering the dissolution rate of fly ash and slag, thus causing a decrease in compressive strength. After 60 thermal cycles, the compressive strength of all AAFS samples reaches its peak, increasing by 35.47%, 28.31%, 20.91%, and 35.87%, respectively, before gradually decreasing and stabilizing. In the later stages of thermal cycling, the compressive strength of the 8% Na2O samples continues to decrease, indicating that when the Na2O content is too high, the thermal resistance of AAFS decreases, making it unsuitable for use as a heat-resistant material.
(a) Different slag contents
(b) Different Na2O concentrations
(c) Different alkali activator moduli
Figure 5. Compressive strength of AAFS under the influence of thermal cycling
As shown in Figure 5(c), when the number of thermal cycles is 0, the compressive strength of AAFS increases with the alkali activator modulus (0.5, 1.0, and 1.5) to 43.35, 68.96, and 57.75 MPa, respectively. At an alkali activator modulus below 1.0, although a large amount of OH- promotes the decomposition of sodium silicate slag, the limited supply of [SiO4]4- from the silicate activator turns dual activation into single activation, leading to reduced compressive strength. When the activator modulus is too high, the limited number of OH- ions makes it difficult to activate the decomposition of slag sodium silicate, and the high concentration of [SiO4]4- increases its own degree of polymerization, causing a reduction in the strength of the alkali-activated slag cementitious materials. After 60 thermal cycles, the compressive strength of all samples reaches its peak at 52.96, 88.48, and 69.64 MPa, respectively, then gradually decreases, showing a slight increase after 180 cycles before stabilizing.
Through these three sets of experiments, it is evident that under any circumstances, the compressive strength of AAFS reaches its maximum value after 60 thermal cycles.
3.4 XRD spectra
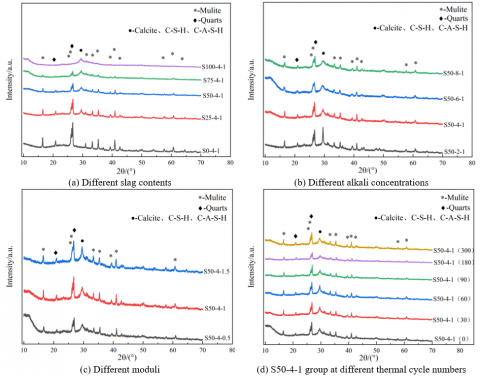
Figure 6 presents the XRD spectra of AAFS samples after 300 thermal cycles, with variations in thermal cycle number, slag content, alkali concentration, and alkali activator modulus. The main diffraction peaks observed in the spectra are those of quartz, calcite, and mullite phases.
Figure 6. XRD spectra of AAFS under different conditions
As the slag content in AAFS increases, the diffraction peaks of mullite and quartz weaken. A broad, diffuse peak appears between 2θ=25°~30°, and its intensity increases with the slag content. This diffuse peak is related to the formation of calcite on the sample surface due to carbonation and may also be due to the formation of C-S-H and C-A-S-H gels. The presence of Ca in C-S-H gel accelerates the dissolution of Si and Al in slag and fly ash, gradually forming C-A-S-H gel in the reaction system, ultimately resulting in the coexistence of C-S-H and C-A-S-H gels. This phenomenon makes the AAFS structure denser, and from the analysis of compressive strength tests, it is evident that C-S-H and C-A-S-H gels significantly enhance the structure's strength. The increase in alkali concentration does not produce new phases. When the alkali content is at 2%, the peaks of C-A-S-H, C-S-H gels, and calcite phases are highest, indicating that a lower alkali concentration does not fully activate the slag's reactivity. With an increase in alkali concentration, these peaks show a trend of declining and widening, while the peaks corresponding to mullite and quartz phases become dominant. With a decrease in alkali activator modulus, the diffraction peaks corresponding to quartz and mullite phases decrease, as a lower modulus means a higher concentration of OH- ions in the solution, accelerating the dissolution of Si and Al, making the polymerization reaction in the system more complete and reducing unreacted crystalline materials. With an increase in the number of thermal cycles, no new phases appear in the system, but the peaks corresponding to C-A-S-H, C-S-H gels, and calcite phases show a trend of first increasing, then decreasing, and increasing again. This trend aligns with the results from the compressive strength tests of the S50-4-1 group, indicating a close relationship between the content of C-A-S-H, C-S-H gels, and calcite phases and the compressive strength of AAFS samples.
3.5 SEM images
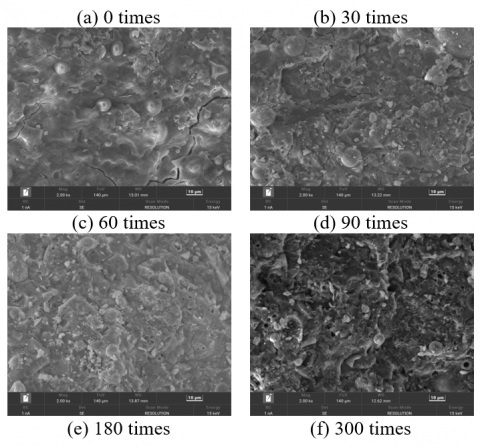
As shown in Figure 7, the AAFS samples produce a large amount of gel material after the hydration reaction, making the structure denser. However, significant cracks appear after thermal cycling, reducing the material's mechanical properties. This is because the structure undergoes dehydration after being heated to high temperatures, and some fly ash spherical particles have uneven surfaces, indicating that these parts of fly ash have participated in the hydration reaction. After 60 thermal cycles, the gel gradually adheres to the surface of the fly ash spherical particles, enveloping the particles. The gel's adhesive force tightly binds the particles together, mainly due to alkali silicate crystals, which are the main reason for the material's strength formation. With an increase in the number of thermal cycles, numerous pores appear, corresponding to the development of compressive strength. Compared with samples that have not undergone heat treatment, as the number of thermal cycles increases, the flocculent material inside the samples noticeably decreases, which is due to the decomposition or reorganization of flocculent substances during the heat treatment process; while the number of blocky particles significantly increases, caused by excessive dehydration of the structure, leading to the condensation of hydration products into particles and creating many pores on the surface.
Figure 7. SEM images of S50-4-1 group AAFS specimens under the influence of different thermal fatigue times
3.6 FT-IR characterization of AAFS
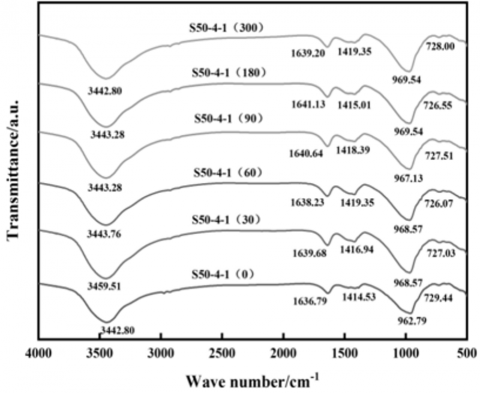
Figure 8 shows the FT-IR spectra of AAFS samples from the S50-4-1 group at different thermal cycle numbers. The wavenumber near 730 cm-1 is attributed to the stretching vibrations of Si-O-Si. The wavenumber near 950 cm-1 represents the formation of C-A-S-H gel, while the absorption peak near 962 cm-1 corresponds to the characteristic peak of C-S-H gel [24]. The wavenumber near 990 cm-1 is attributed to the asymmetric stretching vibrations of Si-O-T bonds. The wavenumbers of C-A-S-H and N-A-S-H are 950 cm-1 and 1050 cm-1, respectively. The wavenumbers between 950 cm-1 and 1050 cm-1 represent the formation of different gel products; if the wavenumber is closer to 950 cm-1, it indicates the formation of more C-A-S-H gel, and if closer to 1050 cm-1, it means more N-A-S-H gel is produced. The wavenumber near 1400 cm-1 is related to the vibrations of the O-C-O bond in carbonates, while the wavenumbers near 1640 cm-1 and 3445 cm-1 are related to the physical and chemical combined water in the hydration products, representing the stretching and bending vibrations of -OH and H-O-H, respectively. The peaks of -OH and H-O-H first increase and then decrease with an increase in the number of thermal cycles, indicating that the AAFS system produces water-rich gel after heat treatment, but with further increases in thermal cycles, the free water within these gels evaporates and decomposes. The peak of C-S-H gel shows a trend of initially increasing, then decreasing, and increasing again with the number of thermal cycles, indicating that the gel phase products in the system change during the heat treatment process, which affects the compressive strength of the samples. This aligns with the results of compressive strength tests and analyses, and combined with the XRD spectra, it is known that the gel phase products correspond to C-S-H and C-A-S-H gels.
Figure 8. FT-IR images of the S50-4-1 group of AAFS specimens under the influence of different thermal cycles
(1) Between 0-60 thermal cycles, the growth in mass loss rate, drying shrinkage characteristics, and compressive strength of AAFS under various slag contents, alkali concentrations, and moduli is most significant, with the highest compressive strength of AAFS observed at 60 thermal cycles. With an increase in the number of thermal cycles, aside from compressive strength, the growth rate of mass loss rate and drying shrinkage characteristics decreases.
(2) The impact of thermal cycling on the compressive strength of AAFS with different slag contents, alkali concentrations, and moduli shows a non-symmetric normal distribution, peaking at 60 thermal cycles. Afterward, the compressive strength of AAFS with slag content <50% decreases and then fluctuates, while the compressive strength of AAFS with slag content >50% steadily declines. The compressive strength of AAFS with different alkali concentrations and moduli gradually decreases after 60 thermal cycles, slightly increases after 180 cycles, and then stabilizes.
(3) Increasing slag content (25%, 50%, 75%, and 100%) is beneficial to the compressive strength of AAFS, showing a positive correlation, with compressive strength increasing by 716.78%, 1105.59%, 1165.73%, and 1232.87%, respectively. Both higher and lower alkali concentrations are detrimental to the compressive strength of AAFS, with the compressive strength reaching its peak at an alkali concentration of 6%. The highest compressive strength is achieved when the alkali activator modulus is at 1.0, influenced by the nature of the alkali activation.
(4) The hydration products of AAFS mainly include C-S-H gel, N-A-S-H gel, C-A-S-H gel, mullite crystals, and quartz crystals. The material's compressive strength is closely related to the content of C-S-H and C-A-S-H gel phases in the system. Thermal cycling causes changes in the content of C-S-H and C-A-S-H gel phases, thus affecting the material's compressive strength. Additionally, thermal cycling leads to an increase in cracks and pores within the AAFS system and continuous evaporation of free water and capillary water during the heat treatment process, thereby adversely affecting the material's mass loss and shrinkage characteristics.
Considering the experimental results and taking into account economic and practical aspects, it is recommended to use AAFS combinations with a slag content not exceeding 50%, an alkali concentration of 6%, and an alkali modulus of 1.0.
[1] Schneider, M., Romer, M., Tschudin, M., Bolio, H. (2011). Sustainable cement production—Present and future. Cement and Concrete Research, 41(7): 642-650. https://doi.org/10.1016/j.cemconres.2011.03.019
[2] Wu, Y., Lu, B., Bai, T., et al. (2019). Geopolymer, green alkali activated cementitious material: Synthesis, applications and challenges. Construction and Building Materials, 224: 930-949. https://doi.org/10.1016/j.conbuildmat.2019.07.112
[3] Ma, H., Yi, C., Chen, H., Shi, J., Li, W., Guo, Y. (2018). Property and cementation mechanism of alkali-activated coal gangue-slag cementitious materials. Chinese Journal of Materials Research, 32(12): 898-904. https://doi.org/10.11901/1005.3093.2018.355
[4] Duxson, P., Provis, J.L., Lukey, G.C., Van Deventer, J.S. (2007). The role of inorganic polymer technology in the development of ‘green concrete’. Cement and Concrete Research, 37(12): 1590-1597. https://doi.org/10.1016/j.cemconres.2007.08.018
[5] Yang, B., Sheng, B., Wang, J., Fang, T., Luo, Y., Jia, Y. (2017). Study on the influence of fly ash and slag on the strength of concrete in the case of single and multiple mixing. Journal of China & Foreign Highway, 2017, 37(3): 212-215. https://doi.org/10.14048/j.issn.1671-2579.2017.03.047
[6] Li, S., Liu, Q., Xiao., Du, L., Zeng, R., Peng, J., Li, F. (2023). Study on the autogenous shrinkage of metakaolin modified alkali-activated slag cement. Non-metallic Mines, 46(1): 91-94. https://doi.org/10.3969/j.issn.1000-8098.2023.01.022
[7] Bernal, S., De Gutierrez, R., Delvasto, S., Rodriguez, E. (2010). Performance of an alkali-activated slag concrete reinforced with steel fibers. Construction and building Materials, 24(2): 208-214. https://doi.org/10.1016/j.conbuildmat.2007.10.027
[8] Tran, T.T., Kang, H., Kwon, H.M. (2019). Effect of heat curing method on the mechanical strength of alkali-activated slag mortar after high-temperature exposure. Materials, 12(11): 1789. https://doi.org/10.3390/ma12111789
[9] Zheng, W., Chen, H., Wang, Y. (2009). High-temperature resistance performance of alkali-activated slag cementitious materials. Journal of Huazhong University of Science and Technology (Natural Science Edition), 37(10): 96-99. https://doi.org/10.13245/j.hust.2009.10.014
[10] Singh, G.B., Subramaniam, K.V. (2019). Influence of processing temperature on the reaction product and strength gain in alkali-activated fly ash. Cement and Concrete Composites, 95: 10-18. https://doi.org/10.1016/j.cemconcomp.2018.10.010
[11] Pan, Z., Tao, Z., Cao, Y.F., Wuhrer, R., Murphy, T. (2018). Compressive strength and microstructure of alkali-activated fly ash/slag binders at high temperature. Cement and Concrete Composites, 86: 9-18. https://doi.org/10.1016/j.cemconcomp.2017.09.011
[12] Chen, W., Li, B., Guo, M.Z., Wang, J., Chen, Y.T. (2023). Impact of heat curing regime on the compressive strength and drying shrinkage of alkali-activated slag mortar. Developments in the Built Environment, 14: 100123. https://doi.org/10.1016/j.dibe.2023.100123
[13] Huang, H., An, M., Wang, Y., Yu, Z., Ji, W. (2019). Effect of environmental thermal fatigue on concrete performance based on mesostructural and microstructural analyses. Construction and Building Materials, 207: 450-462. https://doi.org/10.1016/j.conbuildmat.2019.02.072
[14] Ma, Q., Guo, R., Zhao, Z., Lin, Z., He, K. (2015). Mechanical properties of concrete at high temperature—A review. Construction and Building Materials, 93: 371-383. https://doi.org/10.1016/j.conbuildmat.2015.05.131
[15] Deb, P.S., Nath, P., Sarker, P.K. (2015). Drying shrinkage of slag blended fly ash geopolymer concrete cured at room temperature. Procedia Engineering, 125: 594-600. https://doi.org/10.1016/j.proeng.2015.11.066
[16] Ling, Y., Wang, K., Fu, C. (2019). Shrinkage behavior of fly ash based geopolymer pastes with and without shrinkage reducing admixture. Cement and Concrete Composites, 98: 74-82. https://doi.org/10.1016/j.cemconcomp.2019.02.007
[17] Thomas, R. J., Lezama, D., Peethamparan, S. (2017). On drying shrinkage in alkali-activated concrete: Improving dimensional stability by aging or heat-curing. Cement and Concrete Research, 91: 13-23. https://doi.org/10.1016/j.cemconres.2016.10.003
[18] Shi, M., Ke, G., Zou, P., Song, B., Tang, X., Jin, D. (2022). Research progress of hydration, mechanical and dry shrinkage properties of alkali-activated slag cement. Bulletin of the Chinese Ceramic Society, 41(1): 162-173. https://doi.org/10.16552/j.cnki.issn1001-1625.2022.01.028
[19] Kumarappa, D. B., Peethamparan, S., Ngami, M. (2018). Autogenous shrinkage of alkali activated slag mortars: Basic mechanisms and mitigation methods. Cement and Concrete Research, 109: 1-9. https://doi.org/10.1016/j.cemconres.2018.04.004
[20] Fan, Y. (2010). An experimental study of the thermal-stress-caused surface cracking in concrete. Traffic Engineering and Technology for National Defense, 8(3): 25-27. https://doi.org/10.13219/j.gjgyat.2010.03.017
[21] Puertas, F., Martı́nez-Ramı́rez, S., Alonso, S., Vázquez, T. (2000). Alkali-activated fly ash/slag cements: Strength behaviour and hydration products. Cement and Concrete Research, 30(10): 1625-1632. https://doi.org/10.1016/S0008-8846(00)00298-2
[22] Fang, G., Ho, W. K., Tu, W., Zhang, M. (2018). Workability and mechanical properties of alkali-activated fly ash-slag concrete cured at ambient temperature. Construction and Building Materials, 172: 476-487. https://doi.org/10.1016/j.conbuildmat.2018.04.008
[23] Granger, S., Loukili, A., Pijaudier-Cabot, G., Chanvillard, G. (2007). Experimental characterization of the self-healing of cracks in an ultra high performance cementitious material: Mechanical tests and acoustic emission analysis. Cement and Concrete Research, 37(4): 519-527. https://doi.org/10.1016/j.cemconres.2006.12.005
[24] Richard, T., Mercury, L., Poulet, F., d'Hendecourt, L. (2006). Diffuse reflectance infrared Fourier transform spectroscopy as a tool to characterise water in adsorption/confinement situations. Journal of Colloid and Interface Science, 304(1): 125-136. https://doi.org/10.1016/j.jcis.2006.08.036