Johnny Henrry Ccatamayo Barrios*![]() | Luis Miguel Soto Jusacamayta
| Luis Miguel Soto Jusacamayta![]() | Kelvis Berrocal Argumedo
| Kelvis Berrocal Argumedo![]() | Jaime Cesar Mayorga Rojas
| Jaime Cesar Mayorga Rojas![]() | Walter Javier Díaz Cartagena
| Walter Javier Díaz Cartagena![]() | Roberto-Juan Gutiérrez Palomino
| Roberto-Juan Gutiérrez Palomino![]() | H. David Calderón Vilca
| H. David Calderón Vilca![]()
© 2024 The authors. This article is published by IIETA and is licensed under the CC BY 4.0 license (http://creativecommons.org/licenses/by/4.0/).
OPEN ACCESS
In this research, 10 formats are proposed as a single instrument, for taking mining cycle times based on the principles of the value chain map tool. As part of the methodology, we applied the 10 proposed formats in time recording, we analyzed the productive, contributory and non-contributory times, for this we used the Ishikawa diagram that shows us which activities have the greatest impact on low productivity in the horizontal excavations (Mining Cycle) later the mapping of the current state was carried out, finally the time efficiency was processed and calculated. To validate the results, we applied the proposal in the Esmeralda mining company, in its El Teniente mine for 4 months. As a result, we revealed that from a total cycle time of 22.85 hours: the productive time was 13.22 hours, the Contributory time was 4.53 hours and non-contributory time was 5.11 hours. We also revealed that the activities that show the lowest performance are: ventilation, marine loading, coining and drilling. The final conclusion is based on the contribution of the 10 formats and is applicable to underground mining companies who can use the 10 proposed formats to analyze productive, contributory and non-contributory times, and then take corresponding actions.
mining cycle; productivity; performance; value stream mapping, current phase
The mining industry plays a crucial role in the extraction of minerals and natural resources essential to society [1]. In the context of subway mining operations, it is critical to understand and successfully manage productive times (PT), contributory times (CT) and non-contributory times (NCT). These times represent an integral part of the efficiency and profitability of any mining operation and have a direct impact on mine productivity, safety and profitability [2]. Each time is detailed as follows.
Effective management of these three types of time is essential to optimize efficiency and ensure safety in subway mining operations.
The application of lean tools is very favorable for organizations, be it productive, commercial or service organizations, since it adjusts to the type of economic activity; it also has easy to understand tools such as; takt time, 5S, Eight wastes, Visual control or management at first sight, Manufacturing Cells, Poka Yoke, Jidoka, Intelligent automation such as, Kaisen, Kanban, SMED, Heijunka TPM or total productive maintenance [3, 4]. However, the Value Stream Mapping (VSM) tool presents significant advantages for evaluating the efficiency of the mining cycle compared to other lean tools. Its ability to offer a comprehensive view of the mining process, identify specific waste, focus on customer value and encourage continuous improvement make it a solid choice. By providing a detailed visual representation of the value stream and encouraging collaboration between teams, VSM is positioned as an effective tool to address the complexities of the mining sector and optimize its operations because the methodology processes are simple. Therefore, in this study “Value Stream Mapping”.
Thus, the Value Stream Mapping (VSM) tool is presented as the appropriate option to establish the real conditions in mining, since it is a good tool to analyze and improve processes in a wide range of industries, allowing a detailed evaluation of production times and the identification of areas for improvement, considering that the optimization of the use of resources is a matter of great importance in the industry in general, being even more demanding in mining and construction [5-7].
The VSM allows a clear and detailed visualization of the production stages and processes involved in the generation of value, which helps to identify areas for improvement and opportunities to increase productivity and reduce production time and costs [8].
On the implementation of lean to improve production times in mining, there are reported cases of implementation in mining development projects [9]. Therefore, this sector is identified as the area that presents the greatest potential for lean implementation in the mining industry through the determination of mining cycle times.
Thus, in the mining industry, the study [10] is analyzed, where a subway mining development project was selected and implemented lean in tunnel excavation works, specifically in the levels of production, sinking, intermediate transport, ventilation and crushing. This implementation was divided into three stages: diagnosis, implementation and control. After analyzing the results of this research, we can indicate that the implementation of lean methods in subway mining development projects in execution has a positive impact on their performance. In particular, the results of this research indicate that the implementation of lean methodologies significantly improve the mean values. On the other hand, the results indicated that the implementation of lean methodologies produces a statistically significant reduction in variability in project performance. Although the results of this application were positive, there are some limitations. Therefore, the addition of other indicators could be considered, such as the behavior of the system in the blasting process, which generates impacts on all the activities of the mining cycle that would allow establishing results of greater impact.
Seifullina et al. [9] analyze a fluorspar mining company of the Votorantim Group, where the mapping of the productive process was performed using TPS concepts and techniques. They indicated that drilling and blasting (together form 45%) are considered essential operations. Preparation (14%) consists of connecting compressed air hoses, among other activities, and is considered an auxiliary operation.
Drill bit sharpening (<1%), change of clothes (2%), travel (10%) and lunch time (5%) are also considered auxiliary operations. Rest time (8%) is an auxiliary operation as it relieves miner fatigue, but is not directly critical to performing the primary operation. Useless operations include waiting (14%) and ventilation (1%), which make up 15% of the operating time performed. It was found that essential drilling and blasting operations were performed individually by the same driller who was responsible for sharpening drill bits and retrieving explosives. This generated downtime of the drilling rig while the driller performed the auxiliary tasks [9].
On the other hand, Lööw [11] presented their research the practice of lean production in mining, where they used idea translation theory. The purpose of their research was to detail how the mining industry has implemented and practiced lean production. The findings suggest that the form and extent of lean production in mining differs from other industries due to the characteristics of the industry. However, there are still blind spots related to the practice that is not reported in the type of material investigated.
Reviewing in the case of the mining company Codelco in the El Teniente Division in the Esmeralda mine regarding mining productivity by applying lean tools, as a result they had not been meeting the expected production, generating low productivity in the activities of the mining cycle, so, they hired the company Green Ingenieria & Consultoria Limitada in 2018, who diagnosed the three main problems that generated delays for the compliance of the effective hours in posture of the mining cycle; being the main activities: equipment handling, manpower and reportability in the mining cycle, directly affecting the 6.3 hrs of work available in posture per shift [12] as a consequence the specialized company has detected that the effective working times in posture per shift are only 4.94 hrs, affecting 21.5% of available work in posture per shift [13] From this previous information, we conducted a study based on interference management, process management and reportability.
The objective of the research is to propose 10 formats based on the principles of the Value Stream Mapping tool: (1) Family of products, (2) Diagram of the current state to determine the efficiency of times in horizontal mining excavations, these formats allow determining the unproductive times or activities in the mining cycle of in a subway mine.
With the proposal, it is possible to identify unproductive times in the mining cycle, the formats lead to a more efficient allocation of available resources. Moreover, operational efficiency is closely linked to cost reduction. The identification and elimination of unproductive times in horizontal mining excavations can contribute significantly to the reduction of operating expenses. All this helps to optimize mining cycle times, allowing more activities to be performed in the same period, which translates into increased productivity and production.
In this context, we will explore in detail how to identify, measure and improve productive times (PT), contributory times (CT) and non-contributory times (NCT) in a subway mine.
This research focuses on the application of the lean philosophy, specifically using its "Value Stream Mapping" (VSM) tool as it allows to evaluate and optimize the productive times in horizontal mining excavations.
Proposal of 10 formats for time taking in mining cycle activities.
The methodology used in this study for the development of 10 formats for data collection was carried out through the following steps:
Comprehensive analysis of the mining cycle: A detailed study of each stage of the mining process was carried out to identify critical areas, such as operation times, material consumption and operational interferences.
Interdisciplinary collaboration: A multidisciplinary team was formed with mining experts, process engineers and other professionals, integrating diverse perspectives and specialized knowledge in the development of the formats.
Review of best practices and lessons learned: Previous projects were reviewed and best practices in data collection in the mining industry were analyzed to avoid common mistakes and take advantage of lessons learned.
Design of clear and concise formats: Clear and easy-to-complete formats were designed, with specific fields to capture relevant information and guarantee the consistency and accuracy of the data.
Iteration and feedback: An iterative review and feedback process was carried out, where the formats were tested and refined in the field with feedback from users, ensuring their practical usefulness and effectiveness in the field.
Therefore, the final product, the 10 proposed formats, allow the objective of the research to be efficiently addressed.
To apply the proposal of the 10 formats inspired by the Lean methodology in the mining industry in horizontal excavations, (1) Family of products, (2) Diagram of the current state, during the months of August to February 2021, have been considered. The chosen study location was in Chile, Codelco, El Teniente Division, Esmeralda mine-Block Caving exploitation method at the production level, 100 meters from the horizontal excavations, from the Mine Works Management in mining preparation.
2.1 Stage 1 product family
In the development of this proposal adapted to the mining cycle of horizontal excavations, in order to identify the family of products that are subject to evaluation, we propose to carry out the following activities:
In order to execute the procedures (A, B, C and D), it is important to establish which are the activities that correspond to a mining cycle, as well as the units in which they should be measured, which will be the family of products to be studied.
After having identified the family to be mapped, we proceed to collect all the necessary data to carry out the research, in this case these data correspond to the times of the activities of the mining cycle, this allows us to design the current Value Stream Map.
For this purpose, formats have been proposed, whose contents represent in numbers the activities that are executed to achieve the development of an activity, among which are the activities that generate productive times (PT), contributory times (CT) and non-contributory times (NCT), subsequently in each card the itens (a, b, c) of the percentage of productive times (PT), contributory times (CT) and non-contributory times (NCT) are calculated, in each activity respectively.
This process is composed of a set of activities that follow an orderly, sequential and correlational process that is fulfilled in all the executions of a mining cycle of mining in general, its order goes as follows: ventilation, marine removal, wedging, fortification drilling, bolt grouting, mesh installation, spinning, shotcrete casting, face drilling and explosives loading, from which the productive times (PT), contributory times (CT) and non-contributory times (NCT) times will be calculated.
The time taking formats for each activity require careful measurement to identify the productive, contributory and non-contributory phases, since a series of procedures are carried out for the execution of each activity, such as inspection of the work area, compliance with checklists, crane entry, isolation of the work area, equipment transfer, installation and removal, which are the procedures that generate the contributory times for each activity. On the other hand, the execution of the activity itself represents the net productive time and, added to this, non-contributory times are produced, which represent opportunities for improvement, for which Tables 1-9 are presented as a proposal.
Table 1. Proposed format for time recording in the ventilation activity
|
Ventilation Emerald Mine Sinking Level and Production-Times in Seconds [s] |
||||
|
N° |
Description |
Take 01 |
Take 02 |
Take N |
|
Activity Start time |
||||
|
Activity End time |
||||
|
1 |
Evaluation of the area to be worked on |
|||
|
2 |
Enabling the work area |
|||
|
3 |
Confinement of the area |
|||
|
4 |
Registration Check list |
|||
|
5 |
Installation of the ventilation duct with crane at 30m from the front of the posture |
|||
|
6 |
Turn on and check the ventilation sleeve |
|||
|
7 |
Gas Level Verification |
|||
|
8 |
Remove Crane |
|||
|
a |
Productive Times |
|||
|
b |
Contributory Times |
|||
|
c |
Non-contributory Times |
|||
|
Total time in minutes [min] |
||||
Table 2. Proposed format for time recording in the marine loading activity
|
Marine Loading Esmeralda Mine Sinking Level and Production-Times in Seconds [s] |
||||
|
N° |
Description |
Take 01 |
Take 02 |
Take N |
|
Activity Start time |
|
|
|
|
|
Activity End time |
|
|
|
|
|
1 |
Inspection of the work area |
|
|
|
|
2 |
Registration checklist |
|
|
|
|
4 |
Confinement of the area |
|
|
|
|
3 |
Limpieza de marina |
|
|
|
|
4 |
Limpieza hastiales y zapatera |
|
|
|
|
a |
Productive Times |
|
|
|
|
b |
Contributory Times |
|
|
|
|
c |
Non-contributory Times |
|
|
|
|
Total time in minutes [min] |
|
|
|
|
Table 3. Proposed format for time recording in the wedging activity
|
Wedging Mina Esmeralda Sinking Level and Production-Times in Seconds [s] |
||||
|
N° |
Description |
Take 01 |
Take 02 |
Take N |
|
|
Activity Start time |
|
|
|
|
|
Activity End time |
|
|
|
|
1 |
Inspection of the work area |
|
|
|
|
2 |
Registration checklist |
|
|
|
|
3 |
Illumination |
|
|
|
|
4 |
Labor crown wedging machine |
|
|
|
|
5 |
Labor boxes wedging machine |
|
|
|
|
6 |
Labor front wedging machine |
|
|
|
|
7 |
Marking for holding bolts |
|
|
|
|
a |
Productive Times |
|
|
|
|
b |
Contributory Times |
|
|
|
|
c |
Non-contributory Times |
|
|
|
|
Total time in minutes [min] |
|
|
|
|
Table 4. Proposed format for time recording in the drilling and bolts activity
|
Drilling and bolts Mina Esmeralda Sinking Level and Production-Times in Seconds [s] |
||||
|
N° |
Description |
Take 01 |
Take 02 |
Take N |
|
|
Activity Start time |
|
|
|
|
|
Activity End time |
|
|
|
|
1 |
Inspection of the work area |
|
|
|
|
2 |
Confinement of the area |
|
|
|
|
3 |
Registration checklist |
|
|
|
|
4 |
Positioning Jumbo at the front |
|
|
|
|
5 |
Water and power installation |
|
|
|
|
6 |
Water pump installation |
|
|
|
|
7 |
Bolt drilling |
|
|
|
|
8 |
Split set drilling |
|
|
|
|
9 |
Uninstallation of jumbo set and water pump |
|
|
|
|
a |
Productive Times |
|
|
|
|
b |
Contributory Times |
|
|
|
|
c |
Non-contributory Times |
|
|
|
|
Total time in minutes [min] |
|
|
|
|
Table 5. Proposed format for time recording in bolt grouting activity
|
Bolt grouting Mina Esmeralda Sinking Level and Production-Times in Seconds [s] |
||||
|
N° |
Description |
Take 01 |
Take 02 |
Take N |
|
|
Activity Start time |
|
|
|
|
|
Activity End time |
|
|
|
|
1 |
Inspection of the work area |
|
|
|
|
2 |
Registration checklist |
|
|
|
|
3 |
Crane entry |
|
|
|
|
4 |
Confinement of the area |
|
|
|
|
5 |
Transfer of fortification elements |
|
|
|
|
6 |
Installation of air pump |
|
|
|
|
7 |
Grouting and bolt placement |
|
|
|
|
9 |
Jumbo equipment and air pump uninstallation |
|
|
|
|
a |
Productive Time [min] |
|
|
|
|
b |
Contributory Times [min] |
|
|
|
|
c |
Non-contributory Times [min] |
|
|
|
|
Total time in minutes [min] |
|
|
|
|
Table 6. Proposed format for time recording in spinning activity
|
Spinning Mina Esmeralda Sinking Level and Production-Times in Seconds [s] |
||||
|
N° |
Description |
Take 01 |
Take 02 |
Take N |
|
|
Activity Start time |
|
|
|
|
|
Activity End time |
|
|
|
|
1 |
Inspection of the work area |
|
|
|
|
2 |
Registration checklist |
|
|
|
|
3 |
Crane entry |
|
|
|
|
4 |
Confinement of the area |
|
|
|
|
5 |
Spinning |
|
|
|
|
6 |
Crane removal |
|
|
|
|
a |
Productive Times |
|
|
|
|
b |
Contributory Times |
|
|
|
|
c |
Non-contributory Times |
|
|
|
|
Total time in minutes [min] |
|
|
|
|
Table 7. Proposed format for time recording in shotcrete activity
|
Shotcrete Mina Esmeralda Sinking Level and Production-Times in Seconds [s] |
||||
|
N° |
Description |
Take 01 |
Take 02 |
Take N |
|
|
Activity Start time |
|
|
|
|
|
Activity End time |
|
|
|
|
1 |
Inspection of the work area |
|
|
|
|
2 |
Registration checklist |
|
|
|
|
3 |
Preparation of projection equipment |
|
|
|
|
4 |
Water and air installation |
|
|
|
|
5 |
Mixer checklist registration |
|
|
|
|
6 |
Mixer installation |
|
|
|
|
7 |
Confinement of the area |
|
|
|
|
8 |
Concrete spraying |
|
|
|
|
9 |
Uninstallation of equipment |
|
|
|
|
a |
Productive Times |
|
|
|
|
b |
Contributory Times |
|
|
|
|
c |
Non-contributory Times |
|
|
|
|
Total time in minutes [min] |
|
|
|
|
Table 8. Proposed format for time recording in face drilling activity
|
Face Drilling Mina Esmeralda Sinking Level and Production-Times in Seconds [s] |
||||
|
N° |
Description |
Take 01 |
Take 02 |
Take N |
|
|
Activity Start time |
|
|
|
|
|
Activity End time |
|
|
|
|
1 |
Inspection of the work area |
|
|
|
|
2 |
Confinement of the area |
|
|
|
|
3 |
Registration checklist |
|
|
|
|
4 |
Positioning Jumbo at the front |
|
|
|
|
5 |
Water and power installation |
|
|
|
|
6 |
Installation of water pump |
|
|
|
|
7 |
Drilling |
|
|
|
|
8 |
Uninstallation of Jumbo equipment and water pump |
|
|
|
|
a |
Productive Times |
|
|
|
|
b |
Contributory Times |
|
|
|
|
c |
Non-contributory Times |
|
|
|
|
Total time in minutes [min] |
|
|
|
|
Table 9. Proposed format for time recording explosive loading activity
|
Explosive Loading Mina Esmeralda Sinking Level and Production-Times in Seconds [s] |
||||
|
N° |
Description |
Take 01 |
Take 02 |
Take N |
|
Activity Start time |
|
|
|
|
|
Activity End time |
|
|
|
|
|
1 |
Inspection of the work area |
|
|
|
|
2 |
Confinement of the area |
|
|
|
|
3 |
Registration checklist |
|
|
|
|
4 |
Face drilling untie |
|
|
|
|
5 |
Evaluation and cleaning of the shots |
|
|
|
|
6 |
Loading of each shot with crane |
|
|
|
|
7 |
Detonating cord and safety fuse connection |
|
|
|
|
a |
Productive Times |
|
|
|
|
b |
Contributory Times |
|
|
|
|
c |
Non-contributory Times |
|
|
|
|
Total time in minutes [min] |
|
|
|
|
After the identification of the family of products corresponding to stage 1 of the VSM, it takes time to proceed to execute the methodology for the calculation of productivity indicators in the field. The final indicators are defined as the average obtained from all the measurements taken. Apply the calculation of productivity indicators described below.
Proceed to calculate the productive, contributory and non-contributory times for each activity of the mining cycle.
Total Cycle Time (TCT): To obtain the total cycle time, the durations in seconds of the horizontal development activities in the shift must be added up.
Productive Time Percentage (PTP): It is calculated as the percentage of time that the productive time TP represents over the total cycle time.
$P T C=\frac{T P}{T C T} * 100$ (1)
Contributory Time Percentage (CTP): It is calculated as the percentage of time represented by the contributory time CT over the total cycle time.
$P T C=\frac{T C}{T C T} * 100$ (2)
Non-Contributory Time Percentage (NCTP): Calculated as the percentage of time represented by non-contributory time NCT over the total cycle time.
$P T C=\frac{T N C}{T C T} * 100$ (3)
Production (P): The yield is calculated by dividing the time of flow units processed by the activity over the man-hours invested.
$\begin{gathered}P=\frac{\text { Activity in linear meters }}{\text { number of operationsxworking hours }} \\ =\mathrm{ml} / \mathrm{HH}\end{gathered}$ (4)
Yield (Y): Yield is calculated by dividing the number of operators per hours worked by the activities in linear meters.
$\begin{gathered}R=\frac{\text { number of operatorsxworking hours }}{\text { activity in linear meters }} \\ =\mathrm{HH} / \mathrm{ml}\end{gathered}$ (5)
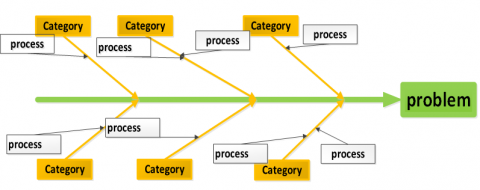
Once the results of the productive, contributory and non-contributory times have been established, the Ishikawa diagram should be applied as an instrument as shown in Figure 1, to identify the activities that generate the focus of the problem, using the Ishikawa matrix as a tool that allows us to verify the point of low productivity, which will allow us to carry out stage 2 (Current State Diagram) of the Value Stream Map methodology process.
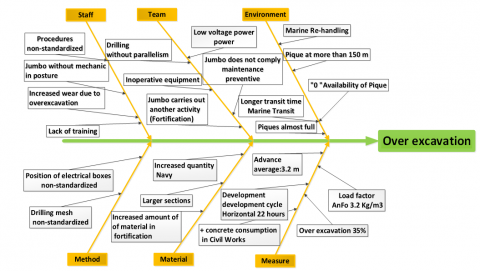
The Ishikawa analysis helps to identify the root causes of low productivity and high non-contributory times related to the mining cycle, as shown in Figure 2. By addressing these root causes, it allows us to improve the efficiency of operations and reduce the problems associated with low productivity in the mining cycle. This data will be used to apply Table 10, where productive times (PT), contributory times (CT) and non-contributory times (NC) will be determined.
Figure 1. Determination of the focus of the problem
Figura 2. Results of the application of the Ishikawa diagram
After determining the productivity equations and establishing the indicators for each activity, Table 10 is proposed.
Table 10. Control sheet of productive, contributory and non-contributory times
|
Mining Cycle Activity Times in [%] |
||||
|
N° |
Activity |
PT% |
CT% |
NCT% |
|
1 |
Ventilation |
|||
|
2 |
Marine loading |
|||
|
3 |
Wedging |
|||
|
4 |
Dilling bolt and Split set |
|||
|
5 |
Grouting and bolting |
|||
|
6 |
Spinning of fortification mesh |
|||
|
7 |
Fortification with shotcrete |
|||
|
8 |
Face drilling |
|||
|
9 |
Face loading |
|||
|
Overall Average Activity |
||||
The Ishikawa analysis is performed to know what the effect of longer times or lower efficiency is.
To determine which are the activities with the lowest efficiency, we consider the recommendation established by (Vogel, 1996), who maintains that quantitative values of efficiency above 70% are good.
Once stage 1 of the VSM process has been completed, the current state diagram must be executed, having recognized in the first stage the activities that produce lower performance, according to the theory of Vogel, 1996, the reasons that make these activities less productive must then be established graphically.
In order to facilitate a deeper understanding of value chain maps in the context of the mining industry, a valuable tool is presented: an adaptation of the value chain mapping scheme developed by Porter in 1985.
This version emphasises the usefulness of the instrument and highlights its value to better understand value chain maps in the mining industry, taking into account Table 11, we proceed to construct the value chain map (VSM) to execute the development of the proposal.
Using Table 11, it is recommended to execute the current state value chain map.
Table 11. Symbology for the construction of value chain maps
|
Symbol |
Name |
Meaning |
|
External agent |
Represents a supplier or customer. |
|
|
Activity |
Represents an activity processing units. |
|
|
Pushed flow |
Represents units being driven by the production of an activity. |
|
|
Supermarket |
Represent kanban supermercad. |
|
|
Inventory |
Represents the inventory. |
|
|
Production control |
Represents the entity in control of production. |
|
|
Manual information |
Represents the flow of information by manual means. |
|
|
Timeline |
It shows in its valleys the time of activity that add value and in the moments in which they do not. |
|
|
Data box |
Contains the indicators corresponding to the activity. |
|
|
Transportation |
Represents the transportation of material from an off-site location to the job site. |
|
|
Retirement Kanban |
Represents the flow of retirement kanban cards. |
|
|
Kaizen Event |
Represents a kaizen event and the improvements to be implemented. |
|
|
Operator |
Represents a worker performing an activity. |
The validation of our proposed formats, based on the principles of the Value Stream Mapping tool, has proven to be highly effective in assessing and improving time efficiency in horizontal mining excavations. This innovative approach has been tested in a real environment, at the Esmeralda mine, in its El Teniente division located in the southern country of Chile.
In this validation process, we have had the collaboration of Geovita S.A., a company specialized in the execution of subway works, excavations with their associated fortifications, assemblies and civil works associated with mining, road and hydroelectric projects, responsible for the management of the activities related to the mining cycle in the El Teniente Mine. The experience and knowledge provided by Geovita have been fundamental to ensure the success and applicability of our proposal.
Our 10-format proposal, supported by the Value Stream Mapping methodology, offers a comprehensive and effective approach to evaluate and optimize horizontal mining excavation processes. The results of this validation highlight the relevance and feasibility of implementing these practices in the mining industry, paving the way towards greater efficiency and productivity in horizontal mining operations.
3.1. Results of stage 1 product family
Table 12. Family of products to be mapped
|
N° |
Description |
|
1 |
Ventilation |
|
2 |
Marine withdrawal |
|
3 |
Wedging |
|
4 |
Drilling, fortification and split set |
|
5 |
Bolt grouting |
|
7 |
Spinning |
|
8 |
Shotcrete |
|
9 |
Face drilling |
|
10 |
Loading |
To show the results of the research carried out, the first stage is the identification of families, considering these as all the activities of the mining cycle at El Teniente mine, as shown in Table 12.
In accordance with Table 12, having identified the family of products, we proceeded to take the average times of each activity, using the proposals in Table 1, having as acronyms Nv-H: Sinking Level, C: Crossing, Rap: Ramp and XC: Access. On the other hand, the format should consider, as a fundamental summary of the data collection, the productive times (PT), contributory times (CT) and non-contributory times (NCT), obtaining the following results, which are shown in Tables 13-22.
Table 13. Time taking of each activity in the ventilation
|
Format N° 1: Esmeralda Mine Ventilation-Sinking and Production Level-Times in Seconds [s] |
||||||||
|
N° |
Description |
Take 01 |
Take 02 |
Take 03 |
Take 04 |
Take 05 |
Take 06 |
Take 07 |
|
|
Date and Working Level |
06-Oct Nv-H |
07-Oct Nv-H |
07-Oct Nv-H |
08-Oct Nv-H |
08-Oct Nv-H |
08-Oct Nv-P |
08-Oct Nv-P |
|
Labor |
C-27 Sur XC-5 |
C-43 Sur Acc-5 |
Rap N°2 FW |
XC Acc 6 HW C31 |
XC Acc 6 FW C31 |
Z-47 al Fw C-55 |
Z-50 al FW C-43 |
|
|
|
Activity Start Time |
10:32 a.m |
11:01 a.m |
11:05 a.m |
10:58 a.m |
12:20 p.m |
10.30 a.m |
12:00 p.m. |
|
Activity End Time |
11:31 a.m |
12:10 p.m |
12:41 p.m |
12:11 p.m |
1:19 p.m |
11:49 a.m |
1:20 p.m |
|
|
1 |
Evaluation the area to be worked |
312 |
321 |
362 |
248 |
456 |
543 |
664 |
|
2 |
Enabling the work area |
111 |
128 |
109 |
126 |
105 |
129 |
134 |
|
3 |
Confinement of the area |
240 |
232 |
432 |
476 |
254 |
465 |
345 |
|
4 |
Registration Checklist |
308 |
301 |
356 |
461 |
351 |
475 |
321 |
|
5 |
Installation of the chute with crane at 30m from the front of the posture |
1680 |
1870 |
1768 |
1587 |
1654 |
1598 |
1653 |
|
6 |
Start-up and verification of the ventilation sleeve |
178 |
184 |
176 |
187 |
174 |
165 |
179 |
|
7 |
Gas Level Check |
79 |
99 |
100 |
100 |
94 |
122 |
204 |
|
8 |
Remove Crane |
100 |
72 |
98 |
165 |
145 |
76 |
64 |
|
a |
Productive Times |
30.97 |
34.23 |
32.40 |
29.57 |
30.47 |
29.38 |
30.53 |
|
b |
Contributory Times |
19 |
19 |
24 |
26 |
23 |
30 |
29 |
|
c |
Non-Contributory Times |
99 |
106 |
130 |
108 |
96 |
110 |
111 |
|
|
Total time in minutes [min] |
148.97 |
159.23 |
186.4 |
163.57 |
149.47 |
169.38 |
170.53 |
Table 14. Time taking of each activity in the marine loading
|
Formato N° 2: Marine Loading Esmeralda Mine Sinking and Production Level-Times in Seconds [s] |
|||||||||||
|
N° |
Description |
Take 01 |
Take 02 |
Take 03 |
Take 04 |
Take 05 |
Take 06 |
Take 07 |
Take 08 |
Take 09 |
Take 10 |
|
|
Date and Work Level |
06-Oct Nv-H |
06-Oct Nv-H |
07-Oct Nv-H |
07-Oct Nv-H |
07-Oct Nv-H |
07-Oct Nv-P |
07-Oct Nv-P |
07-Oct Nv-P |
07-Oct Nv-P |
08-Oct Nv-H |
|
|
Labor |
C-27 Sur XC-5 |
XC-Acc 6 HW C31 |
C-45 Norte Acc-5 |
C-43 Sur Acc-5 |
C-29 Sur XC-5 |
C-43 al Sur Z40 |
C-47 al Sur Z-49 |
C-51 al Sur Z-44 |
Z-41 al HW C-45 |
C-27 SUR XC-5 |
|
|
Activity Start Time |
11: 33 a.m |
4:16 p.m |
1:25 a.m |
3:56 p.m |
11:15 a.m |
11:30 a.m |
6:00 p.m |
2:10 p.m |
11:00 a.m |
10:45 a.m |
|
|
Activity End Time |
1:50 p.m |
6:32 p.m |
4:02 a.m |
6:38 p.m |
1:31 p.m |
1:44 p.m |
11:30 p.m |
5:29 p.m |
1:31 p.m |
1:02 p.m |
|
1 |
Inspection of area to be worked |
286 |
465 |
589 |
318 |
468 |
267 |
426 |
589 |
251 |
735 |
|
2 |
Registration checklist |
256 |
356 |
578 |
538 |
398 |
254 |
631 |
559 |
243 |
438 |
|
4 |
Isolation of area to be worked |
258 |
185 |
325 |
345 |
314 |
251 |
247 |
231 |
256 |
315 |
|
3 |
Marine cleaning |
4318 |
4692 |
5201 |
5295 |
5612 |
4753 |
6528 |
6834 |
4893 |
4867 |
|
4 |
Gable cleaning |
356 |
356 |
532 |
467 |
678 |
754 |
867 |
610 |
659 |
437 |
|
a |
Productive Times |
77.9 |
84.1 |
95.6 |
96.0 |
104.8 |
91.8 |
123.3 |
124.1 |
92.5 |
88.4 |
|
b |
Contributory Times |
13.3 |
16.8 |
24.9 |
20.0 |
19.7 |
12.9 |
21.7 |
23.0 |
12.5 |
24.8 |
|
c |
Non-Contributory Times |
46 |
36 |
30 |
36 |
12 |
30 |
70 |
52 |
46 |
24 |
|
Total time in minutes [min] |
137.2 |
136.9 |
150.5 |
152 |
136.5 |
134.7 |
215 |
199.1 |
151 |
137.2 |
|
Table 15. Time taking of each activity in the wedging
|
Format N° 3: Wedging Esmeralda Mine Sinking Level and Production-Times in Seconds [s] |
|||||||||||
|
N° |
Description |
Take 01 |
Take 02 |
Take 03 |
Take 04 |
Take 05 |
Take 06 |
Take 07 |
Take 08 |
Take 09 |
Take 10 |
|
|
Date and Work Level |
06-Oct Nv-H |
06-Oct Nv-H |
06-Oct Nv-H |
07-Oct Nv-H |
07-Oct Nv-H |
07-Oct Nv-P |
07-Oct Nv-P |
07-Oct Nv-P |
07-Oct Nv-P |
07-Oct Nv-P |
|
|
Labor |
Calle 29 Sur XC-5 |
C-27 Sur XC-5 |
XC-Acceso 6 HW C31 |
C-43 Sur Acc-5 |
C-29 Sur XC-5 |
C-43 al Sur Z40 |
C-47 al Sur Z-49 |
C-51 al Sur Z-44 |
Z-41 al HW C-45 |
C-45 Norte Acc-5 |
|
|
Activity Start Time |
11:44 a.m |
04:42 p.m |
09:32 p.m |
09:27 p.m |
02:57 p.m |
9.00 p.m |
1:30 a.m. |
05:31 p.m |
02:45 p.m |
10:30 p.m |
|
|
Activity End Time |
1:02 a.m |
06:32 p.m |
11:09 p.m |
11:34 p.m |
4:19 p.m |
10:34 p.m |
3:19 a.m |
06:50 p.m |
04:10 p.m |
11:56 p.m |
|
1 |
Inspection of area to be worked |
290 |
327 |
312 |
586 |
456 |
435 |
534 |
603 |
299 |
664 |
|
2 |
Registration checklist |
456 |
600 |
345 |
335 |
312 |
543 |
421 |
487 |
357 |
478 |
|
3 |
Illumination |
376 |
399 |
235 |
345 |
301 |
465 |
356 |
365 |
256 |
301 |
|
4 |
Wedging of the crown of the work |
1086 |
1756 |
1767 |
2357 |
1156 |
1647 |
2523 |
1075 |
1059 |
1156 |
|
5 |
Wedging of the boxes of the work |
796 |
913 |
974 |
1398 |
846 |
832 |
803 |
834 |
768 |
829 |
|
6 |
Wedging of the work face |
178 |
879 |
567 |
900 |
699 |
443 |
350 |
412 |
301 |
456 |
|
7 |
Marking for Holding bolts |
524 |
697 |
660 |
458 |
567 |
479 |
436 |
376 |
587 |
476 |
|
a |
Productive Times |
43 |
71 |
66 |
85 |
54 |
57 |
69 |
45 |
45 |
41 |
|
b |
Contributory Times |
19 |
22 |
15 |
21 |
18 |
24 |
22 |
24 |
15 |
24 |
|
c |
Non-Contributory Times |
16.5 |
18.2 |
17 |
21 |
9 |
13 |
19 |
11 |
25 |
21.3 |
|
Total time in minutes [min] |
78.5 |
111.2 |
98 |
127 |
81 |
94 |
110 |
80 |
85 |
86.3 |
|
Table 16. Time taking of each activity in the bolt drilling and split set
|
Format N° 3: Wedging Esmeralda Mine Sinking Level and Production-Times in Seconds [s] |
|||||||||||
|
N° |
Description |
Take 01 |
Take 02 |
Take 03 |
Take 04 |
Take 05 |
Take 06 |
Take 07 |
Take 08 |
Take 09 |
Take 10 |
|
|
Date and Work Level |
06-Oct Nv-H |
06-Oct Nv-H |
06-Oct Nv-H |
06-Oct Nv-H |
06-Oct Nv-P |
06-Oct Nv-P |
06-Oct Nv-P |
07-Oct Nv-P |
07-Oct Nv-P |
07-Oct Nv-H |
|
|
Labor |
C-29 Sur XC-5 |
C-27 Sur XC-5 |
XC Acc 6 HW C31 |
XC Acc 6 FW C31 |
Z-47 al Fw C-55 |
Z-50 al HW C-43 |
Z-50 al Hw C-47 |
C-43 Sur Acc-5 |
C-29 Sur XC-5 |
C-43 al Sur Z40 |
|
|
Activity Start Time |
2:15 p.m |
9:30 p.m |
1:30 a.m |
10:30 a.m |
3:00 p.m. |
10:45 a.m |
10:45 a.m |
12:45 a.m |
3:46 p.m |
10:45 p.m |
|
|
Activity End Time |
5:29 p.m |
12:24 a.m |
7:33 a.m |
1:30 p.m |
5:47 p.m |
1:38 p.m |
2:14 p.m |
3:48 a.m |
8:16 p.m |
2:22 a.m |
|
1 |
Inspection of the area to be worked |
211 |
387 |
701 |
357 |
342 |
587 |
482 |
435 |
304 |
265 |
|
2 |
Isolation of area to be worked |
160 |
321 |
253 |
231 |
169 |
357 |
287 |
300 |
264 |
275 |
|
3 |
Registration checklist |
389 |
489 |
314 |
438 |
320 |
302 |
652 |
381 |
536 |
303 |
|
4 |
Positioning Jumbo in front |
124 |
176 |
128 |
176 |
156 |
178 |
247 |
171 |
124 |
176 |
|
5 |
Power and water installation |
246 |
470 |
587 |
356 |
456 |
359 |
536 |
351 |
467 |
547 |
|
6 |
Installation of water pump |
186 |
238 |
125 |
438 |
240 |
175 |
235 |
235 |
306 |
303 |
|
7 |
Drilling Bolts |
7000 |
7452 |
8363 |
6951 |
8000 |
6202 |
7253 |
7318 |
6335 |
8913 |
|
|
Jumbo equipment and water pump |
851 |
768 |
1062 |
827 |
972 |
925 |
872 |
930 |
798 |
900 |
|
|
uninstallation |
||||||||||
|
a |
Productive Times |
139.9 |
148 |
164.1 |
138.6 |
154.5 |
127.8 |
148.4 |
148.5 |
128.9 |
173.6 |
|
b |
Contributory Times |
20.2 |
30.5 |
39.1 |
35.2 |
25.1 |
30.9 |
35.7 |
25 |
30.5 |
25.6 |
|
c |
Non-Contributory Times |
34 |
25 |
160 |
21.3 |
0 |
14 |
20 |
10 |
10 |
18 |
|
Total time in minutes [min] |
194.1 |
203.5 |
363.2 |
195.1 |
179.6 |
172.7 |
204.1 |
183.5 |
169.4 |
217.2 |
|
Table 17. Time taking of each activity in the bolt grouting
|
Format N° 5: Bolt grouting Esmeralda Mine Sinking Level and Production-Times in Seconds [s] |
|||||||||||
|
N° |
Description |
Take 01 |
Take 02 |
Take 03 |
Take 04 |
Take 05 |
Take 06 |
Take 07 |
Take 08 |
Take 09 |
Take 10 |
|
Date and Work Level |
06-Oct Nv-H |
06-Oct Nv-H |
06-Oct Nv-P |
06-Oct Nv-P |
06-Oct Nv-P |
06-Oct Nv-P |
07-Oct Nv-H |
07-Oct Nv-H |
07-Oct Nv-H |
07-Oct Nv-P |
|
|
Labor |
Calle 29 Sur XC-5 |
XC Acceso 6 FW C-31 |
C-43 al Sur Z-40 |
Z-47 al Fw C-55 |
Z-50 al HW C-43 |
Z-50 al Hw C-47 |
C-29 Sur XC-5 |
C-27 Sur XC-5 |
XC Acc 6 HW C31 |
C-51 al Sur Z-44 |
|
|
Activity Start Time |
5:45 p.m |
1:15 a.m |
11:44 a.m |
9:00 p.m |
1:45 p.m. |
4:30 p.m |
8:45 p.m |
12:34 p.m |
10:30 a.m |
1:30 a.m |
|
|
Activity End Time |
6:58 p.m |
2:48 a.m |
1:16 p.m |
11:16 p.m |
3:58 a.m |
6:33 p.m |
10:42 p.m |
2:43 p.m |
12:15 a.m |
3:19 a.m |
|
|
1 |
Inspection of the area to be worked |
246 |
287 |
295 |
242 |
254 |
305 |
246 |
240 |
243 |
307 |
|
2 |
Registration checklist |
600 |
686 |
543 |
487 |
587 |
654 |
487 |
480 |
308 |
278 |
|
3 |
Crane entry |
154 |
186 |
134 |
68 |
132 |
132 |
126 |
136 |
187 |
125 |
|
4 |
Isolation of the area to be worked |
142 |
128 |
125 |
134 |
97 |
67 |
186 |
245 |
125 |
79 |
|
5 |
Transfer of fortification elements |
196 |
243 |
301 |
187 |
364 |
125 |
302 |
78 |
312 |
181 |
|
6 |
Instalation of air pump |
184 |
301 |
183 |
128 |
183 |
247 |
182 |
183 |
189 |
129 |
|
7 |
Grouting and bolt installation |
3632 |
3180 |
3648 |
5879 |
4321 |
5659 |
3354 |
3967 |
3801 |
3640 |
|
8 |
Uninstallation of jumbo equipment and air pump |
246 |
184 |
300 |
185 |
243 |
185 |
297 |
300 |
301 |
360 |
|
a |
Productive times [min] |
70.5 |
68 |
65.8 |
101 |
79 |
101.3 |
63.9 |
73.1 |
70.4 |
64.7 |
|
b |
Contributory times [min] |
19.5 |
18.6 |
26.4 |
20.9 |
24 |
21.6 |
25.4 |
20.7 |
20.7 |
20.3 |
|
c |
Non-contributory times [min] |
0 |
7 |
0 |
14 |
30 |
0 |
6 |
0 |
14 |
24 |
|
Total time in minutes [min] |
90.0 |
90 |
93.6 |
92.2 |
135.8 |
133 |
122.9 |
95.3 |
93.8 |
105.1 |
|
Table 18. Time taking of each activity in the mesh
|
Format N° 6: Mesh Esmeralda Mine Sinking Level and Production - Times in Seconds [s] |
|||||||||||
|
N° |
Description |
Take 01 |
Take 02 |
Take 03 |
Take 04 |
Take 05 |
Take 06 |
Take 07 |
Take 08 |
Take 09 |
Take 10 |
|
Date and Work Level |
06-Oct Nv-H |
06-Oct Nv-H |
06-Oct Nv-P |
06-Oct Nv-P |
06-Oct Nv-P |
06-Oct Nv-P |
07-Oct Nv-H |
07-Oct Nv-H |
07-Oct Nv-H |
07-Oct Nv-H |
|
|
Labor |
C-45 Norte Acc-5 |
C-29 Sur XC-5 |
C-43 al Sur Z-40 |
C-47 al Sur Z-49 |
C-51 al Sur Z-44 |
Z-50 al Hw C-47 |
C-29 Sur XC-5 |
C-27 Sur XC-5 |
XC Acc 6 HW C31 |
XC Acc 6 FW C31 |
|
|
Activity Start Time |
12:14 p.m |
9:41 p.m |
5:00 p.m |
2:30 p.m |
10:45 a.m. |
9:46 p.m |
1:30 a.m |
9:00 p.m |
2:30 p.m |
4:30 p.m |
|
|
|
Activity End Time |
1:35 p.m |
11:17 p.m |
6:34 p.m |
4:04 p.m |
12:46 p.m |
11:18 p.m |
3:58 a.m |
10:16 p.m |
4:26 p.m |
6:30 p.m |
|
1 |
Inspection of the area to be worked |
178 |
76 |
321 |
246 |
368 |
246 |
305 |
162 |
241 |
300 |
|
2 |
Registration checklist |
244 |
360 |
284 |
227 |
368 |
245 |
427 |
286 |
346 |
583 |
|
3 |
Crane entry |
124 |
186 |
243 |
125 |
128 |
121 |
185 |
126 |
183 |
124 |
|
4 |
Isolation of the area to work |
68 |
85 |
74 |
85 |
46 |
60 |
83 |
65 |
81 |
80 |
|
5 |
Mesh preparation |
485 |
547 |
600 |
426 |
542 |
368 |
543 |
261 |
200 |
542 |
|
6 |
Laying of mesh |
2687 |
3603 |
3125 |
3441 |
5808 |
3403 |
5742 |
3201 |
4625 |
3634 |
|
7 |
Crane removal |
246 |
254 |
185 |
363 |
246 |
247 |
186 |
168 |
184 |
126 |
|
a |
Productive Times |
58.8 |
70.1 |
65.1 |
61.4 |
100.8 |
59.7 |
100.7 |
60.4 |
107.1 |
80.6 |
|
b |
Contributory Times |
10.4 |
15.1 |
15.5 |
20.5 |
24.3 |
18.5 |
25.8 |
10.8 |
10.6 |
9.3 |
|
c |
Non-Contributory Times |
16 |
14 |
24 |
13 |
0 |
17 |
24 |
10 |
15 |
30 |
|
Total time in minutes [min] |
85.20 |
99.20 |
104.60 |
94.90 |
125.10 |
95.20 |
150.50 |
81.20 |
132.70 |
119.90 |
|
Table 19. Time taking of each activity in the spinning
|
Format N° 7: Spinning Esmeralda Mine Sinking Level and Production-Times in Seconds [s] |
|||||||||||
|
N° |
Description |
Take 01 |
Take 02 |
Take 03 |
Take 04 |
Take 05 |
Take 06 |
Take 07 |
Take 08 |
Take 09 |
Take 10 |
|
Date and Work Level |
06-Oct Nv-H |
06-Oct Nv-H |
06-Oct Nv-H |
06-Oct Nv-P |
06-Oct Nv-P |
06-Oct Nv-P |
06-Oct Nv-P |
06-Oct Nv-P |
07-Oct Nv-H |
07-Oct Nv-H |
|
|
Labor |
C-45 Norte Acc-5 |
C-43 Sur Acc-5 |
C-29 Sur XC-5 |
C-43 al Sur Z-40 |
C-47 al Sur Z-49 |
C-51 al Sur Z-44 |
Z-50 al FW C-43 |
Z-50 al Hw C-47 |
C-27 Sur XC-5 |
XC Acc 6 HW C31 |
|
|
Activity Start Time |
2:30 p.m |
10:30 a.m |
12:17 a.m |
10:00 p.m |
4:42 p.m. |
2:30 p.m |
12:47 a.m |
3:30 a.m |
11:30 p.m |
4:30 p.m |
|
|
Activity End Time |
4:37 p.m |
12:28 p.m |
2:27 a.m |
11:32 p.m |
6:58 p.m |
4:38 p.m |
2:31 a.m |
5:17 a.m |
1:41 a.m |
6:45 p.m |
|
|
1 |
Inspection of the area to be worked |
120 |
246 |
365 |
300 |
426 |
306 |
367 |
194 |
256 |
367 |
|
2 |
Registration checklist |
368 |
486 |
543 |
320 |
295 |
486 |
438 |
539 |
603 |
663 |
|
3 |
Crane entry |
69 |
73 |
84 |
185 |
125 |
180 |
174 |
121 |
198 |
185 |
|
4 |
Isolation of the area to work |
67 |
185 |
123 |
239 |
126 |
175 |
84 |
68 |
125 |
180 |
|
5 |
Spinning |
4647 |
5364 |
5678 |
3403 |
5080 |
5390 |
3880 |
3529 |
5607 |
5626 |
|
6 |
Crane removal |
185 |
245 |
185 |
119 |
301 |
245 |
309 |
176 |
234 |
297 |
|
a |
Productive Times |
83.5 |
95.4 |
100.6 |
63.7 |
91.7 |
94.8 |
70.7 |
64.8 |
96.5 |
100.8 |
|
b |
Contributory Times |
7.5 |
14.6 |
15.7 |
12.4 |
14.2 |
18.2 |
16.9 |
12.3 |
20.6 |
21.2 |
|
c |
Non-Contributory Times |
36 |
7 |
14 |
16 |
30 |
15 |
17 |
30 |
14 |
13 |
|
Total time in minutes [min] |
126.9 |
117.0 |
130.3 |
92.1 |
135.9 |
128.0 |
104.5 |
107.1 |
131.1 |
135.0 |
|
Table 20. Time taking of each activity in the shotcrete
|
Format N° 8: Shotcrete Esmeralda Mine Sinking Level and Production-Times in Seconds [s] |
|||||||||||
|
N° |
Description |
Take 01 |
Take 02 |
Take 03 |
Take 04 |
Take 05 |
Take 06 |
Take 07 |
Take 08 |
Take 09 |
Take 10 |
|
Date and Work Level |
06-Oct Nv-H |
06-Oct Nv-H |
06-Oct Nv-H |
06-Oct Nv-P |
06-Oct Nv-P |
06-Oct Nv-P |
06-Oct Nv-P |
06-Oct Nv-P |
07-Oct Nv-H |
07-Oct Nv-H |
|
|
Labor |
C-45 Norte Acc-5 |
C-43 Sur Acc-5 |
C-29 Sur XC-5 |
C-43 al Sur Z-40 |
C-47 al Sur Z-49 |
C-51 al Sur Z-44 |
Z-41 al HW C-45 |
Z-50 al Hw C-47 |
C-27 Sur XC-5 |
XC Acc 6 HW C31 |
|
|
Activity Start Time |
5:45 p.m. |
1:03 p.m |
2:30 a.m |
1:00 a.m |
10:00 p.m |
4:45 p.m. |
10:45 a.m |
6:00 a.m |
1:44 a.m |
8:00 p.m |
|
|
Activity End Time |
7:01 p.m |
2:44 p.m |
4:13 a.m |
2:32 a.m |
12:00 a.m |
6:30 p.m |
12:18 p.m |
7:42 a.m |
3:28 a.m |
10:00 p.m |
|
|
1 |
Inspection of the area to be worked |
537 |
421 |
778 |
472 |
598 |
486 |
547 |
483 |
427 |
486 |
|
2 |
Robot registration checklist |
365 |
389 |
542 |
386 |
600 |
347 |
427 |
300 |
338 |
544 |
|
3 |
Projection equipment preparation |
130 |
123 |
221 |
287 |
242 |
562 |
202 |
363 |
220 |
662 |
|
4 |
Water and air installation |
101 |
275 |
243 |
114 |
104 |
203 |
143 |
153 |
143 |
226 |
|
5 |
Mixer registration checklist |
104 |
165 |
210 |
124 |
163 |
265 |
153 |
147 |
153 |
245 |
|
6 |
Mixer installation |
132 |
176 |
246 |
185 |
243 |
180 |
185 |
237 |
178 |
245 |
|
7 |
Isolation of the area to work |
237 |
195 |
276 |
156 |
173 |
168 |
164 |
132 |
124 |
115 |
|
8 |
Concrete spraying |
2759 |
2646 |
2635 |
2143 |
3264 |
3001 |
2954 |
3921 |
3728 |
3603 |
|
9 |
Uninstallation of equipment |
175 |
165 |
135 |
210 |
185 |
153 |
276 |
143 |
265 |
246 |
|
a |
Productive Times |
75.7 |
72.1 |
70.9 |
72 |
72.4 |
75 |
69.2 |
77.4 |
77.9 |
86.1 |
|
b |
Contributory Times |
10 |
15.8 |
23.2 |
18 |
26.5 |
20.4 |
15 |
27.6 |
20 |
23.2 |
|
c |
Non-Contributory Times |
10 |
10 |
10 |
10 |
12 |
10 |
12 |
10 |
10 |
10 |
|
Total time in minutes [min] |
95.7 |
97.9 |
104.1 |
100.0 |
110.9 |
105.4 |
96.2 |
115.0 |
107.9 |
119.2 |
|
Table 21. Time taking of each activity in the face drilling
|
Format N° 9: Face drilling Esmeralda Mine Sinking Level and Production-Times in Seconds [s] |
|||||||||||
|
N° |
Description |
Take 01 |
Take 02 |
Take 03 |
Take 04 |
Take 05 |
Take 06 |
Take 07 |
Take 08 |
Take 09 |
Take 10 |
|
Date and Work Level |
06-Oct Nv-H |
06-Oct Nv-H |
06-Oct Nv-H |
06-Oct Nv-P |
06-Oct Nv-P |
06-Oct Nv-P |
06-Oct Nv-P |
07-Oct Nv-H |
07-Oct Nv-H |
07-Oct Nv-H |
|
|
Labor |
C-45 Norte Acc-5 |
C-43 Sur Acc-5 |
C-29 Sur XC-5 |
C-43 al Sur Z-40 |
C-47 al Sur Z-49 |
C-51 al Sur Z-44 |
Z-41 al HW C-45 |
C-27 Sur XC-5 |
XC Acc 6 HW C31 |
XC Acc 6 FW C31 |
|
|
Activity Start Time |
9:30 p.m |
3:15 p.m |
4:27 a.m |
2:45 a.m |
1:00 a.m |
9:16 p.m. |
2:30 p.m |
3:45 a.m |
11:00 a.m |
1:31 a.m |
|
|
Activity End Time |
12:46 p.m |
7:18 p.m |
7:30 a.m |
5:42 a.m |
4:16 a.m |
12:45 p.m |
6:28 p.m |
7:02 a.m |
2:29 a.m |
4:43 a.m |
|
|
1 |
Inspection of the area to be worked |
374 |
236 |
397 |
0 |
423 |
335 |
424 |
0 |
413 |
0 |
|
2 |
Isolation of the area to work |
236 |
425 |
309 |
325 |
287 |
300 |
365 |
426 |
365 |
236 |
|
3 |
Registration checklist |
415 |
436 |
486 |
432 |
481 |
433 |
473 |
413 |
472 |
532 |
|
4 |
Positioning Jumbo to the front |
413 |
364 |
246 |
286 |
543 |
421 |
368 |
325 |
304 |
308 |
|
5 |
Power and water installation |
683 |
545 |
584 |
513 |
634 |
546 |
524 |
558 |
534 |
553 |
|
6 |
Water pump installation |
302 |
359 |
236 |
181 |
287 |
148 |
252 |
167 |
365 |
243 |
|
7 |
Drilling |
7066 |
8839 |
7336 |
7294 |
7255 |
7067 |
7564 |
7381 |
7396 |
7788 |
|
8 |
Jumbo equipment and water pump uninstallation |
273 |
285 |
248 |
225 |
236 |
282 |
368 |
243 |
386 |
238 |
|
a |
Productive Times |
117.8 |
147.3 |
122.3 |
121.6 |
120.9 |
117.8 |
126.1 |
123.0 |
123.3 |
129.8 |
|
b |
Contributory Times |
44.9 |
44.2 |
41.8 |
32.7 |
48.2 |
41.1 |
46.2 |
35.5 |
47.3 |
35.2 |
|
c |
Non-Contributory Times |
33 |
52 |
20 |
23 |
27 |
50 |
66 |
39 |
38 |
27 |
|
Total time in minutes [min] |
195.7 |
243.5 |
184.0 |
177.3 |
196.1 |
208.9 |
238.3 |
197.6 |
208.6 |
192.0 |
|
Table 22. Time taking of each activity in the explosive loading
|
Format N° 10: Explosive Loading Esmeralda Mine Sinking Level and Production-Times in Seconds [s] |
|||||||||||
|
N° |
Description |
Take 01 |
Take 02 |
Take 03 |
Take 04 |
Take 05 |
Take 06 |
Take 07 |
Take 08 |
Take 09 |
Take 10 |
|
Date and Work Level |
06-Oct Nv-H |
06-Oct Nv-H |
06-Oct Nv-P |
06-Oct Nv-P |
06-Oct Nv-P |
07-Oct Nv-H |
07-Oct Nv-H |
07-Oct Nv-P |
07-Oct Nv-P |
07-Oct Nv-P |
|
|
Labor |
C-45 Norte Acc-5 |
C-43 Sur Acc-5 |
C-43 al Sur Z40 |
C-51 al Sur Z-44 |
Z-41 al HW C-45 |
XC Acceso 6HW C31 |
XC Acceso 6 FW C31 |
Z-47 al Fw C-55 |
Z-50 al HW C-43 |
Z-50 al Hw C-47 |
|
|
Activity Start Time |
1:45 a.m |
5:15 a.m |
6:00 a.m |
4:45 a.m |
1:30 a.m |
3:30 a.m. |
5:30 a.m |
1:30 a.m |
3:45 a.m |
10:00 p.m |
|
|
Activity End Time |
3:32 a.m |
6:44 a.m |
7:32 a.m |
6:32 a.m |
2:48 a.m |
5:28 a.m |
7:27 a.m |
3:16 a.m |
5:28 a.m |
11:43 p.m |
|
|
1 |
Inspection of the area to be worked |
485 |
225 |
357 |
237 |
372 |
295 |
243 |
299 |
301 |
304 |
|
2 |
Isolation of the area to work |
85 |
106 |
82 |
53 |
47 |
43 |
78 |
101 |
78 |
126 |
|
3 |
Registration checklist |
344 |
486 |
348 |
387 |
377 |
360 |
367 |
331 |
376 |
343 |
|
4 |
Face drilling untie |
165 |
0 |
264 |
0 |
574 |
754 |
0 |
487 |
0 |
0 |
|
5 |
Evaluation and cleaning of the shots |
184 |
207 |
241 |
125 |
0 |
279 |
154 |
127 |
0 |
0 |
|
6 |
Loading of each shot with crane |
4441 |
3710 |
3147 |
4321 |
3993 |
4585 |
4594 |
3856 |
3743 |
4401 |
|
7 |
Detonating cord and safety fuse connection |
397 |
320 |
496 |
798 |
837 |
495 |
659 |
713 |
845 |
720 |
|
a |
Productive Times |
80.6 |
67.2 |
60.7 |
85.3 |
80.5 |
84.7 |
87.6 |
76.2 |
76.5 |
85.4 |
|
b |
Contributory Times |
21.1 |
17.1 |
21.5 |
13.4 |
22.8 |
28.9 |
14.0 |
22.4 |
12.6 |
12.9 |
|
c |
Non-Contributory Times |
6 |
5 |
10 |
9 |
5 |
6 |
6 |
8 |
14 |
5 |
|
Total time in minutes [min] |
107.7 |
89.2 |
92.3 |
107.7 |
108.3 |
119.5 |
107.6 |
106.6 |
103.1 |
103.2 |
|
As shown in Tables 13-22 of the proposed format, times have been taken for each activity that makes up the mining cycle, which allows first validating the format and then establishing the results of the productive, contributory and non-contributory times shown in indicators a, b and c at the end of each table, which allows to establish the real times of the mining cycle and compare them with the standard times of the contract.
3.2. Results of stage 2 current state diagram
To present the results of the current state analysis, initially the Ishikawa diagram tool was used, which allowed to clearly identify the activities that are contributing to the low productivity problems.
Therefore, the Ishikawa tool adapted to the context of the Esmeralda mine was applied.
The first action consisted of carrying out an exhaustive field review with a specialized team composed of three Lean Manufacturing experts, three shift leaders, six foremen and a superintendent. During this field phase, several irregularities were detected related to mine personnel, work methods, equipment condition, post-dumping aspects of the material, spaces available for the placement of marinas and mine site management standards.
The analysis revealed that, due to the aforementioned reasons, personnel are not performing their tasks in a standardized manner. In addition, the lack of mechanical personnel at the fronts was confirmed and it was verified that adequate training has not yet been provided to the personnel. Regarding methods, a problem was identified in the distribution of drilling mesh. Regarding equipment, the presence of inoperative equipment was observed. In relation to the material, an excess of marina was observed in comparison with the quantities established in the contract by the mine works management, generating problems in the availability of shafts for the placement of the marina. Finally, with regard to the sections defined in the contract, it was found that these exceeded the proposed value by %, this being the main cause of an over-excavation of 30%, exceeding the limits established by the mine works management, which originally proposed only 12%.
In the Ishikawa analysis it was possible to identify that four activities of the mining cycle (Ventilation, marine loading, wedging, face drilling) represent the focus of the problem of low productivity since they have longer or less efficient times, so the problem should be attacked considering only the improvement in these activities, taking into account the following reasons:
Personnel: The work procedures of the different activities are not controlled, generating inadequate procedures that are not noticed by the (technical site inspectors), so there are activities that exceed the standardized limits, resulting in over-excavations that generate more time in the wedging.
Equipment: The equipment is not repaired quickly because they do not have good logistics for the purchase of parts. The low voltage of the electrical power causes damage to the electrical box of the postures and the Jumbo box, which takes a long time because the procedure indicates that the electrician must be called to solve this problem (there are only two electricians for the two levels, sinking and production). The jumbo does not comply with preventive maintenance because the shift manager is responsible for delivering the equipment to the mechanical shop and this is not done.
The re-handling of materials causes more traffic of the Scoop Equipment having sawed postures by marine traffic and this generates interference, the marine stockpiling is done by the specialized company Geovita because of the need to continue blasting without thinking that it generates interference in the area by the transfer of the Scoop equipment. The biggest problem is the availability of rock chips, which is the responsibility of the mining company.
Method: The drilling mesh is designed for only a section size of 4.0m x 4.5m and does not change the drilling pattern which depends on the type of rock and explosive. The method has a lot of interference because of the 38 pieces of equipment that are moved by the two main positions, these are mining and civil works equipment plus the Mixer that supplies the two processes.
Material: Over-excavation generates a greater amount of: marine, split set, helical bolts, Shotcrete, equipment and time that are associated with building larger excavations. Civil works have a greater problem since over-excavation causes a greater consumption of concrete that is used in road surfaces, extraction points and confining walls.
All the described processes culminate in the main cause of the problem, which is the over excavation that generates the low yields, due to the fact that ventilation, marine loading, wedging and face drilling have a significant influence on these results, which are validated by measuring the execution times of the construction processes of the horizontal excavations described in stage 1.
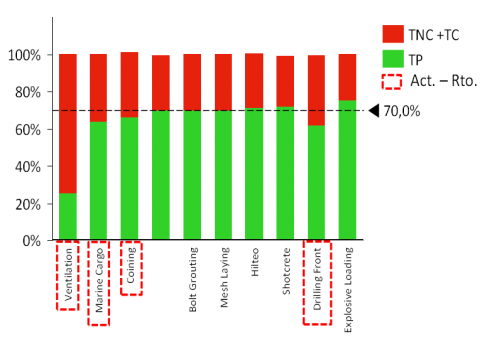
In this research, we contextualise the activities with the lowest performance based on the results found in the calculation of performances carried out in the time taking in the previous stage, leaving Tables 23, 24, and Figure 3 as a tool adapted to the mining cycle of horizontal excavations.
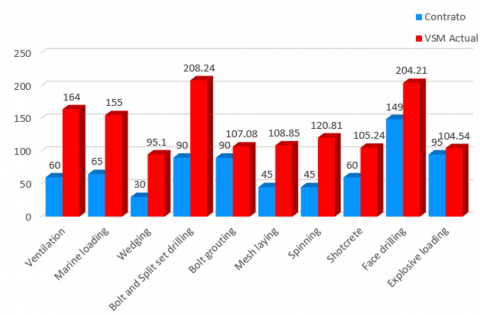
From Tables 23, 24 and Figure 3, the main activities that generate the greatest delays have been identified as the families involved. The activities in the mining cycle must achieve at least 70% of productive work, and it can be seen that the activities that do not achieve this performance are ventilation with 18.96% productivity, marine loading with 63.13%, wedging with 60.57% and face drilling with 61.2%.
Table 23. Results of mining cycle averaging in minutes
|
Average Process Times in Minutes [min] |
||||
|
Activity |
PT |
CT |
NCT |
TCT |
|
Ventilation |
31.1 |
24.3 |
108.6 |
164 |
|
Marine loading |
97.85 |
18.96 |
38.2 |
155.01 |
|
Wedging |
57.6 |
20.4 |
17.1 |
95.1 |
|
Bolt and Split set drilling |
147.23 |
29.78 |
31.23 |
208.24 |
|
Bolt grouting |
75.77 |
21.81 |
9.5 |
107.08 |
|
Mesh laying |
76.47 |
16.08 |
16.3 |
108.85 |
|
Spinning |
86.25 |
15.36 |
19.2 |
120.81 |
|
Shotcrete |
74.87 |
19.97 |
10.4 |
105.24 |
|
Face drilling |
125 |
41.71 |
37.5 |
204.21 |
|
Explosive loading |
78.47 |
18.67 |
7.4 |
104.54 |
Table 24. Results of process averaging in minutes
|
Summary of Average Times in [%] |
|||
|
Actividad |
PT% |
CT% |
NCT% |
|
Ventilation |
18.96 |
14.81 |
66.23 |
|
Marine loading |
63.13 |
12.23 |
24.64 |
|
Wedging |
60.57 |
21.45 |
17.98 |
|
Bolt and Split set drilling |
70.7 |
14.3 |
15 |
|
Bolt grouting |
70.76 |
20.37 |
8.87 |
|
Mesh laying |
70.25 |
14.77 |
14.98 |
|
Spinning |
71.4 |
12.7 |
15.9 |
|
Shotcrete |
71.14 |
18.98 |
9.88 |
|
Face drilling |
61.2 |
20.4 |
18.4 |
|
Explosive loading |
75.1 |
17.8 |
7.1 |
|
Average |
63.32 |
16.78 |
19.90 |
Figure 3. Identification of underperforming activities
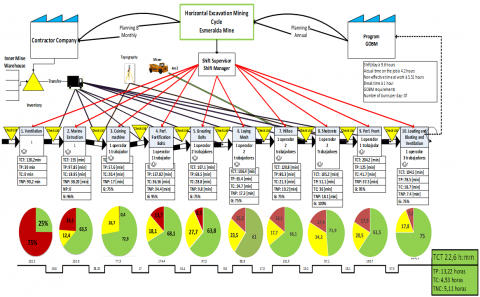
In Figure 4, the maps of the current state of the value chain of the low performance activities (marine loading, wedging and face drilling) are constructed and presented, ventilation is a consequence of some activities and materials, which is why it will only be analyzed at the end, where the times assigned to each activity to perform the work in the positions are shown in detail, quantifying the % of Productive Time and the % of Contributory Time, separating these from Non-Contributory Time.
Figure 4 shows in detail the times assigned to each activity to perform the work in the positions, quantifies the % of Productive Time and % of Contributory Time, separating these from Non-Contributory Time.
When elaborating the current state map, it is immediately identified that the complete realization of the activities requires long periods of time, the total cycle time is 22.1 hours, as calculated in Figure 4 of the current state diagram. The time that does not add value is 5.3 hours, speaking only of the productive work hours. The statistical pie chart indicates the efficiency in percentage of compliance, being green the percentage of productive time, yellow the percentage of time that contributes to the activity and red the percentage of non-contributory time.
Figure 5 shows that the times established in the contract are not related to the times found when applying the current V.S.M., due to the fact that at the time of making the contract, the existence of operational interferences that are an important factor in the determination of the real yields is not taken into account, added to the fact that only a value of 19% of over excavation is considered while in reality an over excavation of 32% has been calculated, which generates operational increases in the mining cycle.
Figure 4. VSM of Horizontal Developments Current status of all activities in the mining cycle of horizontal excavations
Figure 5. Identification of the times in the current VSM/Contract mining cycle
In this study, the importance and effectiveness of the application of the 10 formats designed for data collection in all activities of the mining cycle has been demonstrated. These formats have made it possible to collect detailed and precise information on the times of each activity, providing a comprehensive and updated vision of the entire mining process.
The results found during the application of these formats have been revealing. It was possible to accurately determine the productive (13.22 hours), contributory (4.53 hours) and non-contributory (5.11 hours) times in the different stages of the mining cycle. This time segmentation has provided a deeper understanding of operational efficiency, highlighting specific areas that require attention.
The use of these formats has also made it possible to compare the times obtained with those established in the contracts or production objectives. This comparison has revealed significant discrepancies in key activities such as venting (18.96%), marine loading (63.13%), coining (60.57%) and drilling (61.2%). These findings highlight the importance of strategically addressing underperforming areas to improve the overall efficiency of the mining cycle.
Furthermore, the application of the Ishikawa tool to analyze the collected data has been essential to identify the root causes of the identified problems. It was determined that overexcavation, caused by the use of certain explosives, is the main cause that affects productivity. These results provide a solid foundation for implementing corrective and strategic actions that directly address the identified challenges.
Finally, the results found during the application of the 10 formats for data collection in all activities of the mining cycle underline its value as a powerful tool to collect real data, identify areas of improvement and make informed decisions to optimize the mining process. Its systematic and rigorous application is essential to guarantee efficient and competitive management in the mining industry.
To ensure the efficiency and continued success of this approach, it is essential to approach the analysis from a global perspective, integrating data collection continuously into all daily operational reports, from excavations to management. This involves establishing a robust, automated information system that allows conditions and performance to be monitored in real time.
The availability of updated and detailed information at all levels of the mining operation is essential to make informed and timely decisions. The implementation of technology to automate the information system facilitates this process, allowing situations to be consulted in real time and to respond quickly and efficiently to any challenge or change in operating conditions.
Furthermore, given the dynamic and evolving nature of the mining industry, deepening operations requires a mindset of continuous improvement. Based on the findings of this study and the inherent flexibility of the lean methodology, pilot tests can be carried out and experiments with changes in mining activity. This allows you to proactively adapt to emerging challenges, identify opportunities for improvement and further optimize mining cycle performance.
Although this research comprehensively addresses productivity aspects in the mining cycle, it is important to highlight that the application of this tool is not limited only to temporal aspects. It is also useful to evaluate other indicators such as safety or environmental impact. However, these aspects are not the focus of this study, since no modifications will be made regarding them.
This work has been possible thanks to the collaboration of the mine works management of the mining preparation of the Esmeralda mine, El Teniente division, Codelco-Chile.
| BP | Bypass |
| CX | Cruise |
| NV-H | Sinking level |
| NV-P | Production level |
| TCT | Total cycle time |
| TP | Productive time |
| TC | Contributing time |
| TNC | Non-contributory time |
[1] Bocanegra, I.M.H. (2020). El contrato de explotación minera (*) The Mining Contract. https://dialnet.unirioja.es/descarga/articulo/7219666.pdf
[2] Herrera Herbert, J. (2006). Introducción a los fundamentos de la tecnología minera. Edición Actualizada Y Revisada Para El Curso Académico 2006-2007.
[3] Gómez Botero, P.A. (2010). Lean manufacturing: flexibilidad, agilidad y productividad. Gestión y Sociedad, 3(2): 75-88. https://ciencia.lasalle.edu.co/gs
[4] Soler, V.G. (2011). Lean manufacturing. what is and what is no errors in its most common application and interpretation.https://3ciencias.com/articulos/articulo/lean-manufacturing-que-es-y-que-no-es-errores-en-su-aplicacion-e-interpretacion-mas-usuales/.
[5] Zahraee, S.M., Esrafilian, R., Kardan, R., Shiwakoti, N., Stasinopoulos, P. (2021). Lean construction analysis of concrete pouring process using value stream mapping and Arena based simulation model. Materials Today: Proceedings, 42: 1279-1286. https://doi.org/10.1016/j.matpr.2020.12.955
[6] Tejeda, A.S. (2011). Mejoras de lean manufacturing en los sistemas productivos. Ciencia y Sociedad, vol. 2. http://www.redalyc.org/articulo.oa?id=87019757005
[7] Montoya, C. (2011). El balanced scorecard como herramienta de evaluación en la gestión administrativa. Visión de Futuro, 15(2): 1-25. www.fce.unam.edu.ar/revistacientifica/URLdelDocumento:http://revistacientifica.fce.unam.edu.ar/index.php?option=com_content&view=article&id=251&Itemid=61
[8] Stadnicka, D., Litwin, P. (2019). Value stream mapping and system dynamics integration for manufacturing line modelling and analysis. International Journal of Production Economics, 208: 400-411. https://doi.org/10.1016/j.ijpe.2018.12.011
[9] Seifullina, A., Er, A., Nadeem, S.P., Garza-Reyes, J.A., Kumar, V. (2018). A lean implementation framework for the mining industry. Ifac-Papersonline, 51(11): 1149-1154. https://doi.org/10.1016/j.ifacol.2018.08.435
[10] Baladrón, C., Alarcón, L.F. (2017). Assessing the impact of lean methods in mining development projects. In 25th Annual Conference of the International Group, pp. 137-144. https://doi.org/10.24928/2017/0272
[11] Lööw, J. (2018). Una investigación sobre las prácticas de producción ajustada en la minería. Revista Internacional de Lean Six Sigma, 10(1): 123-142. https://doi.org/10.1108/IJLSS-07-2017-0085
[12] GOBM. Gerencia de Obras Mina lidera proyecto de manejo y compactado de residuos metálicos en El Teniente | CODELCO-Corporación Nacional del Cobre, Chile. Codelco. https://www.codelco.com/operaciones/el-teniente/noticias/gerencia-de-obras-mina-lidera-proyecto-de-manejo-y-compactado-de.
[13] Geovita|SalfaCorp|Ingeniería, Construcción e Inmobiliaria. https://www.salfacorp.com/unidades-de-negocio/ingenieria-y-construccion/empresas-operativas/geovita/.