Manuntun Parulian Hutagaol*![]() | Dahri Tanjung
| Dahri Tanjung![]() | Kukuh Nirmala
| Kukuh Nirmala![]() | Yuni Puji Hastuti
| Yuni Puji Hastuti![]() | Yulia Puspadewi Wulandari
| Yulia Puspadewi Wulandari![]()
© 2024 The authors. This article is published by IIETA and is licensed under the CC BY 4.0 license (http://creativecommons.org/licenses/by/4.0/).
OPEN ACCESS
In response to the claim of bad water quality of Lake Toba for an international tourism destination, the government of North Sumatra issued two regulations that determined the improvement of water quality from mesotrophic to oligotrophic and scaling down of carrying capacity from 70 thousand to 10 thousand tons per annum. This regulation provoked conflict between the tourism industry and the fish in-cage farming industry. This study was carried out to verify as to whether the fish in-cage farming industry is the sole major factor in the deterioration of Lake Toba's water quality. Field research was carried out in 2020-2021 at 60 sampling points around Lake Toba. Identified water quality based on nutrients consisting of total nitrogen, total phosphorus, chlorophyll, and water brightness. The study concluded that fish in-cage farming was not the single major factor responsible for the lake’s water deterioration. It also concluded the appropriate ceiling production capacity was 67 thousand tons per annum, and the water quality became mesotrophic. Therefore, it recommended the provincial government should change its management approach to controlling pollution entering Lake Toba from an instructive (top-down) to a multi-stakeholder approach called the co-management model.
fish in-cage farming, Lake Toba, water pollution, supporting and carrying capacity, policy analysis, tourism impacts
1.1 The underlying problem
Lake Toba in North Sumatra Province, Indonesia is the deepest lake (± 450 meters) and the second largest in the world after Lake Victoria in Africa, and is the largest lake in Southeast Asia. For a long time, fish-in-cage farming has become the main source of livelihood for the people around Lake Toba. This activity also becomes an opportunity for many parties, such as workers in fish in cage farming, feed traders, fish seed traders, transportation services, cage traders, etc. Fish in cages farming on Lake Toba is a profitable business. The results of research by Sitompul, et al state that the floating net cage (FNC) business in North Tapanuli Regency provides profits of up to 34% [1]. This is in line with research by Pandiangan in Simalungun [2].
The government of Indonesia in 2015 declared Lake Toba as one of the 10 priority tourist destinations internationally. The government wished the destination to become a new source of international currency as well as a machine for economic growth. To this end, the Indonesian government set an annual target of one million international tourists visiting this new destination [3]. To ease its achievement the government worked hard to make the destination more accessible and convenient for international tourists.
This new development had created disturbance which could eliminate the existence of fish in-cage farming or popularly known as floating net cages (FNC) in the lake. The government of Indonesia introduced this type of farming as a means of poverty eradication program in the early 1990s, but only after the coming of a big company into this fish farming a few years later made it become popular as a mode of fish business in Lake Toba. From the perspective of annual revenue and labor absorption, now the FNC business has become the biggest industry in the Lake Toba area covering 8 districts.
The FNC industry had been often viewed as a single major source of pollutants that deteriorated the lake's water quality. It became a popular view after [4] claimed that every day a significant portion of the feed that the big company fed to its cultured fish was drawn into the lake. Later World Bank which held the same view made a stronger claim the current water quality of Lake Toba was not suitable for the international tourism industry [5].
In response to the current increasing dissonance about the water quality of Lake Toba, the provincial government of North Sumatra issued two regulations to control the discharge of feed pollutants from the FNC industry. The first one is the Governor of North Sumatra Decree No. 188.44/209/KPTS/2017 regarding Lake Toba Trophic Status [6]. This decree determined the target of improvement of the lake’s water quality from the current nutrient status of mesotrophic to oligotrophic. The target was to be realized five years after its introduction.
The second regulation is the Governor of North Sumatra Decree No. 188.44/213/KPTS/2017 [7]. It was complementary to the first one. It determined the carrying capacity of the lake to produce fish in cages of only 10.000 tons per annum. Therefore, the current annual production level of about 70.000 tons per annum must be reduced to only 10.000 tons per annum. This reflected the government's opinion that the FNC was a single major source of pollutants deteriorating the water quality of Toba Lake.
The scaling-down policy was a real tragedy for the FNC owners. Because if it is enforced effectively, it would make their business simply not feasible to operate. The ten thousand tons of fish production quota must be shared with more than thirteen thousand FNC owners equally. Thus, every FNC operator would be allowed to produce less than one ton of fish per annum. Now the FNC owners realized the provincial government wanted the FNC to be wiped out from the lake by the issuance of the two governor regulations. This was the one that created tension between the FNC and the international tourism industries' use of the lake’s natural resources.
Research on the condition of Lake Toba's water pollution has been carried out by various parties. Contrary to World Bank research, other research using the Beveridge method and the STORET method, found that water quality in the observation stations is at water class II/light pollution (station 1) and water class I/good condition (Station 2) and even capable to carry a higher number of cage aquaculture [8]. In this research, Pinem used 3 observation stations namely Station 1 (Bandarsaribu): which represents a high-density cage aquaculture area, station 2 (Gudang): which represents medium density cage aquaculture area and Station 3 (Silumbak): which represents neutral waters where there are no cage aquaculture and human activities. This research stated that the carrying capacity for stations 1 and 2 is still below the carrying value and still able to get a higher number of caged aquaculture units by 84 units for station 1, and 217 units for station 2.
Another research had a quite similar conclusion to Pinem, where it stated that based on Secchi depth, referring to the Ministry of Environment Republic of Indonesia Regulation No. 28/2009, Lake Toba is still at the oligotrophic level [9]. Secchi depth is a measure of water transparency, where transparency increases with increasing Secchi depth. The Secchi depth is the depth of water beyond which a high-contrast pattern on a submerged disk is no longer visible. Lake Toba also has the lowest level of chlorophyll as reflected by phytoplankton biomass, compared to other Sumatran major lakes, with a concentration of chlorophyll of 0,47 mg/m3. In their newer research, Lukman, et.al stated that the estimated Total Phosphorus load to the lake is 632,5 mg/m2 /year [10].
The relevant question was it desirable to close the FNC industry to improve the water quality of the lake to make it suitable for international tourism? The FNC industry’s occupation on the lake’s surface is very small, only about 466 ha. This occupation was 0,40% of the total surface of about 116 thousand hectares [11]. How could such a very small use of water surface make the quality of the lake’s water so bad?
Meanwhile, there were hundreds of social and economic entities around the lake which all disposed of pollutants directly or indirectly into the lake. In addition, more than one hundred small rivers channeled water containing pollutants into the lake. Considering all these facts made it doubtful if closing floating net cage fish production alone would make the targeted water quality of the lake became realized. The European Union through the Territorial Agenda 2020 stated that territories that are rich in natural and cultural values but particularly vulnerable need special attention to identifying appropriate long-term solutions capable of assuring a vital local economy, by enhancing the creation of environmentally friendly jobs, attractive living conditions and suitable public services for citizens and enterprises.
Based on the preceding discussion some problems are identified to study.
·First, what were the sources of a pollutant that deteriorated Lake Toba’s water? Had the FNC production so important to take control of its production to become a single solution for the water quality degradation?
·Was the targeted improvement of the lake’s water quality realistic to achieve? How many tons should be the carrying capacity of Lake Toba for FNC production?
·What measures should be implemented to improve the lake’s water quality?
1.2 The study objectives
This study was assigned to find out answers to all the identified questions. In particular, the study would focus on the measurement of the contribution of each identified source of pollutant in degrading the water quality of Lake Toba and determine its implication on the targeted water quality to achieve and the set carrying capacity of the lake for floating net cage fish production. It also discussed a more holistic measurement for protecting the lake from the intrusion of pollutants. Then, some recommendations would be formulated.
This study used information obtained from observation and measurement of the water quality of Lake Toba to answer the study's objectives. For this purpose, this study identified nine potential sources of pollutants that deteriorated the water quality of the lake. Then the study made the area where the pollutant was discharged into the lake a water observation station from which samples of water for quality analysis were taken. In addition, the station was named after the source of pollutants which discharged into it.
2.1 Study area
Study activities were carried out in the area of Lake Toba, North Sumatra Province. The study determined nine water observation stations (clusters) as shown in Figure 1.
Figure 1. Water observation station in Lake Toba
2.2 Data collection
The study was carried out in the period 2020-2021 with three season field observations, namely: (a) wet season in February 2020, (b) transition season in March 2021, and (c) dry season in August 2021.
2.3 Water sampling
At each season, water samples were taken from 67 points of observation distributed among the nine observation stations. At any observation point, a sample of water was taken from three different depths, i.e., 1-meter depth, 3-meter depth, and 6-meter depth.
Stratified water samples were taken using a tool called a Vandorn. Furthermore, samples based on stratification were prepared in a composite manner. Four water variables were observed and measured namely P-total, N-total, Chlorophyll-a, and water brightness.
2.4 Carrying capacity analysis
Measurement of the supporting and carrying capacity of Toba Lake was carried out through analysis of aquatic physical, chemical, and biological parameters. Physical parameters include brightness and chemical parameters in the form of total Phosphate (P-total) and total nitrogen (N-total). The biological parameters analyzed were the chlorophyll content in the water samples. Water quality tests were carried out at the Aquatic Productivity and Environment Laboratory, Department of Aquatic Resources Management, Faculty of Fisheries and Marine Sciences, Bogor Agricultural University.
The approach to determine the carrying capacity of the waters for net floating cage activities was the total-P load approach in the water [12, 13]. The following equations calculate the carrying capacity of the water:
Li=Lafish/PLP
where, Li: Total fish from FNC production (tons of fish/annum); Lafish: Total capacity of P-total from fish waste in lake/reservoir waters (gr P/year); PLP: P-total entering the lake from fish waste (kg P/ton fish).
Calculation of total P that escapes from FNC is calculated using the following formula:
LaFish=LFish X A
LFish=Δ[P] Ž ρ/(1- RFish)
RFish=X+[(1-X)R]
R=1/(1+0.747 ρ 0.507)
where, LFish: Capacity of P-total from fish waste per unit area of lake/reservoir (gr P/m2/year); R: P-total that remains with the sediment; RFish: Proportion of P-total dissolved into sediment after the floating net cage; X: The proportion of P-total that permanently goes into the lake bottom, 45-55%; A: The area of the lake waters (ha); Ž: Lake Average Depth (m); Ρ: Lake/reservoir water turnover rate (per year).
The allocation of the P (Phosphorus) pollution load in Lake Toba is calculated using the formula:
Δ[Pd]=[P]std-[P]i-[P]das
where, Δ[Pd]: allocation of P pollution load from the floating net cage (mg /m3); [P]std: maximum P content according to Water Quality Standard or Water Class and its trophic status (mg /m3); [P]i: P levels from lake monitoring results (mg/m3); [P]das: allocation of load P from the watershed (DAS).
Calculation of the amount of floating net cage fish farming waste, calculated by the formula:
PLP=FCRxPfeed-Pfish
where, PLP: P-total entering the lake from fish waste (Kg P/ton fish); FCR: Feed Conversion Ratio (ton feed/ton fish); Pfeed: P-total content in feed (Kg P/ton feed); Pfish: P-total levels in fish (Kg P/ton fish).
Lake Toba trophic status criteria refer to the following Table 1.
Table 1. Criteria for lake region trophic status
|
Trophic Status |
Average Level of Total-N (µg/l) |
Total P Average Content (µg/l) |
Average Rate of Khorofil-a (µg/l) |
Average Brightness (m) |
|
Oligotrophic |
≤ 650 |
< 10 |
< 2.0 |
≥ 10 |
|
Mesotrophic |
≤ 750 |
< 30 |
< 5.0 |
≥ 4 |
|
Eutrophic |
≤ 1.900 |
< 100 |
< 15 |
≥ 2.5 |
|
Hypertrophic |
> 1.900 |
≥ 100 |
≥ 200 |
< 2.5 |
Sources: [14].
In this section, we put forth a compelling case for revisiting the trophic status target of Lake Toba, shifting from an oligo-tropic to a meso-tropic state. This transition, combined with the adoption of a co-management approach, will lead to more holistic and sustainable management of the lake's resources. The hypothesis is that this dual approach will enhance ecological health, promote responsible tourism and fisheries, and contribute to the socio-economic well-being of local communities.
3.1 Current condition of the lake’s water quality indicators
The four indicators of water quality in observation stations were investigated and measured (Table 1). The resulting measurements would be used to compare the quality of water in one station relative to that in another observation station. One may also use oligotrophs as a benchmark for evaluating how far water in one station had been damaged by pollutants. However, the discussion would not be detailed since such a detailed discussion had been delivered in another article being under review in an international journal.
Water brightness level. This indicator showed the visibility of water. Water that contained lower organic matter would be more visible and vice versa. Thus, the length of visibility of the lake’s water measured in meters (m) could be used to show its quality. If the water contained many pollutants, the visibility of the water would be short.
Figure 2. Lake Toba water quality by water brightness level indicator
Figure 2 depicts the values of observation on this indicator at nine observation stations. Through Ministry of Environment Regulation No. 51/2004 regarding Sea Water Quality Standards, the Indonesian government determined that good water visibility of at least 3.0 m. There were only two stations, namely the ASR, and STH stations which did not pass this government standard. The outlet station was the worst one with visibility slightly less than 2.0 m, while STH station’s visibility was 2.6 m.
This was in contrast with the visibility of water in the three floating net cage stations (community floating net cage/CFN, company 1 floating net/PFN 1, and company 2 floating net cage/PFN2. Here the visibility was much better than that of water in the settlements-hotels station (STH) and Asahan River outlet (ASR). The lowest length of visibility out of these three stations was with water in community floating net cages which were only 3.5 m. In the company’s floating net cage 1 and company’s floating net cage 2, the water visibilities were, respectively, 4.1 and 4.6 m. A similar length of water visibility was also in Ports, Hill-field village, and the farm stations, which were, respectively, 4.2, 4.1, and 4.5 m.
Thus, as Figure 2 showed it could be concluded there was no observation station with water brightness of oligotrophic visibility. The highest class of water brightness was mesotrophic visibility. This was found only in five stations. PFN 1 and PFN 2 stations were among them. Meanwhile, the four other stations had water brightness of lower trophic visibility. This included a settlement - a hotel station. This conclusion looked surprising given the fact of public opinion that the FNC was the single largest source of pollutants drawn into Lake Toba.
The concentration of chlorophyll a. As Figure 3 revealed in almost all water observation stations, the concentration was high. Except for the ASR station, the values of chlorophyll a were far above the maximum value for oligotrophic water. The highest concentration was in the water of the port observation station which was almost 6 µg/l. This level of concentration made water in the port observation become belong to eutrophic status.
By contrast, the concentration of oligotrophic water was < 2.0 µg/l. Only water in the outlet observation station met this requirement for chlorophyll concentration. The concentration of chlorophyll in the water observations of the floating net cage was not so good, yet still within the range of concentration for mesotrophic water. The other water observation stations were also of mesotrophic water.
Figure 3. Lake Toba water quality by chlorophyll an indicator
Nitrogen Total (N-Total) Level. Wurtsbaugh remained the danger of high concentrations of nitrogen in waters since it was a nutrient for algae to grow [15]. High nitrogen concentrations would make algae overgrown in waters. This would endanger the life of other organisms living in the same waters since they competed for oxygen.
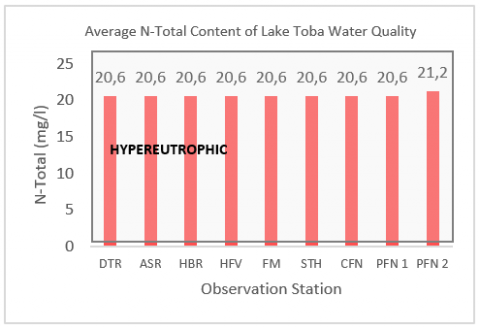
Figure 4. Lake Toba water quality by nitrogen total level indicator
The government of Indonesia limited ammoniac (NH3-N) containing waters up to 0.5 mg.L-1 [16]. The data presented in Figure 4 informed us that N-Total concentration in all the nine observation stations ranged between 20,6 and 21,2 mg/L. This range was far above the limit that the government had determined. Water in all these observation stations was not suitable for drinking water since it contained very high ammoniac content [17].
One may compare the nitrogen concentration in the nine observation stations with the standard value of nitrogen concentration for oligotrophic water as determined in Table 1 above. From this table, one could see that water in the nine observation stations was not oligotrophic but had hyper-eutrophic status.
Total Phosphor (P) Level. Nitrogen and phosphor were both pollutants. Panjaitan revealed that feed for tilapia cultured in FNC highly contained these chemical substances [4]. He claimed every day a significant part of the total feed used by FNC was drawn into the water and this contributed much to the degradation of the lake’s water.
Figure 5 depicts data about the concentration of phosphor in the nine observation stations. From these data, it could be seen the concentration of phosphor was very high, not only in the three floating net cage observation stations but also in the other stations. It can be compared with that in oligotroph water which was only < 10 µg/l (Table 2).
Figure 5. Lake Toba water quality by total phosphor level indicator
It was worth observing the concentration of phosphor in the water of the settlement-hotel (STH) station since hotels are an integral part of the tourism industry. The figure showed phosphor concentration in this water observation station (> 160 µg/l) was much higher than that in the rest observation stations. Indeed, it was much higher than in the three floating net cage observation stations which were less than 100 µg/l.
However, even though the phosphor concentration was so high in all stations, the water there was still suitable for a drink. The concentration of phosphor in water in all observation stations did not yet exceed the maximum that Indonesia Government Regulation Number 82 of 2001 concerning Management of Water Quality and Control of Water Pollution set for phosphor concentration in drinking water, which was ≤ 0.20 mgL-1.
Another important issue to explore was the tropic status of the observation stations regarding phosphor concentration. According to the standard value of phosphor content of water presented in Table 1 above, the STH observation station had been hyper-eutrophic status, while water in the rest had been eutrophic status. Thus, water in all nine stations could not be considered as being of good quality even though it was still suitable for a drink.
3.2 Current trophic status of Lake Toba and carrying capacity for fish culture in FNC system
Current Trophic Status of Lake Toba. Using the discussed four indicators of water quality in the nine observation stations one could estimate the lake’s trophic status. The estimated result is presented in Figure 6 below. This figure showed that the current trophic status of the lake was hyper-eutrophic. This may be contrasted with that in 2016. The study by the Environmental Department of North Sumatera Province conducted in 2016 claimed that the trophic status of Lake Toba was mesotrophic [18]. Thus, over the last five years (2016-2021) water quality of the lake has declined significantly. This was not surprising since no real efforts were spent to improve the water quality.
The second important point that the figure revealed was the fact that the decline of water quality was not only in the three floating net cage observation stations but also in the other observation stations. In addition, the trophic status of water in the floating net cage observation stations was not much different from that in the other stations. These facts implied that simply controlling the production of floating net cages would be not effective in improving the lake’s water quality. Making significant improvements in the lake’s water quality could only be possible if the release of pollutants into the lake from all sources is controlled effectively.
Figure 6. Index tropic status of Lake Toba
Estimation of Carrying Capacity. The carrying capacity of the lake to produce tilapia fish in a NFC farming system must be determined at the level that supported the achievement of the targeted trophic status of the lake. Thus, the first decision to make was to determine the trophic status suitable for Toba Lake. The determined tropic status would be used as a basis to calculate the carrying capacity of tilapia fish cage farming that facilitated the realization of the targeted trophic status.
The 2016 North Sumatera Environmental Department Study was the basis for the Government of North Sumatra Province’s regulation that limited the carrying capacity to only 10.000 tons per annum [18]. It was the lowest level of carrying capacity recommended by researchers who conducted a similar study in Toba Lake over the last two decades.
The emerging question was why such an extreme level was recommended. The 2016 North Sumatera Environmental Department study showed the current trophic status of the lake was mesotrophic. If the water quality is to be targeted for improvement as the World Bank demands, the future tropic status must be oligotrophic. It appears this was the logic behind the provincial government's decision for pursuing oligotrophic status for Lake Toba.
However, the provincial government seemed not aware of a national regulation that forbids the use of waters for economic and social activities if the supporting and carrying environmental capacity has been exceeded (Law No 32/2009 concerning Protection and Management of the Environment, article 17 paragraph (2). If the oligotrophic status was to be the target for the improvement of Lake Toba’s water quality, presumably the current development and promotion of international tourism in this lake must be abrupted and clear the area from all economic and social activities.
Clearly, this recommendation was irrational as the fact that the development of Lake Toba's tourism destination was a super-priority. In addition, the government of Indonesia had spent a huge sum of resources for its realization. What was to be rational for the provincial government to do was to correct its regulation regarding the targeted trophic status and carrying capacity of Lake Toba for the fishery in the cage culture. The government should, therefore, make the maintenance of mesotrophic status become a priority.
The collected data of indicators were used to estimate the carrying capacity of Toba Lake to produce tilapia in a floating net cage farming system. Table 2 presents the results. If used P-Total standard of 10 µg/L (oligotrophic), it was estimated that the carrying capacity was only 33.810 tons of tilapia per annum. But if used P-Total standard of 30 µg/L (mesotrophic), it was estimated that the carrying capacity for tilapia is 101,435 tons per annum (Table 2). For compromising the two extremes, this study recommended their middle value of 67.000 tons per annum as the carrying capacity.
Table 2. Water status and carrying capacity of Lake Toba
|
[P]std |
P-total Levels (µg/L) |
Carrying Capacity (tonnes/year) |
|
Oligotrophic |
10 |
33.810 |
|
Mesotrophic |
30 |
101.435 |
Managing Water Quality of Toba Lake. Raising the carrying capacity of the lake for tilapia in-cage production did not mean the improvement of its water quality was no more important. Good quality water was important for the tourism industry. However, this goal has not been achieved. Instead, this study found the lake’s water quality had declined quite significantly.
All must have been aware of the importance of improving the water quality of Lake Toba for the development of the tourism industry as well as the lake's sustainability. Controlling the discharge of pollutants into the lake from all activities on and around the lake must be a key to improving its water quality. Recent studies looked agreed with this thesis, but they failed to identify all entities that released pollutants and the magnitude of their contribution. Instead, they focused only on controlling the release of pollutants from the floating net cage. Thus, the study and recommendation are solely focusing on the carrying capacity of Lake Toba for the fish floating net cage culture system.
Another crucial factor needed to integrate into a system that controlled pollution discharge was the fact Lake Toba was open access resource. Legally, the lake was a state-owned resource. However, the government had never exercised its ownership by denying access to local people to use the resource.
Far before the country became independent from colonial occupation, local people had traditionally used the lake resource to support their life and community. Having such very long free access made them become assuming to have a traditional right for its usage. It would be unfair if the government denied their traditional right by rigidly enforcing state ownership.
Another hindrance for the government to make the lake free of polluting activities was the fact that surveillance of the area was very difficult and too costly to implement. Under such circumstances, it was not plausible to implement a top-down approach to control pollution as the provincial government presently did.
Hardin attracted attention to the sustainability of communal property rights (CPR) like Toba Lake [19]. He claimed that CPR would be ruined if allowed to remain as CPR. The root of the problem is that users (stakeholders) have no incentive to carry out conservation activities. Instead, they had great courage to make maximum exploitation of it for their own welfare.
Besides overexploitation and degradation due to individual self-interest in Lake Toba, another related example is unregulated agricultural runoff. Farmers around Lake Toba use excessive fertilizer without regulation, causing nutrient-rich runoff to enter the lake. The impact is that nutrient loading causes eutrophication, damages water quality, and aquatic life, and has the potential to cause algal blooms.
Thus, according to Hardin, the solution is to make it state property (state property rights; SPR) or private property rights (PPR). Conceptually, privatizing CPR as an effort to prevent its destruction as Hardin suggests makes sense. However, it seems that the implementation is not without serious problems, so privatization is not the right choice. If the intended privatization is to distribute CPR to users so that each is responsible for its plots, then Hardin's suggestion is almost impossible to apply to aquatic resources, especially large areas such as Lake Toba.
Ostrom rejected Hardin’s claim. According to her, exploitation of open-access natural resources would not necessarily be ended up with tragedy as Hardin envisioned [20]. Supporting her point, she showed evidence from different countries on different continents where open-access natural resources were still well-conserved even though they had been exploited for a long period.
According to Ostrom, the key to success is the existence of institutions (rules) that are built and enforced together. These rules have two main functions, namely facilitating cooperation between stakeholders and preventing opportunistic behavior that will undermine the spirit of this cooperation.
Clearly, the degradation of the resource was not the users' intention. They just ignored it. They intended to take benefit as maximum as possible from its exploitation. In a market economy, such a maximization strategy was taken only by an economic actor with a short-run business orientation.
Thus, Hardin's claim was applied only if the stakeholders' orientation was short-run maximization of the benefit obtained from the exploitation of the resource. If their business orientation was not a short run, but for long-run business growth and sustainability, his claim would not be tenable. This was because their long-run orientation could be realized only if all stakeholders cooperate to maintain the resource sustainably. Such cooperation would very likely prevail among stakeholders much dependent on sustainable flow benefits obtained from the use of the resource in maintaining their family's welfare. However, the prevalence of such long-run orientation among users did not automatically make the resource become well maintained.
An example is community-based water quality monitoring activities. Local communities form cooperatives to monitor water quality parameters regularly and share findings. As a result, early detection of pollution sources enables timely actions, such as negotiations with upstream industries to reduce pollution.
To achieve those goals the following requirements must be met. Users must agree to cooperate for the conservation of the resource. They also must innovate and agree on rules for resource exploitation. In addition, there must be mechanisms for effective enforcement of the agreed rules [21].
In practice, Ostrom’s insights into managing natural resources had been integrated into a model of managing natural resources which was popularly known as the co-management model. By this model, cooperative management was exercised. All stakeholders cooperated with the government at all levels in the exploitation and conservation of the communally owned resource. To facilitate their cooperation, they developed rules and enforced them collectively.
The co-management model has been widely used in seawaters with the rich fish resources in some Latin countries [22]. Its success in managing conflicts of interest in the use of natural resources made this model became popular not only for the management of seawater resources but also for managing conflicts of interest in the exploitation of forest resources [23]. Improvement of Toba Lake's water quality was a must. Accordingly, the North Sumatra government should change its approach to controlling pollutants discharged into Toba Lake from a top-down approach to a co-management model.
A co-management model is a collaborative approach to resource management that involves the joint participation of multiple stakeholders to ensure sustainable exploitation and utilization of a shared resource. In the Context of Lake Toba, the co-management model would encompass several key components to address the challenges and opportunities specific to the lake and its surrounding communities, such as Stakeholder Engagement (various stakeholders, including local communities, government agencies, indigenous groups, tourism operators, environmental organizations, and fisheries associations), would actively participate in decision-making processes and contribute their knowledge and perspectives collaboratives planning and decision-making, resource assessment and monitoring, sustainable tourism management, fisheries management, legal and institutional framework and long term commitment.
It's necessary to dig deeper into the specific instruments that could be implemented to support the co-management model in Lake Toba. These instruments play a crucial role in translating the theoretical framework of co-management into practical actions that can effectively sustain the lake's resources and ecosystem.
However, the model needed to equip with the following instruments to make it effective. First, all stakeholders were obliged to use conservation technology that prevented the direct discharge of a pollutant into the lake. Second, all commercial business entities must have a legal permit from the government. This permit could be used as an instrument to discipline them in treating their pollutant. Third, the development of a monitoring and evaluation system for water quality. All these instruments must be treated as an integral part of the co-management model
Potential challenges and limitations associated with implementing a co-management model for Lake Toba provide a well-rounded perspective on the feasibility and complexities of this approach. Here are some challenges and limitations that could be addressed:
(1) Stakeholder Diversity and Interest: Lake Toba involves a diverse range of stakeholders, each with varying interests, power dynamics, and priorities. Achieving consensus and effective collaboration among these stakeholders may prove challenging.
(2) Resources Constraints: Implementing a co-management model requires financial resources for capacity-building, monitoring equipment, and enforcement mechanism. Securing consistent funding and allocating resources fairly among stakeholders could be difficult.
(3) Institutional and Legal Frameworks: Establishing clear legal and institutional structures that accommodate the interests of all stakeholders may require significant negotiation and cooperation among governmental agencies, local communities, and private enterprises.
(4) Conflict Resolution: Addressing conflicts and disagreements among stakeholders requires effective mechanisms for dispute resolution. Differing perspectives and interests could potentially lead to gridlock or disagreements.
(5) Political and Socioeconomy Factors: Political interference, changes in leadership, or economic shifts could impact the stability and continuity of co-management efforts.
(6) Long-Term Commitment: Co-management is a long-term endeavor. Sustaining stakeholder engagement, commitment, and enthusiasm over time can be challenging.
Addressing these challenges and limitations requires careful planning, stakeholder engagement, and adaptive strategies. While the co-management model offers significant benefits, acknowledging and proactively working to mitigate these challenges is essential for its successful implementation in the context of Lake Toba.
4.1 Conclusion
In contrast to the common opinion, the floating net cage was not a single major source of a pollutant that deteriorated Toba Lake. All entities located around the lake disposed of pollutants into the lake. Not floating net cages but hotels and restaurants were the most serious source of pollutants. All these facts implied that closing the floating net cage industry would not be an effective way to improve the water quality of the lake. This study found that the water quality of Toba Lake had become worsened, in which if five years ago based on the provincial government study, the water quality was mesotrophic, recent study shows that it is almost reaching eutrophic levels. According to this study, the carrying capacity of Toba Lake for tilapia net floating cages is estimated to be 67.000 tons per annum and the water quality is mesotrophic.
4.2 Recommendation
Based on the calculation of Lake Toba's water quality and its carrying capacity, it is recommended that the provincial government revised its regulations about the target for future water quality of Lake Toba and its carrying capacity for tilapia net floating cage. The revisions are as follows: (1) The new regulation about the improvement of water quality should make mesotrophic water quality the target to be achieved, (2) The new regulation about carrying capacity should permit floating net cage production of tilapia up to 67.000 tons per annum, (3) It is suggested that the government implemented a co-management model to control the discharge of a pollutant into Toba Lake, (4) The model should be supported by some instruments such as the compulsory use of conservation technology by all stakeholders, compulsory legal permit for commercial stakeholders, and a system of monitoring and evaluation.
The authors are thankful to The Indonesia Endowment Funds for Education, the Indonesia Ministry of Finance, and also the Department of Marine Affairs and Fisheries of North Sumatra Province for the support to conduct this research.
[1] Sitompul, F., Ramli, M., Bathara, L. (2015). Analysis of fish cultivation business conditions floating net cage system at Lake Toba (Case of Untemungkur Village, Muara District, Tapanuli Utara District, North Sumatra Province). Online Journal of Faculty of Fisheries and Marine Science Students, 2(1).
[2] Pandiangan, R. (2014). Analysis of differences in fish cage business income in Lake Toba Waters (Case study: Bandar saribu zone, Haranggaol Village, Haranggaol Horisan District, Simalungun Regency). North Sumatera University. North Sumatera. https://repositori.usu.ac.id/handle/123456789/51508.
[3] Alamsjah, I. (2016). Presentation of the ministry of tourism RI for KIDI 6, Yogyakarta. https://web.kominfo.go.id/sites/default/files/Paparan%20Kemenpar%20untuk%20KIDI%202016.pdf.
[4] Panjaitan, P. (2009). Monitoring of the carrying capacity of floating net cage cultivation activities on Lake Toba. Aquatic. Visi, 17(3): 290-300.
[5] World Bank. (2018). Improving the water quality of Lake Toba, Indonesia. https://documents.worldbank.org/en/publication/documents-reports/documentdetail/899651564470684307/improving-the-water-quality-of-lake-toba-indonesia.
[6] Government of North Sumatera Province. (2017). Surat Keputusan Gubernur Sumatera Utara No. 188.44/2209/KPTS/2017 regarding Lake Toba Trophic Status. https://muspera.menlhk.go.id/Perpus_search/detail/24190.
[7] Government of North Sumatera Province. (2017). Surat Keputusan Gubernur Sumatera Utara No. 188.44/213/KPTS/2017 regarding Supporting and Carrying Capacity of Lake Toba. https://muspera.menlhk.go.id/Perpus_search/detail/24190.
[8] Pinem, E.P., Asmawi, S., Rahman, A. (2020). Monitoring of the carrying capacity of floating net cage cultivation activities on Lake Toba. Aquatic, 3(1): 1-63. https://doi.org/10.21107/sml.v3i1.7610
[9] Syawal, M.S., Maghfiroh, M. (2020). Sumatran major lakes: Limnological overviews. In IOP Conference Series: Earth and Environmental Science, 535(1): 012064. https://doi.org/10.1088/1755-1315/535/1/012064
[10] Lukman, H.H., Subehi, L., Dina, R., Mayasari, N., Melati, I., Sudriani, Y. (2021). Loads of pollution to Lake Toba and their impacts. International Journal on Advanced Science, Engineering and Information Technology, 11(3): 930-936. https://doi.org/10.18517/ijaseit.11.3.12733
[11] Tanjung, D., Hutagaol, M.P. (2023). The role of agribusiness fisheries floating net cages in supporting the economy of the Lake Toba Region. Resmilitaris, 13(2): 5263-5273.
[12] Beveridge, M.C.M. (1996). Carrying capacity models and environment impact. Technical report, FAO Fish. https://www.researchgate.net/profile/Malcolm-Beveridge/publication/38979747_Cage_and_Pen_Fish_Farming_Carrying_Capacity_Models_and_Environmental_Impact/links/585a75d108ae3852d256fc33/Cage-and-Pen-Fish-Farming-Carrying-Capacity-Models-and-Environmental-Impact.pdf.
[13] Hutagaol, M.P., Tanjung, D., Nirmala, K., Hastuti, Y.P. (2021). Research report: Conflict resolution in the use of Lake Toba natural resources towards development of international fisheries and tourism. CARE LPPM IPB. https://care.ipb.ac.id/wp-content/uploads/2022/02/Bahan-upload-Naskah-akademik-1.pdf.
[14] Ministry of Environment of Republic Indonesia. (2009). Government Regulation Number 28 of 2009 concerning Water Pollutant Load Capacity in Lakes and Reservoirs. https://jdih.menlhk.go.id/new2/home/portfolioDetails/28/2009/9.
[15] Wurtsbaugh, W.A., Pearl, H.W., Dodds, W.K. (2019). Nutrients, eutrophication and harmful algal blooms along the freshwater to 631 marine Continuum. Wires Water, 6: 1-27. https://doi.org/10.1002/Wat2.1373
[16] Ministry of Environment of the Republic of Indonesia. (2001). Government regulation number 82 of 2001 concerning management of water quality and control of water pollution. https://ppkl.menlhk.go.id/website/filebox/830/191010121614PP%20NO%2082%20TH%202001%20Tentang%20Pengelolaan%20Kualitas%20Air%20dan%20Pengendalian%20Pencemaran%20Air.pdf.
[17] Davidson, E.A., Suddick, E.C., Rice, C.W., Prokopy, L.S. (2015). More food, low pollution (Mo Fo Lo Po): A grand challenge for the 21st century. Journal of Environmental Quality, 44(2): 305-311. https://doi.org/10.2134/Jeq2015.02.0078
[18] North Sumatera Environmental Department. (2017). Lake Toba trophic status study.
[19] Hardin, G. (1968). The tragedy of the commons author(s). Science, New Series, 162(3859): 1243-1248. https://doi.org/10.1126/science.162.3859.1243
[20] Ostrom, E., Dietz, T., Dolsak, N., Stern, P., Stonich, S., Weber, E.U. (2002). The Drama of the Commons, National Research Council. The National Academy Press, Washington, DC. https://doi.org/10.17226/10287
[21] Ostrom, E., Chang, C., Pennington, M., Tarko, V. (2012). The future of the commons-beyond market failure and government regulation. Institute of Economic Affairs Monographs. http://doi.org/10.2139/ssrn.3916843
[22] Albornoz, C., Glückler, J. (2020). Co-management of small-scale fisheries in Chile from a network governance perspective. Environments, 7(12): 104. http://doi.org/10.3390/environments7120104
[23] Ballet, J., Bazin, D.J.A., Komena, B.K. (2020). Unequal capabilities and natural resource management: The case of Côte d’Ivoire. World Development, 134: 105016. https://doi.org/10.1016/j.worlddev.2020.105016