M. A. Abua | Devalsam I. Eni* | Anthony I. Iwara | Evaristus Idaga Igelle![]() | O. E. Egbai | S. W. Ashua | Bassey J. Bassey
| O. E. Egbai | S. W. Ashua | Bassey J. Bassey![]() | Uquetan Ibor Uquetan
| Uquetan Ibor Uquetan![]() | S. Owolum | Iheoma O. Iwuaanyawu
| S. Owolum | Iheoma O. Iwuaanyawu![]() | Christiana O. Akpoduado
| Christiana O. Akpoduado![]()
© 2023 IIETA. This article is published by IIETA and is licensed under the CC BY 4.0 license (http://creativecommons.org/licenses/by/4.0/).
OPEN ACCESS
The study examined rainfall variability pattern and its implication on groundwater recharge in Obudu. Data on rainfall was obtained from the Nigerian Meteorological Agency office Obudu Dam, while Chaturvedi Empirical Method was employed to generate data on groundwater recharge. Results from the analysis revealed that rainfall correlated positively with groundwater recharge (r=0.90; p>0.05). The long term means from 1982-2012 for the region was 2138.0mm. Rainfall of 2001 recorded the highest negative departure of 41.1 per cent below the mean (below normal), and in 2012, it recorded the highest positive departure of 56.1 per cent above normal. The result revealed that rainfall events below the long-term mean would result in low recharge which could pose serious challenges to water resources management. The study recommended the need to create an effective rainwater capture and storage system to reduce water scarcity problem during period of shortage.
rainfall variability, groundwater recharge, hydroclimatological parameter, Obudu
Rainfall is a key determinant of water resource availability in any region of the world, be it surface or groundwater resource. This important hydroclimatological parameter is highly variable in space and time [1, 2]. Groundwater recharge refers to the accumulation of rainfall water in the aquifer. It is a vital component of the hydrological cycle, in which surface water, finds its way into the subsurface layer replenishing groundwater quantity. Basically, there are two types of groundwater recharge: natural and artificial. Natural groundwater recharge is a process through which the subsurface hydrology is replenished without human technology. This is usually sourced from rainfall, rivers, lakes, streams and snowmelt. Artificial recharge, on the other hand, is an anthropogenic technology used to trap water in a basin during heavy rainfall, and such water is allowed to percolate into the water table. The latter method is applied in most water stressed areas of the world where the aquifer has been depleted by excessive groundwater withdrawal or mining of groundwater. It is commonly practised in developed countries like United States of America, and also in arid and semi-arid countries such as Pakistan, China , UAE, Israel , India, Libya, and Niger Republic among others [3-6].
In Africa, rainfall plays a principal role in recharging water table (aquifer). The dynamic trend observed in rainfall pattern and global temperature rise has drawn the attention of water resource experts. Scientific facts abound to this claim that changing trend in climatic variables has been attributed to global climate change. A dip in rainfall below its long-term mean impact greatly on groundwater supply. In most regions of the tropics, anomaly and variability in rainfall have led to two extreme events: flood and drought. Both of these rainfall events resulted in chain of ecological problems ranging from failure of crops yield, loss of lives and properties, and disease outbreak. The nature of these problems may lead to spatio-temporal imbalances in the hydrological regime creating a scenario where some areas have water supply surplus, others water supply deficit. In this vein, Taylor et al. [7] have reported that a rise and/or a fall in the distribution of rainfall will give rise to more changes in river discharge and soil moisture. The implication is that a negative change will lead to freshwater shortage, while a positive change may lead to flooding, increase in groundwater levels and recharge. Interestingly, researches on analysis of rainfall on groundwater recharge have been carried out in most arid and semi-arid countries, but in Nigeria, the very few works done are found in semi- arid states and parts of western Nigeria with very scanty studies in the east and southern parts. Based on this background, the present study assessed the effect of rainfall variability on groundwater recharge in Obudu Cross River State.
2.1 Study area
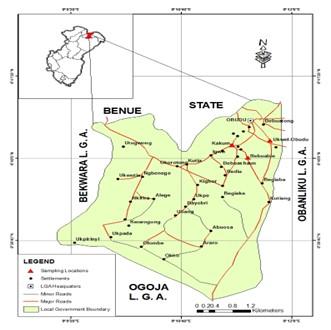
Obudu Local Government Area of Cross River State is located between Longitudes 08° 55′E and 09° 15′E and Latitude 06° 22′N and 06° 40′N (Figure 1). The area lies within the sub-humid tropical climate of tropical monsoon category and savannah climate based on koppen’s classification, with total rainfall between 1200mm and 2000mm. The rainfall has double peaks between June/July and the second peak around September/October. Mean temperature is above 21.1℃ [8, 9]. The area is ideal for the present study due to challenges in extracting groundwater for domestic use mostly in urban areas.
Figure 1. Showing sampling locations
2.2 Collection of rainfall and groundwater recharge data
Data on rainfall, temperature and humidity were obtained from the Nigerian Meteorological Station at Obudu, while data on groundwater recharge were generated using the Chaturvedic Empirical Model.
2.3 Data analysis
The data collected was statistically treated using tables, average, multiple correlation and multiple regression analysis.
3.1 Estimation of groundwater recharge
The Chaturvedi Empirical method of groundwater recharge generated for monthly and annual recharge from 1982-2012 is displayed in Table 1. The fluctuational pattern in the inter-annual recharge depicts a rise and fall with the highest peak in 1987. From 1988-2008 there was steady fluctuation of groundwater recharge accentuated by rainfall variability.
3.2 Influence of rainfall, temperature and evaporation on groundwater recharge
The result showed in Table 2 showed there was a very strong multiple correlation (0.939) between rainfall, temperature, evaporation and groundwater recharge. The coefficient of multiple determination (R2) indicated that 86.4% of the changes in groundwater recharge was accounted for by the combination of rainfall, temperature, evaporation. The result further indicated that rainfall (t=10.896, p<0.05) and temperature (t=3.352, p<0.05) exercised significant influence on groundwater recharge. The result obtained shows that rainfall and temperature are substantial determinant of groundwater recharge in the area. The positive regression coefficient observed on rainfall simply suggests increase in groundwater recharge with the increase in rainfall, while increase in temperature in the area will result in a decrease in groundwater recharge. Similar result was reported by Pacheco [3] when they found a positive relationship between precipitation and groundwater recharge. This result obtained in the present study is expected because temperature brings about a significant change and reduction in groundwater recharge because quantities of water for groundwater recharge will be lost into the atmosphere. On the other hand, the positive regression coefficient between rainfall and groundwater recharge is expected as rainfall is the fundamental component of groundwater recharge; as such, increase in rainfall amounts will have a corresponding impact on the rate of recharge. In addition, the strength of each factor using the values of standardized regression coefficients (beta) suggests that between the two variables, rainfall tends to exert a substantial influence on groundwater recharge in the area.
3.3 Mean annual departure from normal from 1982-2012
The result in Table 3 showed both positive and negative departure in climatic parameters in the period under review. The result revealed that in 1987 and 2012 a dramatic change in annual rainfall of 3007.8mm and 3347.3mm, and recharge of 229.7mm and 201.4mm was recorded as the highest in the period. The increase or decrease in rainfall observed does nott correspond with the change in groundwater recharge. This agrees with the findings on the study of Edet et al. [10], Xu and Beekman [11] in Nigeria and south Africa respectively that showed decrease in rainfall due to climate change. Normal temperature for period was 32.8℃ and evaporation was 42.8mm.
3.4 Inter-annual variability of rainfall in Obudu
Analysis of the inter-annual variation of rainfall in Obudu from 1982-2012 showed a regular pattern of fluctuations in the annual values (Table 4). A consistent increase and decrease were observed in the period. A steady increase in rainfall was observed from 2006 to 2012. The result further revealed a distribution of 16 anomalous situations above the mean on one side and 15 anomalous situations below the mean on the other side. It also revealed that 1984-1990, 1995, 1997, 1998, 2002 and 2007-2012 were periods of above normal rainfall correlating with positive standardized rainfall anomalies; with 2012 indicating the maximum positive deviation from the normal of approximately 56.1 percent. A close inspection of the table showed a clear indication of inter-annual variability. This tends to have a follow-up effect on inter-annual groundwater recharge.
3.5 Intra-annual rainfall variability (mean monthly) for Obudu 1982-2012
The result in Table 4 shows mean monthly distribution of rainfall for the period 1982-2012. A continuous but steady increase with a break in August is observed. Then, a sharp rise in September and a decline in subsequent months. This reveals a of double maxima rainfall regime (a- bimodal) common in Southern Nigeria which validate studies by Ologunorisa and Tersoo [12] in Makurdi, Southwestern Nigeria, and in Enugu Metropolis and Calabar [2, 12-14]. The first peak in June was lower than the second peak in the month of September during the period. The region has an effective seven months rainfall, from April to October in recharging the surface and sub-surface basin [15-22].
Table 1. Monthly and annual recharge from 1982-2012
|
Year |
Jan. |
Feb. |
Mar. |
Apr. |
May |
June |
July |
Aug. |
Sept. |
Oct. |
Nov. |
Dec. |
Total |
|
1982 |
6.5 |
3.6 |
8 |
12 |
13.4 |
26.1 |
16 |
16.1 |
21.5 |
22.2 |
-4.3 |
-3.1 |
138 |
|
1983 |
-5 |
-5 |
2.5 |
1.4 |
20.3 |
17.7 |
23.4 |
23.8 |
28.3 |
8.9 |
-5 |
-5 |
106.3 |
|
1984 |
-5 |
4.4 |
17.7 |
15.3 |
23.3 |
27.7 |
21.7 |
14 |
27 |
23.2 |
21.7 |
-5 |
186 |
|
1985 |
2.2 |
-5 |
15.9 |
20.7 |
30.3 |
28.4 |
25.4 |
23.8 |
26.6 |
23.3 |
15.6 |
-4.1 |
203.1 |
|
1986 |
-5 |
10.2 |
22.1 |
13.8 |
21.7 |
15.9 |
30.7 |
21.3 |
26.6 |
27 |
11.9 |
-5 |
191.2 |
|
1987 |
4.3 |
6.5 |
18.1 |
21.1 |
24.2 |
25.6 |
24.7 |
29.5 |
23.9 |
26.4 |
13.3 |
12.1 |
229.7 |
|
1988 |
8.2 |
5.5 |
16.8 |
21.9 |
19.5 |
30 |
25.3 |
15.5 |
30.9 |
20 |
14.6 |
8.7 |
216.9 |
|
1989 |
-5 |
-5 |
6.7 |
14.3 |
19.1 |
25.8 |
16.4 |
29.6 |
25.7 |
26 |
-2.2 |
-5 |
146.4 |
|
1990 |
6.2 |
-5 |
-5 |
18.8 |
14.2 |
26.5 |
24.6 |
19.3 |
29.6 |
25.1 |
-2.8 |
8.3 |
159.8 |
|
1991 |
-5 |
-5 |
3.6 |
14.4 |
24.5 |
25.2 |
22.7 |
23.2 |
16.9 |
23.1 |
-5 |
-5 |
133.6 |
|
1992 |
-4.8 |
-4.7 |
4.8 |
15.2 |
24.1 |
22.6 |
20.4 |
16.5 |
20.9 |
14.3 |
-4.3 |
-5 |
120 |
|
1993 |
-4.9 |
2.9 |
10.3 |
9 |
17.6 |
17.7 |
24.4 |
17.5 |
23.5 |
15.7 |
9.9 |
2.4 |
146 |
|
1994 |
-5 |
-5 |
-3.5 |
14.4 |
20 |
15.1 |
23 |
21.6 |
24.9 |
21.3 |
-5 |
-5 |
116.8 |
|
1995 |
-5 |
-5 |
11.3 |
17.7 |
18.5 |
22.1 |
21.3 |
22.3 |
28.3 |
21.9 |
15.2 |
-5 |
163.6 |
|
1996 |
-5 |
-4.5 |
8.8 |
7.9 |
21.7 |
13.2 |
19 |
17.4 |
27.1 |
19.8 |
-5 |
-4.4 |
116 |
|
1997 |
-5 |
-5 |
11 |
17.4 |
24.7 |
24 |
25.1 |
21 |
22.6 |
24.8 |
4.8 |
-5 |
160.4 |
|
1998 |
-5 |
-5 |
-4.3 |
12.3 |
21 |
18.8 |
15.1 |
33.4 |
30.5 |
22.4 |
-5.1 |
-5 |
129.1 |
|
1999 |
10.8 |
7.6 |
3.1 |
10 |
17.9 |
20.1 |
23 |
16.8 |
20.1 |
22.9 |
7.6 |
-5.1 |
154.8 |
|
2000 |
-4.9 |
-5 |
-5 |
17.9 |
15.4 |
24.2 |
22.9 |
16.4 |
22.2 |
22.3 |
-5 |
-5 |
116.4 |
|
2001 |
-5 |
-4.6 |
2.2 |
9.9 |
15.6 |
18.6 |
13.1 |
18.3 |
23.7 |
17.1 |
-5 |
-5 |
98.9 |
|
2002 |
-5 |
-5 |
9.6 |
21.9 |
14.9 |
28 |
24.2 |
22.8 |
26.8 |
20 |
-2.5 |
-5 |
150.7 |
|
2003 |
3.3 |
-5 |
-4.5 |
17.9 |
16.1 |
26.1 |
26.4 |
18.6 |
18 |
20 |
4.9 |
-5 |
136.8 |
|
2004 |
-5 |
-5 |
-3 |
-2.2 |
12 |
22.8 |
15.4 |
14.7 |
24.5 |
15.9 |
6.2 |
-5 |
91.3 |
|
2005 |
4.9 |
-0.9 |
2.1 |
12.3 |
18.7 |
19.1 |
20.3 |
18.6 |
20.9 |
28.2 |
8.1 |
-5 |
147.3 |
|
2006 |
-5 |
8.7 |
6.8 |
11.3 |
23.7 |
19.8 |
19.4 |
18.3 |
27.1 |
20.4 |
-4.8 |
-5 |
140.7 |
|
2007 |
-5.1 |
-3.3 |
5 |
14.8 |
21.7 |
20.1 |
17.6 |
21.8 |
32.8 |
30 |
13.1 |
-3.4 |
165.1 |
|
2008 |
4.9 |
-5 |
7.1 |
17.6 |
29.5 |
26.3 |
17.2 |
28.3 |
23.5 |
16.5 |
-5 |
12.2 |
173.1 |
|
2009 |
9.2 |
-2 |
-5 |
26.9 |
22.1 |
25.9 |
28.3 |
24.7 |
24.2 |
26.4 |
8 |
-5 |
183.7 |
|
2010 |
-5 |
-5 |
4.5 |
15.1 |
27 |
27.6 |
21.6 |
20.6 |
22.1 |
31.4 |
4.7 |
-5 |
159.6 |
|
2011 |
-5 |
8.2 |
3.7 |
16 |
27.7 |
23.9 |
16.7 |
29 |
33.3 |
25.6 |
-4.7 |
-4.7 |
169.7 |
|
2012 |
4.5 |
-1.3 |
-5 |
16.3 |
31.6 |
30.8 |
23.3 |
32.8 |
30.6 |
29 |
13.8 |
-5 |
201.4 |
Table 2. Summary of multiple regression analysis of the influence of rainfall, temperature and evaporation on groundwater recharge
|
Predictor Variables |
Coefficients |
||
|
b |
β |
t-value |
|
|
Rainfall |
.054 |
.812 |
10.896* |
|
Temperature |
-9.739 |
-.247 |
3.352* |
|
Evaporation |
-.149 |
-.034 |
0.447 |
|
Test Results |
|
|
|
|
F- value |
64.755* |
|
|
|
R |
0.937 |
|
|
|
R2 |
0.864 |
|
|
|
Constant |
364.418 |
|
|
*Significant at 5% significance level
Table 3. Percentage departure of climatic variables from long-term mean
|
Year |
% Departure of Rainfall from Long-Term Mean |
% Departure of Temperature from Long-Term Mean |
% Departure of Evaporation from Long-Term Mean |
|
1982 |
-17.4 |
-0.6 |
-15.4 |
|
1983 |
-24.4 |
-0.3 |
14.5 |
|
1984 |
16.9 |
-1.8 |
-2.2 |
|
1985 |
38.6 |
-2.4 |
-7.8 |
|
1986 |
22 |
-4.8 |
-13.1 |
|
1987 |
40.7 |
-5.4 |
-8.9 |
|
1988 |
27.4 |
-7.6 |
-16.2 |
|
1989 |
2.8 |
-3.3 |
2.2 |
|
1990 |
5.4 |
O |
-5.1 |
|
1991 |
-8.8 |
-0.9 |
-21.4 |
|
1992 |
-25.4 |
-1.2 |
-0.2 |
|
1993 |
-25.2 |
-0.3 |
-3.3 |
|
1994 |
-20.1 |
-0.3 |
-10 |
|
1995 |
2.0 |
0.9 |
-1.3 |
|
1996 |
-28.3 |
1.2 |
-18.9 |
|
1997 |
4 |
0 |
-1.9 |
|
1998 |
0.6 |
3.3 |
11.8 |
|
1999 |
-20.5 |
0 |
-0.2 |
|
2000 |
-19.8 |
0.9 |
32.1 |
|
2001 |
-41.4 |
1.8 |
73.2 |
|
2002 |
3.8 |
1.8 |
5.1 |
|
2003 |
-15 |
2.7 |
1.1 |
|
2004 |
-28.7 |
2.4 |
1.5 |
|
2005 |
-16.6 |
2.1 |
8 |
|
2006 |
-15 |
3.0 |
2.2 |
|
2007 |
11.6 |
1.8 |
3.5 |
|
2008 |
10.1 |
2.1 |
3.3 |
|
2009 |
28 |
2.7 |
3.5 |
|
2010 |
12.2 |
4.2 |
-4.2 |
|
2011 |
23.5 |
1.8 |
-1.7 |
|
2012 |
56.1 |
1.5 |
-6 |
Table 4. Standardized anomalies and coefficient of variability
|
Year |
Annual Rainfall (mm) |
Mean Annual Rainfall |
Deviation |
Standard Deviation |
Standardized Anomaly |
Co-efficient of Variability (%) |
|
1982 |
1765.7 |
147.1 |
-370.2 |
66 |
-0.72 |
0.29 |
|
1983 |
1616.5 |
134.7 |
-519.4 |
92 |
-1.01 |
0.26 |
|
1984 |
2499.9 |
208.3 |
364 |
65 |
0.71 |
0.41 |
|
1985 |
2963.8 |
247.0 |
827.9 |
148.6 |
1.62 |
0.48 |
|
1986 |
2610.5 |
217.5 |
474.6 |
85.2 |
0.93 |
0.42 |
|
1987 |
3008.6 |
250.7 |
871.9 |
156.5 |
1.70 |
0.49 |
|
1988 |
2719.5 |
226.9 |
583.6 |
104.8 |
1.14 |
0.44 |
|
1989 |
2197.6 |
183.1 |
61.7 |
11.08 |
0.12 |
0.36 |
|
1990 |
2254.5 |
187.9 |
74.5 |
13.3 |
0.15 |
0.37 |
|
1991 |
1947.9 |
162.3 |
-188 |
33.7 |
-0.37 |
0.32 |
|
1992 |
1594.6 |
132.9 |
-541.3 |
97.2 |
-1.06 |
0.26 |
|
1993 |
1597.2 |
133.1 |
-538.7 |
96.7 |
-1.05 |
0.26 |
|
1994 |
1706.5 |
142.2 |
-429.4 |
77.1 |
-0.84 |
0.28 |
|
1995 |
2180.5 |
181.7 |
44.6 |
8 |
0.09 |
0.35 |
|
1996 |
1532.5 |
127.7 |
-603.4 |
108.3 |
-1.18 |
0.25 |
|
1997 |
2239.8 |
186.7 |
103.9 |
18.6 |
0.20 |
0.36 |
|
1998 |
2150.4 |
179.2 |
14.5 |
2.6 |
0.03 |
0.35 |
|
1999 |
1698.6 |
141.6 |
-437.3 |
78.5 |
-0.85 |
0.28 |
|
2000 |
1712.7 |
142.7 |
-423.2 |
76 |
-0.83 |
0.28 |
|
2001 |
1251.4 |
104.3 |
-884.5 |
158.8 |
-1.73 |
0.20 |
|
2002 |
2220.7 |
185.1 |
84.8 |
15.2 |
0.17 |
0.36 |
|
2003 |
1815.8 |
151.3 |
-320.1 |
57.4 |
-0.63 |
0.30 |
|
2004 |
1523.9 |
127.0 |
-612 |
109.9 |
-1.20 |
0.25 |
|
2005 |
1781.6 |
148.5 |
-354.3 |
63.6 |
-0.69 |
0.29 |
|
2006 |
1816.3 |
151.4 |
-319.6 |
57.4 |
-0.62 |
0.30 |
|
2007 |
2373.1 |
197.8 |
237.2 |
42.6 |
0.46 |
0.39 |
|
2008 |
2354.7 |
196.2 |
218.8 |
39.2 |
0.43 |
0.38 |
|
2009 |
2737.9 |
228.2 |
602 |
108.1 |
1.18 |
0.45 |
|
2010 |
2398.7 |
199.9 |
262.8 |
47.2 |
0.51 |
0.39 |
|
2011 |
2640.2 |
220.0 |
504.3 |
90.5 |
0.99 |
0.43 |
|
2012 |
3347.3 |
278.9 |
1211.4 |
217.5 |
2.37 |
0.54 |
Decline in groundwater recharge results in low groundwater yield within the aquifer, also to water shortage. This scenario is observed in the fall and fluctuations pattern of the water table. The dimension of this reduction is uncertain consequent upon the vagaries of climatic variables. The study established that there is a relationship between recharge and climatic variables (rainfall amount, temperature and evaporation). It was observed that rainfall amount correlated positively with groundwater recharge, while an inverse relationship was found to exist between recharge with temperature and evaporation. The regression model revealed R2 value of 0.878, meaning that 87.8 percent contribution of recharge is accounted for by climate variables. However, rainfall only plays a significant role on recharge as further shown in the model constructed. The study makes the following recommendations:
(1) Should be channeled to creating an effective rainwater capture and storage system for use against the period of shortage.
(2) Artificial recharge mechanism may become necessary to harness adequate water in recharging both the surface and sub-surface hydrology against drought season.
Chaturvedic Empirical Model was adopted to data on generate groundwater recharge because it has been used in areas with similar geological and climatic types. It is mathematically stated as thus: R=1.35(P-14)0.5 where: R=recharge (mm), P=precipitation (mm). The statistical mean and the Standardised Rainfall Anomaly Index (SAI) and coefficient of variability (CV) were applied in analysing rainfall variability. The SAI is stated as:
$S A I=\frac{X-\bar{x}}{S \cdot D}$
where, X=is annual rainfall total; $\bar{x}$ is the mean of the entire series; S.D=Standard déviation`; $C V=\frac{s \cdot D}{\bar{x}} \times 100$.
The multiple regression analysis was to analyzed the data. The model is stated thus:
Y=a+b1X1+b2x2+b3x3+e ... bnx3
where, Y=groundwater recharge (dependent variable); a=intercept; x1=annual rainfall (mm); x2=mean annual temperature (℃); x3=mean annual evaporation (mm); (x1, x2, x3) are independent variables; e=stochastic error term (proportion of unexplained variation).
[1] Carter, R.C., Parker, A. (2009). Climate change, population trends and groundwater in Africa. Hydrological Sciences Journal, 54(4): 676-689. https://doi.org/10.1623/hysj.54.4.676
[2] Ayoade, J.O. (2004). Introduction to Climatology for the Tropics, Ibadan. Spectrum Books Limited.
[3] Pacheco, F.A. (2015). Regional groundwater flow in hard rocks. Science of the Total Environment, 506: 182-195. https://doi.org/10.1016/j.scitotenv.2014.11.008
[4] Salis, H.H.C.D., Costa, A.M.D., Künne, A., Sanches Fernandes, L.F., Leal Pacheco, F.A. (2019). Conjunctive water resources management in densely urbanized karst areas: A study in the Sete Lagoas region, state of Minas Gerais, Brazil. Sustainability, 11(14): 3944. https://doi.org/10.3390/su11143944
[5] Silbet-Coats, N., Eden, S. (2017). Water banking, recharge, and recovery in Arizona, Arroyo. University of Arizona, Water Resources Research Centre, Tucson, AZ, 2-16.
[6] Taylor, R.G., Scanlon, B., Doll, P. (2013). Groundwater and climate change. Nat. Clim. Chang., 3: 32-329.
[7] Taylor, R.G., Owor, M., Kaponda, A. (2013). Rainfall intensity and groundwater recharge: Evidence from ground-based observations in East Africa. In AGU Fall Meeting Abstracts, 2013: GC12A-02.
[8] Abua, M.A., Uquetan, U.I., Ebin, I.O., Osah, C.M. (2017). The influence of slope on spatial variability of infiltration capacity in Obudu local government area of Cross River State, Nigeria. International Journal of Innovative Environmental Studies Research, 5(1): 13-27.
[9] Abua, M., Essoka, P., Uquetan, U., Ashua, S. (2017). Sediment loss responses to rainfall on different surfaces in Obudu, Cross River State, Nigeria. Journal of Geography, Environment and Earth Science International, 10(4): 1-7.
[10] Edet, A., Ukpong, A.J., Ekwere, A.S. (2012). Impact of climate change on groundwater resources: An example from cross River State, Southeastern Nigeria. COLERM Proceedings, 1: 2-22.
[11] Xu, Y., Beekman, H.E. (2003). Groundwater recharge estimation in Southern Africa. UNESCO IHP Series, Paris.
[12] Ologunorisa, T.E., Tersoo, T. (2006). The changing rainfall pattern and its implication for flood frequency in Makurdi, Northern Nigeria. Journal of Applied Sciences and Environmental Management, 10(3): 97-102. https://doi.org/10.4314/jasem.v10i3.17327
[13] Enete, I.C., Ebenezer, I.N. (2009). Analysis of rainfall distribution over Enugu during the little dry season (1990-2005). Journal of Geography and Regional Planning, 2(7): 182-189. https://doi.org/10.4314/lwati.v6i2.46603
[14] Ekpoh, I.J., Nsa, E. (2011). Extreme climatic variability in North-Western Nigeria: An analysis of rainfall trends and patterns. Journal of Geography and Geology, 3(1): 51-62.
[15] Acworth, R.I., Rau, G.C., Cuthbert, M.O., Jensen, E., Leggett, K. (2016). Long-term spatio-temporal precipitation variability in arid-zone Australia and implications for groundwater recharge. Hydrogeology Journal, 24(4): 905-921. https://doi.org/10.1007/s10040-015-1358-7
[16] Dey, S., Bhatt, D., Haq, S., Mall, R.K. (2020). Potential impact of rainfall variability on groundwater resources: A case study in Uttar Pradesh, India. Arabian Journal of Geosciences, 13: 1-11. https://doi.org/10.1007/s12517-020-5083-8
[17] Ekeleme, A.C., Agunwamba, J.C. (2018). Experimental determination of dispersion coefficient in soil. Emerging Science Journal, 2(4): 213-218. https://doi.org/10.28991/esj-2018-01145
[18] Martins, O. (2010). Hydrograph analysis for groundwater recharge in the phreatic basement aquifer of the Opeki River basin, Southwestern Nigeria. ASSET: An International Journal (Series B), 6(2): 132-141.
[19] Jhajharia, D., Yadav, B.K., Maske, S., Chattopadhyay, S., Kar, A.K. (2012). Identification of trends in rainfall, rainy days and 24 h maximum rainfall over subtropical Assam in Northeast India. Comptes Rendus Geoscience, 344(1): 1-13. https://doi.org/10.1016/j.crte.2011.11.002
[20] Narjary, B., Kumar, S., Kamra, S.K., Bundela, D.S., Sharma, D.K. (2014). Impact of rainfall variability on groundwater resources and opportunities of artificial recharge structure to reduce its exploitation in fresh groundwater zones of Haryana. Current Science, 107(8): 1305-1312. https://www.jstor.org/stable/24107173
[21] Obiefuna, G.I., Orazulike, D.M. (2011). Application and comparison of groundwater recharge estimation methods for the semiarid Yola area, northeast, Nigeria. Global Journal of Geological Sciences, 9(2): 177-204.
[22] Obuobie, E. (2008). Estimation of groundwater recharge in the context of future climate change in the White Volta River Basin, West Africa. Doctoral dissertation, Universitäts-und Landesbibliothek Bonn.