Haneen Z. Faeq![]() | Tareq A. Khaleel*
| Tareq A. Khaleel*![]()
© 2023 IIETA. This article is published by IIETA and is licensed under the CC BY 4.0 license (http://creativecommons.org/licenses/by/4.0/).
OPEN ACCESS
By performing the Statistical Package for Social Sciences (SPSS) V26 and statistical analysis, this study aims to identify, evaluate and examine risk variables that may impact construction projects in Iraq. The reliability and internal consistency of the factors were tested using Cronbach's alpha coefficient, where Cronbach's alpha for this research was in the range of 0.923, which provides a strong indicator of the validity and reliability of the questionnaire. The relative importance index will be used to measure the degree of these risks. Field, personal and survey interviews were used to obtain these data. The survey consists of two components, the first of which is a sample of general information, and the second part discusses the possibility of risks occurring, having an impact, and the identification of 44 factors. The census results showed, by analyzing the responses from 44 workers, that only 15 factors significantly impacted the occurrence of risks in construction projects in Iraq. These factors affected the project objectives in terms of cost, time and quality, which led to the project not being completed on time. In addition to increase the cost of construction due to failure to take risks into account.
risk management, risk assessment, risk factors, degree of risk
Risk is an important decision-making factor for construction projects and can influence how successfully a project will be implemented. If not handled appropriately, it can lead to cost overruns, schedule delays, and even poor quality [1].
Any program has a certain level of Risk. The risks are increasing due to construction projects' increasing complexity and scale. In addition, there are local economic, political, social and cultural elements that will have an impact on the project. A project risk is a risk that, if it does happen, could impact at least one project objective in a good or bad way. Risks can arise through exposure to the effects of uncertainty. Possible outcomes include an event occurring in the context of the project and affecting the objectives. Considerations include the possibility of profit or loss or deviating from a planned or desired outcome due to the uncertainty involved in selecting a particular action plan [2]. Others define Risk as being initiated by the project without concern for potential harm or loss [3].
Threat describes this type of Risk. The threat is defined as an unfavorable state or condition of the project, a set of negative circumstances, the chance that it will negatively affect the project goal if it occurs, or the possibility of unfavorable changes [4].
It is difficult to eliminate risks from a construction project. Therefore, a formal risk management strategy is required to deal with many risks. Risk management is a legal and systematic process to identify, analyze and respond to risks throughout the project's life to achieve the highest level of risk elimination, mitigation and control [5]. Companies need to structure and establish effective risk management processes [6]. Project risks must be identified, assessed, analyzed and responded to for the main actions to show systematic risk management [7]. The risk management system, an essential component of engineering project management, is associated with issuing the best judgments and developing policies to ensure the least possible risks [6].
Risk assessment uses qualitative approaches to prioritize risks affected by project objectives based on determining their likelihood of occurrence and severity. Their influence and quantitative approaches to describe Risk include decision tree analysis, sensitivity analysis, and Monte Carlo simulations [8].
For the reasons of this research, the following reasons were taken into account:
1. The lack of an effective risk management system in Iraqi construction projects leads to many risks that impact the project's initial objectives.
2. To reduce the possibility of exposure to risks and their impact on the cost of construction projects in Iraq.
3. Insufficient documentation records the risks encountered during the project life cycle.
Therefore, the main risk variables affecting Iraqi construction projects and their severity and impact must be identified, evaluated and understood in this study. All projects are fraught with risks, and most of these construction projects suffer from not considering these risks when calculating the project's cost estimates.
This paper is organized as follows: preliminaries.
Described in Section 2. Construction Project Risk Rating in Section 3. Process risk management in the construction project in Section 4. Methodology in Section 5, Sources of Data in Section 6, The questionnaire's design in Section 7, Collection of data in Section 8, Analysis of data in Section 9, Data analysis and discussion in Section 10 and finally a conclusion in Section 11.
This section will present the definition of Risk, the difference between certainty and uncertainty in Risk, and the reasons for taking risks as threats.
2.1 Risk definition
Risk is the exposure to an unknown's effects. Everything conceivable may happen in the framework of a project that will change the aims. It considers the possibility of gain or loss, as well as departure, due to the uncertainty involved in choosing a specific path of action from a desired or anticipated end. Hence, Risk has two elements: the likelihood of something occurring and the ramifications for the project goals like time, money, and quality [2].
Some people define threats as a source of danger, the potential for disaster or loss, or an activity undertaken without regard to the possibility of injury or loss. Threats can include any unfavorable event, a startling situation, a risk that, if realized, would be detrimental to the project's goal, or the potential for unfavorable developments [9].
2.2 Certainty and uncertainty in risks
Decisions can be made in both assured and uncertain situations. There are debates over whether Risk and uncertainty are the same concept. Some studies distinguish given the relationship between Risk and uncertainty may be described in terms of impacts and probabilities, but uncertainty is more challenging to express. To quantify scientifically, particularly based on likelihood [4].
The definition of certainty is the situation in which all factors impacting Risk can be assessed, and decision-making procedures result in a specific, predictable result [10].
However, this occurs seldom and just in locked systems. An uncertain situation is one in which it is unclear which of several potential outcomes has already happened or will happen. Although all dangers are unexpected, not all uncertainty is harmful [11].
Certainty occurs only when it is possible to predict exactly what will occur over the period the decision applies to. In the building industry, this is rare. Several writers do not distinguish education and learning in Wales between Risk and uncertainty (2001) used the following definitions of Risk and uncertainty [12]:
1. There is Risk when a decision is justified in terms of a range of possible outcomes. Known probabilities may be attributed to the outcomes.
2. There is uncertainty when there are several possible outcomes to a sequence of action, but the likelihood of each possibility is unknown.
2.3 The Reasons to take risks as threats
The sources of dangers in construction project activity are not fully explained in any thorough study. Some writers attempted to recognize the danger-causing elements in building projects in their investigations and attributed Roilamela and Lobello's high threats to [13]:
1. A significantly fragmented industry.
2. The industry is extremely subject to the financial cycle.
3. serious competition is a result of an oversupplied market.
4. Organizational problems.
5. Accounting, in which errors in financial data generated for management occur.
6. Expanding the scope of the project.
7. Unacquaintance with a new geographical location.
8. Transitioning to a new style of building.
9. A change in key people.
A review of previous studies over the past three decades on risk identification and assessment Factors in construction projects considered nearly 1,000 global projects from different countries. It can be concluded from previous studies that there is a lack of knowledge about risk management in construction projects. However, the most important risk factors affecting the cost of construction projects are insufficient financial allocation, planning, scheduling, financing, payment, poor communication between construction parties, and emergency changes during the construction phase. Various service construction projects were taken to determine how these factors affect the cost. Projects that caused an increase in the final construction cost of those projects.
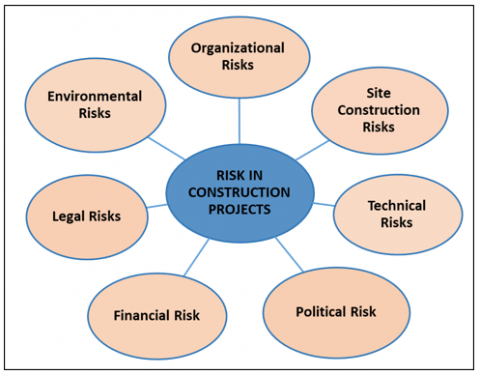
The hazards connected to the construction sector can be roughly categorized as follows [14]:
1. Organizational risks: Organizational risks consist of contractual relationships such as the relationship between the contractor and the second contractor and the misunderstanding and agreement that occurs between them, the experience of the contractors, the attitudes of the participants, the inexperienced workforce such as providing staff with little experience to benefit from some of the worker's wages, and communications such as poor communication between The contractor and the employer promise to follow up on matters first.
Figure 1. Classification of construction project risks
2. Risks associated with site building: Include worker productivity, the state of the job site, equipment breakdowns, design modifications, higher quality requirements, and new technologies.
3. Technical hazards: These include risks related to incomplete designs, inadequate specifications, poor on-site investigations, changes in the scope and methods of construction, a lack of resources, and other factors.
4. Political or security concerns: Include alterations to laws and regulations, safety and pollution rules, law and order, war, and civil unrest.
5. Financial risks: Include higher material costs, decreased demand for the product on the market, fluctuating currency rates, late payments, incorrect appreciation taxes, etc.
6. Legal risks: Delay in receiving operational advances and confiscation of project lands by the state.
7. Environmental risks: Natural disasters, weather, floods and environmental pollution, as shown in Figure 1.
The nature of the construction industry makes risk management (R.M.) essential, a crucial strategy typically used in projects with high uncertainty. More structured planning, monitoring, and control processes help identify these risky investments. Analyzing past failures and concluding is the fastest way to identify risks [15].
The most frequent and typical types of projects are construction projects, which have a variety of characteristics, such as a specific objective, time limit, financial restrictions and economic requirements, unique regulatory and legal requirements, complexity, and methodological qualities. As a result, each investment project is a complex system in and of itself.
Projects involving construction, in particular, face various risk factors and complex relationships that will have an impact. Direct, indirect, overt, covert or unexpected relationships are difficult [16].
Determining the risk factor is the initial stage of the iterative risk management process (RMP), which also involves qualitative and quantitative evaluations of the effects of risks on the project. Create risk management strategies to keep the project participants' maximum Risk and return structure [17, 18].
Throughout a project's life cycle, risk management is a systematic and formal procedure that must be implemented in a construction project. It is divided into three steps. These phases involve completing risk management planning, identifying, Risk analysis, and planning for risk response and control. Project risk management aims to increase the possibility and effect of favorable occurrences and decrease the likelihood and impact of unfavorable events. Several authors describe RMP as identifying, analyzing, and planning risks. As a result, the current research proposal of a risk management technique included these steps of the RMP. However, the Project Management Institute (PMI) has discussed the refrigerant management plan.
According to the PMI Project Management Knowledge Book, risk management is a methodical procedure for detecting, assessing, and addressing project risks (2013). Project objectives entail maximizing the chance and effects of favorable occurrences and limiting the probability and effects of unfavorable events. Here, each risk management component is covered from the standpoint of a building project.
It identifies risks based on personal interviews conducted with several experienced engineers in the field of construction and contractors, previous studies, and a questionnaire survey. Risk analysis is based on quantitative and qualitative analysis methods, where quantitative analysis is performed using different methods, including probability analysis, Monte Carlo simulation technique, sensitivity analysis, break-even point analysis, and others. Qualitative analysis is carried out using several analysis methods that can be used to evaluate and enhance the effectiveness of risk management in building projects, including direct judgment, comparison options, ranking of options, descriptive calculation, risk probability, impact probability analysis and impact matrix, risk classification, and quality assessment. Risk statements and risk assessment. After identifying and analyzing the project risks, it is necessary to develop an appropriate risk response strategy to implement the required countermeasures against the adverse effects of the risks on the project objectives. Making decisions to increase opportunities and reduce threats to project objectives is developing a risk response plan such as risk avoidance, acceptance, transfer, and retention. Risk monitoring and control is a system for monitoring residual risks, tracking known risks, finding additional risks, and evaluating risk management procedures in all project parts, as shown in Figure 2.
Figure 2. Framework for risk management [2]
The research approach followed can be summarized as follows: There are 44 risk factors. Based on individual interviews, literature reviews, and field surveys, they were discovered and grouped into seven sources of Risk. As shown in Figure 1. The questionnaire was then distributed to the Ministry of Construction and Housing, the public sector, and a contracting company. Companies in the private sector. Ninety-two questionnaires were distributed to specialized engineers and engineers of different ages of experience, as shown in Table 3.
Seventy questionnaires were received and approved for statistical analysis. Incomplete responses to any questionnaire items led to nine forms being rejected, and 13 other forms were not returned, bringing the response rate to 76% of the total sample size. As a result, the questionnaire was analyzed using a reliability test, where Cronbach's alpha coefficient (C) is used to measure internal consistency. The Cronbach's alpha coefficient (C) measures internal consistency. To give the measurement to evaluate the validity and the inner scale or thickness of the test and the relative importance index approach to examine the acquired data to determine the value of the identified factors. It depends on the probability of the Risk occurring and the consequences (consequences). Then, the risk score was found, and a risk assessment was performed based on the classification of risk factors, the severity of the risks, and the extent of the impact of the RII periods, which will be explained in the next stages. Therefore, the results identified the most important risk variables that affect construction projects at the planning stage in Iraq.
Many methodological approaches have been used to detect and assess the risks that have an impact on building project costs, and they include the following:
1. Literature reviews.
2. Interviews.
3. Survey questionnaire.
6.1 Literature reviews
Extensive literature reviews of prior studies closely related to risks in construction projects and their management, identification, and evaluation gave the researcher information and ideas on the topic. The study's accuracy was significantly improved by attempting to cover as much as possible of the risks affecting the cost of projects from prior research studies. Yet a number of elements were first determined by referencing earlier study investigations.
6.2 Interviews
Personal interviews with those in charge of construction, including consultants, seasoned civil engineers, contractors, supervisors, and even workers, made it easier to identify the most significant risks that affect the cost by offering suggestions, advice, and other details that would improve the study's accuracy. Table 1 shows the unique qualifications for engineer interviews.
Table 1. Unique qualification for engineering interviews
|
NO. |
Job Title |
Years of Experience |
The Workplace |
|
1 |
Projects Manager |
31 |
Al Rasheed General State Constructional |
|
2 |
Senior Chief Engineer |
30 |
AL-Mansour State Company |
|
3 |
Academic |
38 |
University of Baghdad |
|
4 |
Senior Chief Engineer |
30 |
AL-Mansour State Company |
|
5 |
Consultant |
37 |
Engineering Consulting Center |
6.3 Survey questionnaire
As described, a questionnaire is a research instrument used to gather data from respondents based on their thoughts and work experience. So, the questionnaire form should have several inquiries and other stimuli to be the topic of subsequent statistical research.
According to the survey's questionnaire, several specific danger variables may influence Iraqi building projects.
Field observations, in-person interviews with several engineers and managers working in the housing and construction industries, information gathered from the literature review, and Two sections make up the questionnaire form, the first of which requests general information. About the research project, A second part of the questionnaire included identifying 44 Risk factors. Respondents were asked to indicate the likelihood of occurrence and the effect level regarding their impact on construction projects in Iraq during the planning stage. Each factor on a five-point Likert scale is Strongly Accept, Accept, Neutral, Disagree, or Strongly Disagree. Housing and Construction Sector engineers formed the study community based on the research's aim. Before the questionnaire was made public, a commission of five arbitrators was constituted to evaluate its performance, as shown in Table 2. This committee studied these various risk factors, and some factors were added and deleted until the final form of the questionnaire was reached, as shown in the attached appendix.
Table 2. Personal qualification of arbitrators
|
NO. |
Job Title |
Experience Years |
Work Place |
|
1 |
Projects Manager |
31 |
Al Rasheed General State Constructional |
|
2 |
Senior Chief Engineer |
35 |
AL-Mansour State Company |
|
3 |
Lecturer/Ph.D |
32 |
University of Central Technical |
|
4 |
Lecturer/Ph.D |
25 |
University of Technology |
|
5 |
Lecturer/M.SC |
18 |
University of Baghdad |
The study's results were obtained by distributing surveys across the housing construction sectors, with a sample size of at least 30 respondents. The questionnaire is distributed to more than 30 people because it will give more accurate results and include all opinions. Some incomplete questionnaire forms contain errors and are ignored [19].
Table 3. The questionnaire was distributed
|
% of Response |
Received |
Distributed |
Workplace |
NO. |
|
100% |
20 |
20 |
Ministry of Business and Housing |
1 |
|
100% |
7 |
7 |
Al-Mansour Contracting Company |
2 |
|
83% |
29 |
35 |
National Center for Engineering Consultation |
3 |
|
47% |
14 |
30 |
Accurate Surveying Contracting Company |
4 |
|
76% |
70 |
92 |
Total |
|
In total, 92 surveys were distributed to various engineers with varying degrees of expertise in the building business. The answers included in the final analysis numbered 70 were included in the analysis. Moreover, some forms were received incomplete. Table 3 shows how questionnaires were distributed, including how many were given out and to whom; for each directorate and project included in the research sample, 76% of those surveyed answered.
IBM SPSS V26 and Microsoft Excel applications were used for the analysis.
9.1 Reliability testing
Reliability research There are two methods used to carry it out. External reliability analysis comes first. Testing is done repeatedly, and results are compared. The second technique is internal reliability analysis. Uses As soon as the information is gathered for dependability analysis. This technique the analytical process includes several components. Credibility The consistency of the objects is tested to determine the modulus.
Internal reliability analysis often uses techniques like Half Spearman-Brown and Alpha Cronbach [20].
The reliability and internal consistency were evaluated for each questionnaire component using Cronbach's alpha coefficient (C). (C) always has a value between 0 and 1. The stability improves as the value approaches one, and vice versa. Cronbach's alpha values for this search are in the range of 0.923, according to Table 4, which indicates the validity and reliability of the questionnaire, which should be more than 0.7 [21].
Table 4. A questionnaire's Cronbach's alpha
|
Cronbach's Alpha |
No. of Item |
Category |
No. |
|
0.846 |
8 |
Organizational |
1 |
|
0.731 |
6 |
Worksite |
2 |
|
0.844 |
7 |
Technical (related to the contractor) |
3 |
|
0.650 |
4 |
Technical (related to the employer) |
4 |
|
0.350 |
5 |
political or security |
5 |
|
0.787 |
6 |
Financial |
6 |
|
0.705 |
4 |
Legal |
7 |
|
0.588 |
4 |
Environmental or natural |
8 |
|
0.923 |
44 |
Total (all items of the questionnaire) |
|
9.2 Normality test
A normality test should be completed to determine if the data collected from a questionnaire is normally distributed. The Shapiro-Wilk test, Kolmogorov-Smirnov test, skewness, kurtosis, histogram, box plot, P-P plot, and Q-Q plot are just a few of the methods that may be used to check for normalcy. And the Kolmogorov-Smirnov and Shapiro-Wilk tests are the most often used techniques. The Kolmogorov-Smirnov test was chosen because the sample size was more than 50.
Table 5 shows the results of the standardization of the questionnaire data.
The results showed that the significant level of the included data is greater than (mark 0.05). Therefore, all survey data are distributed in a normal distribution. In addition to performing a normality test, skewness and kurtosis values are calculated. Skewness is a measure of the irregularity or homogeneity of a normal distribution. Standard deviation is widely regarded as one of the most important and accurate measures of dispersion and the most common and commonly used in statistical analysis. While kurtosis is a measure of a distribution's peak, the data's distribution is symmetric when it progresses in the same direction to the left and right of the central point.
Table 5. Normal distribution test
|
Category |
Kolmogorov-Smirnov |
|
|
Statistic |
Sig. |
|
|
Probability of Risk occurrence |
.200 |
.097 |
|
Impact of Risk |
.200 |
.099 |
Uses some descriptive statistics to demonstrate shown in Table 6.
Table 6. Sample descriptive statistics
|
No. |
Statistic Function |
Probability |
Impact |
|
1 |
Mean |
.703 |
.526 |
|
2 |
Median |
.711 |
.532 |
|
3 |
Variance |
.002 |
.003 |
|
4 |
Std. Deviation |
.043 |
.056 |
|
5 |
Range |
.244 |
.298 |
|
6 |
Skewness |
-.237 |
.071 |
|
7 |
Kurtosis |
1.257 |
.696 |
9.3 The index of relative importance
Check out survey responses on statistical measurements for extra inspiration. By evaluating the Relative Importance Index, these parameters were rated according to the significance of their influence on building projects (RII). It is used to determine how crucial it is to prioritize the many risks that impact building projects during the planning stage. The significance index was the percentage calculated for each risk factor by using the Eq. (1) [22]:
$R I I=\Sigma W / A * N(0 \leq R I I \leq 1)$ (1)
W: is the score assigned to each component and typically varies from (1 to 5).
(Where "1" is "no" and "5" is "always");
N: is the size of a file sample questionnaire, and A: is the maximum score (in this case, 5).
(i.e., 70 in this study).
Whereas the relative relevance index was used in the second section of the questionnaire to evaluate all risks.
9.4 Degree of risk
Using the relative relevance index (RII) for each Risk's chance of occurrence and its effect on the elements listed in the questionnaire it is used to conduct a qualitative risk analysis of the risk factors that result in cost overruns for building projects. The equation can calculate the degree of Risk (2) [23].
Degree of Risk $=$ Likelihood ${ }^*$ Effect (2)
Determine the deviation (D) between the highest risk score value and the RII intervals to assess the risk score's effect level. and the lowest value, as seen in Table 7 [24].
D=0.559-0.221=0.338.
Table 7. Level of RII interval influence
|
Influence Level |
RII Intervals |
Minimum Limit |
Maximum Limit |
|
Extremely Low |
0.221-0.255 |
0.221 |
0.221+10%*D =0.255 |
|
Low |
0.256-0.332 |
0.256 |
0.256+22.5%*D =0.332 |
|
Medium |
0.333-0.409 |
0.333 |
0.333+22.5%*D =0.409 |
|
High |
0.41-0.486 |
0.41 |
0.41+22.5%*D =0.486 |
|
Extremely High |
0.487-0.563 |
0.487 |
0.487+22.5%*D =0.563 |
Table 7 shows the influence level of the RII intervals used to determine the risk severity/score based on the minimum and maximum risk severity limitations.
10.1 Survey results
The statistical analysis is divided into two primary sections to make the questionnaire findings more understandable.
10.1.1 General information in part one
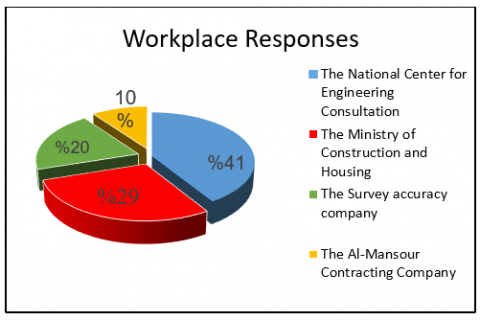
The sample demographic information from the survey respondents is described in a respondent profile. Demographic information is primarily used to evaluate respondents' capacities and understanding of the hazards that impact building project costs. Figure 3 displays the proportion of answers from each workplace. The consulting centre (41%) constituted the largest proportion, as for the Ministry of Construction and Housing (29%), the Survey Accuracy company (20%), and the Al-Mansour Contracting Company, respectively.
Figure 4 indicates the ratio of respondents working in the general public to those in the business sector; 87% are in the former, while 13% are in the latter.
Figure 5 displays the proportion of engineers in each engineering speciality who answered survey questions. It was determined that graduates from general civil engineering made up the largest percentage of the data sample (64%), while graduates from other engineering disciplines made up the remaining percentage. Such as structural engineering, project management engineering, and building and construction engineering are represented, respectively, by (14%), (13%), and (9%) from the sample data.
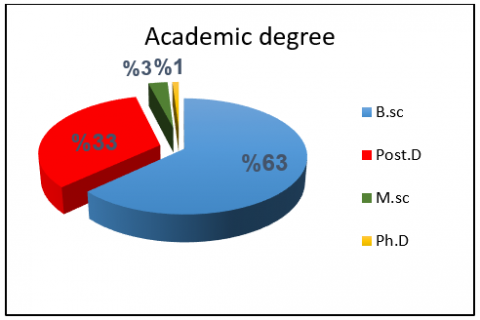
Figure 6 shows that the biggest percentage (63%) of the engineers who answered the questionnaire held a Bachelor of Science. 33% of engineers have a master's degree. Degree (3%) of engineers hold a Ph.D. At the same time, the percentage was (1%) for engineers having a diploma.
Figure 3. Workplace response
Figure 4. Work sector
Figure 5. Engineering specialization
The number of years of experience the engineers who responded to the survey have been shown in Figure 7. Most of the study sample, or 34%, consisted of engineers with more than ten years of experience. The number of engineers with experience between 5 and 10 years was 32%. Engineers with experience of between 10 and 15 years came in second with a percentage of 27%, and engineers with experience of more than five years came in last with a percentage of (7%).
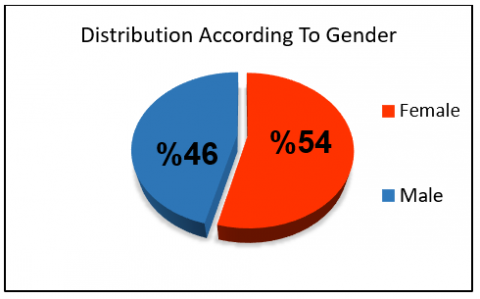
It is clear from the Table that (54%) are females, and this percentage represents more than half, while the rest (46%) are males, as shown in Figure 8 below.
Figure 6. Academic degree
Figure 7. Years of experience
Figure 8. Distribution according to gender
10.1.2 The likelihood of risks happening and the severity of those risks make up the second section
Table 8 shows the assessment given the severity and classification of the selected danger variables that are detected essential risk factors for carrying out work that does not comply with rejection results from not meeting requirements for return of work, schedule inaccuracy, delay in payment of advances, failure to finance the project. According to the questionnaire, the last eleven factors have little effect on Iraqi building projects during the planning stage. The table below shows qualitative evaluation and rating of the risk factor.
10.2 The most important risk factor
Following a qualitative study and ranking of the risk score, 15 of the 44 risk variables are considered the most important risk factors within the risk category as shown in Table 9 and Figure 9.
Table 8. Qualitative assessment and ranking of the risk factors
|
No. |
Risk Factor |
Probability of Occurrence |
Degree of Impact |
Risk Score |
Influence Level |
Rank |
|
1 |
Assigning work to an incompetent contractor |
0.817 |
0.684 |
0.559 |
Very High |
1 |
|
2 |
The deterioration of the security situation |
0.769 |
0.621 |
0.478 |
High |
2 |
|
3 |
The presence of obstacles at the site (such as groundwater, water pipes, electrical installations... etc.) |
0.754 |
0.593 |
0.447 |
High |
3 |
|
4 |
Occupation of the project by another party leads to a delay in the contractor's receipt of the project |
0.751 |
0.593 |
0.445 |
High |
4 |
|
5 |
Unavailability of designs for service networks that cross the location (such as electricity, telephone, water, etc.) |
0.751 |
0.589 |
0.442 |
High |
5 |
|
6 |
Insufficient financial allocations to complete the works |
0.749 |
0.584 |
0.437 |
High |
6 |
|
7 |
Late arrival of some materials and equipment from the country of origin |
0.749 |
0.581 |
0.435 |
High |
7 |
|
8 |
Mismatch of plans (structural, architectural) or contract documents |
0.743 |
0.576 |
0.428 |
High |
8 |
|
9 |
Variations between implementation and needed specifications as a result of plan and specification misunderstanding |
0.739 |
0.574 |
0.424 |
High |
9 |
|
10 |
Inaccuracy in setting the project schedule |
0.734 |
0.571 |
0.419 |
High |
10 |
|
11
|
Delaying the completion of the paragraphs due to the contractor's lack of financial liquidity |
0.737 |
0.564 |
0.416 |
High |
11 |
|
12 |
Delayed arrival of materials due to security measures |
0.729 |
0.558 |
0.407 |
Medium |
12 |
|
13 |
Weak coordination and communication between the employer and the contractor |
0.729 |
0.554 |
0.404 |
Medium |
13 |
|
14 |
Lack of funding for the project |
0.723 |
0.554 |
0.401 |
Medium |
14 |
|
15 |
Lack of necessary information (delayed arrival of official correspondence to the work site) |
0.731 |
0.547 |
0.4 |
Medium |
15 |
|
16 |
Delay in handing over the site to the contractor owing to inadequate site preparation |
0.714 |
0.543 |
0.388 |
Medium |
16 |
|
17 |
Delay in starting work on the project |
0.714 |
0.54 |
0.386 |
Medium |
17 |
|
18 |
Damage occurred in some parts of the project |
0.714 |
0.539 |
0.385 |
Medium |
18 |
|
19 |
Environmental disasters (floods, earthquakes, fires, earthquakes) |
0.711 |
0.541 |
0.385 |
Medium |
19 |
|
20 |
Due to security incidents, the contractor was unable to receive the site |
0.717 |
0.534 |
0.383 |
Medium |
20 |
|
21 |
A significant increase in the price of building materials |
0.711 |
0.535 |
0.38 |
Medium |
21 |
|
22 |
Inflation and price fluctuations during the project implementation period |
0.711 |
0.531 |
0.378 |
Medium |
22 |
|
23 |
The inability to benefit from the project due to the incompleteness of the project and the issuance of the final acceptance certificate |
0.711 |
0.532 |
0.378 |
Medium |
23 |
|
24 |
The state owns the project land |
0.7 |
0.527 |
0.369 |
Medium |
24 |
|
25 |
Delayed completion of designs or change in design |
0.7 |
0.524 |
0.367 |
Medium |
25 |
|
26 |
Difficulty accessing the site |
0.694 |
0.527 |
0.366 |
Medium |
26 |
|
27 |
Inaccurate surveys related to the project site by the owner |
0.691 |
0.526 |
0.363 |
Medium |
27 |
|
28 |
Unclear contractual obligations |
0.683 |
0.519 |
0.354 |
Medium |
28 |
|
29 |
Delayed approval of executive plans by the |
0.68 |
0.506 |
0.344 |
Medium |
29 |
|
30 |
Very bad or harsh weather conditions |
0.689 |
0.491 |
0.338 |
Medium |
30 |
|
31 |
Do religious events and sudden holidays lead to a delay in the project? |
0.674 |
0.5 |
0.337 |
Medium |
31 |
|
32 |
Disputes during the construction phase between work parties |
0.68 |
0.49 |
0.333 |
Medium |
32 |
|
33 |
The delay in receiving operational advances according to the contract pending the completion of legal procedures |
0.677 |
0.492 |
0.333 |
Medium |
33 |
|
34 |
Non-compliance with environmental laws and regulations and their costs |
0.683 |
0.486 |
0.332 |
Low |
34 |
|
35 |
Switch work location |
0.669 |
0.483 |
0.323 |
Low |
35 |
|
36 |
Switch work Not allocating a place for throwing rubble location |
0.669 |
0.476 |
0.318 |
Low |
36 |
|
37 |
The occurrence of internal problems among the contractor team members |
0.66 |
0.464 |
0.306 |
Low |
37 |
|
38 |
Technical specifications change during the project implementation period |
0.654 |
0.468 |
0.306 |
Low |
38 |
|
39 |
Delaying procedures for transferring work to the heirs |
0.654 |
0.491 |
0.294 |
Low |
39 |
|
41 |
the environment surrounding the project |
0.651 |
0.449 |
0.292 |
Low |
41 |
|
42 |
Work may lead to environmental pollution |
0.646 |
0.451 |
0.291 |
Low |
42 |
|
43 |
The death of the contractor |
0.646 |
0.439 |
0.284 |
Low |
43 |
|
44 |
Changing the priorities of the project owner |
0.573 |
0.386 |
0.221 |
Very Low |
44 |
Table 9. Greatest risk factors determined by risk score
|
Rank |
Risk Factor |
Risk Score |
Category Belong |
|
1 |
Assigning work to an incompetent contractor |
0.559 |
Technical (Related to the contractor) |
|
2 |
The deterioration of the security situation |
0.478 |
political or security |
|
3 |
The presence of obstacles at the site (such as groundwater, water pipes, electrical installations... etc.) |
0.447 |
Worksite |
|
4 |
Occupation of the project by another party leads to a delay in the contractor's receipt of the project |
0.445 |
political or security |
|
5 |
Unavailability of designs for service networks that cross the location (such as electricity, telephone, water, etc.) |
0.442 |
Organizational |
|
6 |
Insufficient financial allocations to complete the works |
0.437 |
Financial |
|
7 |
Late arrival of some materials and equipment from the country of origin |
0.435 |
Technical (Related to the contractor) |
|
8 |
Mismatch of plans (structural, architectural) or contract documents |
0.428 |
Technical (Related to the contractor) |
|
9 |
Variations between implementation and needed specifications as a result of plan and specification misunderstanding |
0.424 |
Technical (Related to the contractor) |
|
10 |
Inaccuracy in setting the project schedule |
0.419 |
Technical (Related to the contractor) |
|
11 |
Delaying the completion of the paragraphs due to the contractor's lack of financial liquidity |
0.416 |
Financial |
|
12 |
Delayed arrival of materials due to security measures |
0.407 |
political or security |
|
13 |
Weak coordination and communication between the employer and the contractor |
0.404 |
Organizational |
|
14 |
Lack of funding for the project |
0.401 |
Technical (related to the business owner) |
|
15 |
Lack of necessary information (delayed arrival of official correspondence to the work site) |
0.4 |
Organizational |
Figure 9. Most significant risk factors with the risk score
10.3 Groups ranking
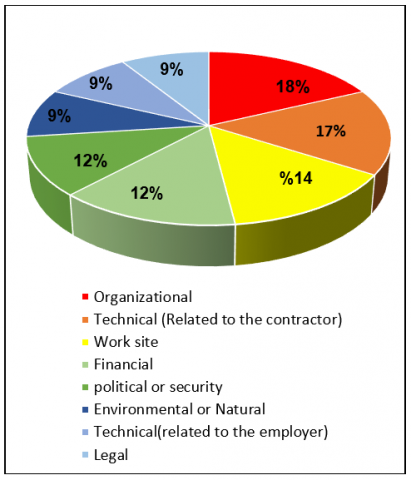
Table 10 shows the sources of risks that included several risk factors, divided into eight sources. According to the classification, it is clear that “organizational” risk sources were given priority by the first respondent over others at a rate of (18%), followed by “technical risk factors related to the contractor” at a rate of (17%). It is noted that “risk factors related to the employer, environmental risk factors, and legal risks” had the same percentage (9%), as shown in Figure 10.
Figure 10. Weight of risk source
Table 10. Ranking of overall risk sources
|
NO. |
Risk Source |
No. of Factors |
Total RII |
Weight |
Rank |
|
1 |
Organizational |
8 |
6.422 |
18% |
1 |
|
2 |
Technical (Related to the contractor) |
7 |
5.86 |
17% |
2 |
|
3 |
Work site |
6 |
4.751 |
14% |
3 |
|
4 |
political or security |
5 |
4.186 |
12% |
4 |
|
5 |
Financial |
6 |
4.057 |
12% |
5 |
|
6 |
Environmental or Natural |
4 |
3.129 |
9% |
6 |
|
7 |
Technical (related to the employer) |
4 |
3.077 |
9% |
7 |
|
8 |
Legal |
4 |
3.077 |
9% |
8 |
|
Total |
44 |
34.56 |
100% |
|
|
The primary focus of this research paper was to identify and evaluate the myriad risks impacting projects, utilizing the Statistical Package for Social Sciences (SPSS) for statistical analysis. The results pinpointed the most significant potential risks through a questionnaire technique employed for data collection and evaluation of each identified Risk. Forty-four risk variables were presented and analyzed in this article based on the responses garnered from the questionnaire.
• The risk indicators, based on their risk index/score, were categorized into seven risk sources considering the likelihood and severity of risks and their degree of impact on Iraqi construction tasks during the planning phase.
• The results highlighted the crucial risk elements that warrant consideration during risk management.
1. In most instances, participants and stakeholders in Iraqi construction projects have not adopted risk management methodologies. Hence, the development of a suitable risk management methodology is imperative.
2. A qualitative analysis was conducted to assess the degree of Risk, followed by identifying initial risk variables, encompassing 15 out of the 44 risk categories accountable for risks in Iraqi residential construction projects. The most concerning was "outsourcing work to an incompetent contractor" (RII 55.9%), followed by the deterioration of the security situation (RII 47.8%), and then the presence of obstacles at the site (like groundwater, water pipes, electrical installations, etc.) at (RII 44.7%). The organizational risk factor was the lack of plans for service networks passing through the location (such as electricity, telephone, water, etc.) at (44.2% RII).
3. Various risk factors were classified into seven sources (categories) of Risk, based on their arrangement, revealing "technical (related to contractors), political or security, organizational, financial" as the most significant indicator among other sources of Risk.
• We believe the objective of the risk management process should be to detect, analyze, assess, and prevent the evolution of various risks and associated hazards in a systematic and ongoing manner.
• Expanding the research to develop a model considering threats, hazards, and urgent dangers is essential. Recommendations for future research to enhance risk management in Iraqi construction projects are advisable.
1. Reorganized the conclusion to summarize key findings, discuss their implications, and finally, provide recommendations for future research, aligning with the reviewer's feedback for a more logical structure.
2. Reframed some sentences to improve clarity and coherence.
3. Segmented information into bullet points and numbered lists for better readability and to address the disjointedness noted by the reviewer.
4. Integrated the suggestion of including recommendations for future research in the last point, emphasizing the necessity of expanded research and improved risk management methodologies for Iraqi construction projects.
[1] Memon, A.H., Rahman, I.A., Azis, A.A.A. (2012). Time and cost performance in construction projects in southern and central regions of Peninsular Malaysia. International Journal of Advances in Applied Sciences, 1(1): 45-52. https://doi.org/10.11591/ijaas.v1i1.537
[2] Cooper, D.F., Grey, S., Raymond, G., Walker, P. (2005). Project Risk Management Guidelines. John Wiley & Sons, Ltd, England.
[3] Project Management Institute Standard Committee. (2017). A guide to the project management body of knowledge. Sixth edition - Newtown Square Pennsylvania USA PA, p. 397.
[4] Project Management Institute Standard Committee. (2004). A Guide to the Third Edition of the Project Management Body of Knowledge. Newtown Square Pennsylvania, USA.
[5] Ehsan, N., Mirza, E., Alam, M., Ishaque, A. (2010). Risk Management in construction industry. In 2010 3rd International Conference on Computer Science and Information Technology, Chengdu, China, pp. 16-21. https://doi.org/10.1109/ICCSIT.2010.5564663
[6] Petryshyn, N., Mykytyn, O., Malinovska, O., Khalina, O., Kirichenko, O. (2022). Risk management system at an engineering enterprise in conditions of ensuring security. International Journal of Safety and Security Engineering, 12(4): 525-531. https://doi.org/10.18280/ijsse.120414
[7] Sheen, S.N., Priyan, R.S., Sugumar, S. (2017). A review on risk management in residential projects. International Journal of Engineering Research & Technology (IJERT), 6(11): 295-298.
[8] Aziz, A.A.A., Memon, A.H., Rahman, I.A., Karim, A.T.A. (2013). Controlling cost overrun factors in construction projects in Malaysia. Research Journal of Applied Sciences, Engineering and Technology, 5(8): 2621-2629.
[9] Raftery, J. (1994). Risk Analysis in Project Management. London: New York: E & F.N. Spon.
[10] Mbachu, J., Nkado, R. (2007). Factors constraining successful building project implementation in South Africa. Construction Management and Economics, 25(1): 39-54. https://doi.org/10.1080/01446190600601297
[11] Yoe, C. (2000). Risk analysis frame work for cost estimation. Association with Planning and Management Consultants for U.S. Army Corps of Engineers, Institute of Water Resources, Alexandria.
[12] Flanagan, R., Norman, G. (1993). Risk Management and Construction (2nd Edi.). Oxford.
[13] Rwelamila, P., Lobelo, L. (1997). Factors associated with insolvencies amongst civil engineering construction firms in South Africa. University of Cape Town, Cape Town, South Africa.
[14] Mhetre, K., Konnur, B.A., Landage, A.B. (2016). Risk management in construction industry. International Journal of Engineering Research, 5(1): 153-155. https://doi.org/10.17950/ijer/v5i1/035
[15] Cleland, D.I., Gareis, R. (2006). Global Project Management Handbook: Planning, Organizing, and Controlling International Projects. McGraw-Hill Education. https://doi.org/10.1016/0020-0255(78)90019-1
[16] Kuang, Z. (2010). Risk Management in Construction Projects. Denmark: VIA University College, Horsens Campus, Denmark.
[17] Wang, S.Q., Dulaimi, M.F., Aguria, M.Y. (2004). Risk management framework for construction projects in developing countries. Construction Management and Economics, 22(3): 237-252. https://doi.org/10.1080/0144619032000124689
[18] Edwards, P.J., Bowen, P.A., Hardcastle, C., Stewart, P.J. (2009). Identifying and communicating project stakeholder risks. In Construction Research Congress 2009: Building a Sustainable Future, pp. 776-785. https://doi.org/10.1061/41020(339)79
[19] Hogg, R.V., Tanis, E.A., Zimmerman, D.L. (1977). Probability and Statistical Inference (Vol. 993). New York: Macmillan.
[20] Ibnugraha, P.D., Nugroho, L.E., Santosa, P.I. (2020). Reliability analysis of risk model metrics based on business approach in information security. Ingénierie des Systèmes d’Information, 25(4): 475-480. https://doi.org/10.18280/isi.250410
[21] Xin, L., Rong, W. (2007). Survey research on relationship among service failures, service recovery and customer satisfaction. In 2007 International Conference on Management Science and Engineering, Harbin, China, pp. 1121-1126. https://doi.org/10.1109/ICMSE.2007.4421996
[22] Sambasivan, M., Soon, Y.W. (2007). Causes and effects of delays in Malaysian construction industry. International Journal of Project Management, 25(5): 517-526. https://doi.org/10.1016/j.ijproman.2006.11.007
[23] Mohammed, A.J. (2016). A study for significant risks and their effects on construction projects in Erbil city. Journal of Engineering and Sustainable Development, 20(4): 96-115.
[24] Hamadeh, M., Nayfeh, M., Amodi, O. (2012). Management of construction phase risks for construction projects in Syria. Damascus University Journal for Engineering Sciences.