Suzhen Wu*![]() | Min Han
| Min Han![]()
© 2023 IIETA. This article is published by IIETA and is licensed under the CC BY 4.0 license (http://creativecommons.org/licenses/by/4.0/).
OPEN ACCESS
In the evolving realm of precision machinery, paramount importance is placed on the efficiency and performance of transmission systems. A central role is played by gears within these systems, with their thermal variations and distributions during operation critically influencing the stability and efficiency of the systems at large. Despite the theoretical support lent by traditional thermodynamic theories and empirical formulas, their prediction accuracy is found lacking, particularly in the face of complex operational environments and dynamic changes. To address this shortfall, this study introduces an advanced thermodynamic model, augmented by the application of a Temporal Convolutional Network (TCN). The integration of these methodologies facilitates a comprehensive thermal analysis and prediction specific to gear operation, aiming to provide enhanced accuracy and real-time thermal data support. This endeavor is vital for not only understanding but also optimizing the thermal behavior of gears in precision transmission systems, ultimately contributing to the advancement of the field.
precision transmission systems, gear dynamics, heat analysis, advanced thermodynamic modelling, Temporal Convolutional Network (TCN)
In the realm of precision machinery, attention is consistently directed toward the performance and efficiency of transmission systems, as underscored by a wealth of scholarly inquiry [1, 2]. Gears, pivotal mechanical components within these systems, are recognized as bearing a substantial portion of the power load [3-13]. It has been observed that during their operation, the heat generated from interactions such as meshing, sliding, and impact with adjacent gears plays a significant role in influencing the system's stability and efficiency. The accumulation of heat, further exacerbated by friction, compression, and power transmission, is known to potentially precipitate a swift escalation in system temperatures [14]. Fluctuations in temperature have the capacity to not only impair the effectiveness of lubrication and augment wear but also to compromise the precision of both gears and transmission systems, attributed to thermal expansion and alterations in material thermal properties [15].
The rapid advancements in manufacturing technologies and the advent of intelligent manufacturing have culminated in heightened expectations for mechanical systems, particularly in terms of efficiency, stability, and durability [16-18]. Gear transmission systems, integral to a myriad of machines and devices, are established as exerting a direct impact on the performance and lifespan of the equipment at large [19-21]. Consequently, it is deemed imperative to undertake a thorough analysis of thermal distribution and fluctuations in gears, thereby furnishing critical data support for the purposes of system design, optimization, and maintenance [22, 23]. The precision in predicting temperature variations within gears is crucial, as it facilitates timely and accurate control during system operation, thereby enhancing transmission efficiency and mitigating the likelihood of system failures [24].
Traditional studies on gear heat have predominantly centered around conventional thermodynamic theories and empirical formulas, which have demonstrated the capacity to yield reasonably accurate results under specific conditions [25, 26]. Nonetheless, these methodologies often reveal their limitations when confronted with intricate working environments characterized by variable loads, speeds, and lubrication conditions [27-30]. This is particularly evident when the dynamic characteristics and nonlinear behavior of gears are taken into consideration, domains in which traditional approaches exhibit deficiencies in terms of predictive accuracy and responsiveness.
In response to these challenges, this study has adopted an advanced thermodynamic model to provide a nuanced and exhaustive analysis of heat generation during gear operation. A novel methodology for the calculation of average heat flux density has been introduced, aiming to enhance the reliability of measurement data for practical applications. Moreover, this research marks a pioneering endeavor in integrating TCN into the domain of gear heat prediction, duly accounting for the dynamic and nonlinear attributes of gear operation, and thereby substantially elevating the precision of predictions. This contribution not only introduces innovative theories and methodologies for the analysis of gear heat but also stands as a valuable reference for the design, optimization, and maintenance of precision transmission systems.
The precision transmission system, a crucial component in modern industry and high-end technology sectors, finds widespread application across a variety of equipment and machinery. Gears, serving as the central element of the transmission system, play a decisive role in influencing the stability, efficiency, and lifespan of the entire system. In the course of gear operation, contact with the corresponding gear or gearbox is inevitable, leading to friction and, consequently, heat generation, commonly referred to as frictional heat. This heat effect not only has the potential to cause localized overheating of the gears but may also, if allowed to accumulate, adversely affect the stability and efficiency of the entire transmission system.
An analysis of the heat generated during gear operation provides a precise understanding of its production, distribution, and transfer, enabling the implementation of effective measures to mitigate heat accumulation and enhance the operational efficiency of the system. The computation of average heat flux density aids in predicting the trend of temperature rise in gears, allowing for timely interventions such as cooling and enhanced lubrication to prevent various issues arising from overheating. The analysis of heat generated during gear operation and the calculation of average heat flux density are not only pivotal for the optimization of current system performance but also serve as a guide for future system design and manufacturing, holding significant practical importance and research value. Figure 1 illustrates an experimental gearbox and the temperature measurement instrument involved in this study.
Figure 1. Experimental gearbox and the temperature measurement instrument
Each tooth of a gear possesses a unique structure and operational state. A separate analysis and calculation of the temperature for each individual tooth would considerably increase the complexity and time required for computation. It is substantially simplified when the core temperature of all teeth is assumed to be identical, facilitating a more streamlined mathematical model and computational process. In this study, the energy conservation law and Fourier's heat conduction equation are employed, assuming the temperature is represented by Y, time by y, the material's density by ϑ, internal heat source by Wt, the specific heat capacity of the material by V0, and the thermal conductivity of the material along three directions by ηz, ηt, ηx, respectively. The following steady-state temperature field model for the precision transmission system's gear can be established as:
$\vartheta V_0 \frac{\beta Y}{\beta y}-\frac{\beta}{\beta z}\left(\eta_z \frac{\beta Y}{\beta z}\right)-\frac{\beta}{\beta y}\left(\eta_t \frac{\beta Y}{\beta t}\right)-\frac{\beta}{\beta y}\left(\eta_x \frac{\beta Y}{\beta x}\right)-W_c=0$ (1)
Heat always flows from regions of higher temperature to those of lower temperature. Within the material of the gear, heat is propagated through thermal diffusion. This means that when a portion of the gear is heated by frictional heat, the elevated temperature of this part will spread to the surrounding cooler regions until equilibrium is reached. This study further constructed the heat conduction equation for the temperature field within the gear body of the precision transmission system. The core principle of the heat conduction equation is the conservation of thermal energy. In simpler terms, any frictional heat entering the gear, minus the heat lost from that section through convection, radiation, and other means, must equal the increase in thermal energy within that part. When the temperature field of the precision transmission system's gears is in a steady state, the temperature rise per unit time is assumed to be zero. The heat conduction equation expression for the gear body temperature field is given by the following equation:
$\eta\left(\frac{\partial^2 Y}{\partial^2 z}+\frac{\partial^2 Y}{\partial^2 t}+\frac{\partial^2 Y}{\partial^2 x}\right)=0$ (2)
In the modeling and analysis of the temperature field of gears within a precision transmission system, explicit boundary conditions need not be set at certain interfaces. For instance, at the instant of meshing, both tooth surfaces are in a state of tight contact. Given the near-perfect nature of this contact, the efficiency of heat transfer is exceedingly high. Consequently, it can be postulated that the temperatures at the contact points of these two meshing surfaces are identical. As such, there is no necessity to set separate boundary conditions for these contact points, as they inherently form internal interface conditions, implying equality of temperatures on either side of the contact points. Similarly, if the contact between the inner hole of the gear and the transmission shaft is also tight, the temperatures in the contact area between these two parts should also be identical. Unless there is explicit reason to believe that the contact between these two parts is imperfect, there is likewise no need to set additional boundary conditions.
In this study, boundaries were set only at the end faces, non-meshing surfaces, both sides of the tooth roots, tooth tops, and meshing surfaces. The non-meshing surfaces, which do not directly contact other gears during the operation of the gear, are equally significant in their interactions with the surrounding environment. The primary modes of heat exchange for the non-meshing surfaces are likely convection and radiation. The tooth roots, located at the base of the gear, might be affected by the frictional heat from adjacent teeth. In addition, the tooth roots may also come into contact with lubricants, which could assist in heat dissipation. Hence, the boundary conditions for this part may involve thermal interactions with adjacent teeth and the cooling effect of lubricants. The tooth tops, as the peripheral parts of the gear, might come into contact with the tooth roots or surfaces of other gears. At the instant of meshing, substantial frictional heat could be generated due to friction. The boundary conditions here may involve thermal interactions with the contacting gears. The meshing surfaces are in direct contact with the tooth surfaces of other gears during gear operation. The boundary conditions on the meshing surfaces need to account for the generation and transfer of frictional heat. When two tooth surfaces come into contact, their temperatures at the contact points will tend to equalize, as heat will flow from the hotter tooth surface to the cooler one until equilibrium is reached.
Assuming that the outward normal vector of the heat exchange surface is represented by b, the convective heat transfer coefficient for the non-meshing surfaces, both sides of the tooth roots, and the tooth tops is represented by gF, the gear temperature by yq, and the initial temperature of the lubricating oil by y0, the boundary conditions for the non-working tooth surfaces are given by the following equation:
$-\eta\left(\frac{\partial Y}{\partial b}\right)=g_F\left(y_q-y_0\right)$ (3)
Assuming that the convective heat transfer coefficient for the meshing surfaces is represented by ga, and the average heat flux density is denoted as wq, the boundary conditions for the working tooth surfaces are provided in Eq. (4).
$-\eta\left(\frac{\partial Y}{\partial n} b\right)=g_R\left(y_q-y_0\right)-w_q$ (4)
End faces are typically in direct contact with the surrounding air or other mediums. Consequently, the boundary conditions here may involve convective heat transfer, representing the thermal exchange between the gear end faces and the air. Additionally, the end faces might also be subject to external radiation, particularly at elevated temperatures. Assuming that the convective heat transfer coefficient for the end faces is denoted by gR, and the temperature of the air inside the gear casing is represented by Ys, the boundary conditions for the end face locations are given in Eq. (5).
$-\eta\left(\frac{\partial Y}{\partial b}\right)=g_R\left(y_q-y_s\right)$ (5)
The computation of the average heat flux density for gears in precision transmission systems is an intricate process, involving various factors. Initially, the actual area of contact on the tooth surface must be considered, which is typically dependent on the design and manufacturing precision of the gear. Subsequently, the frictional heat is calculated based on the coefficient of friction and the contact pressure on the tooth surface. Frictional heat is the thermal energy generated due to friction between the tooth surfaces. Assuming that the thermal energy conversion coefficient is represented by ε, the average contact pressure is denoted by o, the friction factor is indicated by d, and the relative velocity at the meshing point of the transmission system is represented by C, the formula for calculating the heat flux density is:
$w_q=\varepsilon o d C$ (6)
The calculation of the average contact pressure between two meshing tooth surfaces necessitates knowledge of the load borne by the gears during the meshing process. In this study, appropriate contact mechanics theory was utilized, with the Hertz contact theory being selected to determine the average contact pressure between the two tooth surfaces, and the calculation formula is:
$o=\frac{\tau}{4} \sqrt{\frac{O}{\tau M} \frac{\frac{1}{E_1}+\frac{1}{E_2}}{\frac{1-\omega_1^2}{R_1}+\frac{1-\omega_2^2}{R_2}}}$ (7)
Using the average contact pressure and friction coefficient obtained in the previous step, the frictional heat flux density can be calculated, further yielding the heat generated per unit area during the gear meshing process. Assuming that the frictional heat flux densities for the meshing tooth surfaces are represented by w1j and w2j, and the allocation coefficient of the frictional heat flux is denoted by α, the calculation formula is given in Eq. (8).
$\left\{\begin{array}{l}w_{1 j}=\alpha w_q \\ w_{2 j}=(1-\alpha) w_q\end{array}\right.$ (8)
Not all of the frictional heat generated will be absorbed by the gears; a portion of the heat may be dissipated into the environment or absorbed by the lubricant. Based on experimental data or other relevant theories, the allocation coefficient α in this context represents the ratio of the actual frictional heat entering the gears to the total frictional heat generated. Assuming that the thermal conductivity of the materials for the driving and driven gears is denoted by η1 and η2, respectively, the density of the materials for the driving and driven gears is represented by ϑ1 and ϑ2, respectively, and the specific heats of the materials for the driving and driven gears are denoted by v1 and v2, respectively, then the calculation formula is given in Eq. (9).
$\alpha=\frac{\sqrt{\eta_1 \vartheta_1 v_1 C_{t 1}}}{\sqrt{\eta_1 \vartheta_1 v_1 C_{y 1}}+\sqrt{\eta_2 \vartheta_2 v_2 C_{y 2}}}$ (9)
The time required for a gear to complete one revolution can be determined based on the gear's rotational speed and number of teeth. Assuming the contact semi-width at any meshing point j in the gear transmission system is represented by 2N, the time taken for the gear to traverse point j can be calculated using the following formula:
$\left\{\begin{array}{l}y_{1 j}=\frac{2 N}{C_{1 j}} \\ y_{2 j}=\frac{2 N}{C_{2 j}}\end{array}\right.$ (10)
The time required for a gear to complete one revolution can be calculated using the following formula:
$\left\{\begin{array}{l}y_1=\frac{60}{b_1} \\ y_2=\frac{60}{b_2}\end{array}\right.$ (11)
At any arbitrary meshing point kj, the average heat flux density generated over one revolution of the driving and driven gears is to be determined as follows:
$\left\{\begin{array}{l}w_1=\frac{y_1 j}{y_1} w_{1 j} \\ w_2=\frac{y_2 j}{y_2} w_{2 j}\end{array}\right.$ (12)
The prediction of heat generated during the operation of gears in precision transmission systems is pivotal, as changes in temperature directly impact the lifespan, efficiency, and reliability of gear operation. Accurate prediction of these thermal variations enables engineers to make informed decisions during the design and operational processes.
Figure 2. Modeling process of the thermal prediction model during gear operation
Traditional prediction methodologies rely heavily on extensive experimental data or complex numerical simulations. These approaches are not only time-consuming but also necessitate specialized knowledge for data processing and interpretation. Additionally, gears frequently experience various load changes in practical applications, leading to dynamic variations in heat generation and dissipation. These dynamic changes are often overlooked by traditional prediction methods, resulting in inaccuracies. Given the high non-linearity of gear thermal behavior due to factors such as lubrication, material properties, and friction, employing traditional linear methods for prediction proves to be challenging.
Compared to other deep learning methods, the TCN excels in capturing long-term temporal dependencies, implying that behaviors observed at earlier time points can be captured and considered in predictions. In light of the dynamic and non-linear nature of heat generation during gear operation, a thermal prediction system for gears in precision transmission systems was constructed based on the TCN model in this study. Real-time operational parameters of the gears were inputted, and future heat distribution was predicted, based on actual operational data. The modeling process of the thermal prediction model during gear operation is depicted in Figure 2.
For accurate prediction of heat generated during the operation of gears in precision transmission systems, a series of input features closely related to the thermal behavior of gears need to be considered. These include: 1) rotational speed data: real-time rotational or angular speed of the gears; 2) torque or load data: real-time torque or force transmitted to or from the gears; 3) oil temperature/lubricant temperature data: temperature of the liquid or oil used for gear lubrication; 4) previous heat data: past thermal data reflecting previous temperature trends of the gears; 5) ambient temperature data: air temperature surrounding the gear system; 6) vibration data: frequency and amplitude of vibrations during gear operation; 7) operating duration/accumulated operating time: time elapsed since the last shutdown or maintenance of the gears; 8) lubricant flow and pressure data: flow rate and pressure of the lubricating oil.
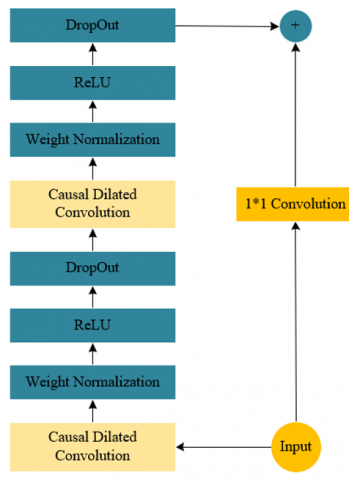
Figure 3. Overall structure of the heat prediction model for gear operation
Figure 3 provides an overview of the entire structure of the gear operation heat prediction model based on the TCN model. The construction of the TCN model primarily involves three core modules: causal convolution, dilated convolution, and the residual block. In causal convolution, it is ensured that the model, when predicting the output at the current moment, only utilizes information from prior to that moment, thus avoiding issues of data leakage. This is crucial for the prediction of gear heat, as future data is unknown in real applications. Through causal convolution, the model is enabled to learn causal relationships within the time series, leading to more accurate predictions of gear thermal behavior. Within causal convolution, the convolution kernel slides only over the left side or previous time steps of the input data, meaning the output at any time point depends solely on the input at that time point and before. By adjusting the position of the convolution window, the use of future data for current predictions is prevented. Given a convolution kernel represented as D=(d1,d2,...,dj) and an input sequence represented as Z=(z1,z2,...,zj), with the convolution operation denoted by “*”, the causal convolution at point zy is defined:
$(D * Z)_{\left(z_y\right)}=\sum_{j=1}^J d_j z_{y-J+j}$ (13)
Dilated convolution is employed to help the model capture long-range dependencies without increasing the number of parameters or computational complexity. Given that the thermal behavior of gears may be influenced by factors over extended time scales, such as prolonged operation or periodic load changes, dilated convolution assists the model in learning these long-term dependencies, enhancing prediction accuracy. Dilated convolution operates by inserting "holes" between each element of the convolution kernel, expanding its coverage of the input while maintaining a constant kernel size. The dilation rate is introduced, and can be gradually increased with each layer, enabling the network to capture a larger contextual range without additional parameters.
The residual block addresses the issues of vanishing and exploding gradients in deep networks, allowing for the learning of deeper representations. The thermal behavior of gears is a complex process, potentially influenced by multiple interacting factors such as lubrication, load variations, and environmental conditions. Through deep learning, the model is capable of extracting higher-level features from data, leading to enhanced predictions of gear thermal behavior. The residual block also facilitates rapid convergence and increases training stability. Within the block, the input is split into two paths: one undergoing a series of convolutions and non-linear operations, and the other forming a direct connection. The results from both paths are summed at the end of the block. When the network attempts to learn the identity mapping, the residual block’s skip connection provides a straightforward path. This ensures that even if other parts of the network fail to learn the identity mapping, the skip connection can easily accomplish it. Additionally, skip connections aid in the back-propagation of gradients throughout the network, enhancing training stability and efficiency. Given an input value Z for the residual module, the potential identity mapping function across layers represented as D(Z), the output value P of the residual module is calculated as follows:
$P=\operatorname{Activation}(Z+D(Z))$ (14)
The detailed elucidation of the prediction process for the gear operation heat prediction model in the TCN precision transmission system is given below:
(1) Data Preprocessing: Prior to prediction, data collected during the operation of gears in precision transmission systems must be subjected to preprocessing. Data may be sourced from a variety of sensors, such as thermal sensors, speed sensors, and pressure sensors, all of which can provide critical information regarding the thermal dynamics of gear operation. Steps in preprocessing may include data cleaning, normalization, and standardization to adapt it to the model’s input requirements.
(2) Time Series Segmentation: The preprocessed time series data is then divided into multiple segments based on the size of the model’s time window. Each segment encompasses historical data used for prediction purposes.
(3) Convolutional Processing: The data within these segments firstly undergoes causal convolution, ensuring predictions are solely based on past data and thus unaffected by future data. The data, post-causal convolution, is then fed into multiple layers of dilated convolution. These dilated convolutions capture both long-term and short-term dependencies within the data, allowing for a more comprehensive understanding of the thermal variations in gears. Subsequent to dilated convolution, the data enters multiple residual blocks, which provide depth and complexity to the model while ensuring stability in training, particularly when capturing complex thermal dynamics.
Figure 4. Prediction process of the gear operation heat prediction model
(4) Prediction Output: Eventually, the model outputs a thermal prediction for the given time window. This prediction indicates how the gear’s temperature is expected to vary in a specific future time window, based on historical data.
(5) Post-processing: After predictions are made, a series of post-processing operations, such as reverse normalization, may be performed to convert the predicted thermal data back to its original scale and units.
Figure 4 illustrates the prediction process of the gear operation heat prediction model.
Figure 5. Flash temperature curve of tooth surface considering friction heat
In this study, an advanced thermodynamic model has been employed to conduct a thorough and meticulous analysis of the heat generated during gear operation. In order to capture the distribution of gear heat more precisely, a method for calculating average heat flux density has been designed, aiming to provide more reliable measurement data for practical applications. From the flash temperature curve of the tooth surface considering friction heat as depicted in Figure 5, variations in the flash temperature of the tooth surface at two different friction coefficients (0.08 and 0.09) can be observed. When the friction coefficients are 0.08 and 0.09, as the variable changes from “less than -1” to “1” (potentially representing a certain specific motion parameter or state), the flash temperature of the tooth surface initially decreases significantly, then reaches its minimum near a certain central point, and subsequently gradually increases. The curve at a friction coefficient of 0.09 is relatively close to that at 0.08 across the entire range, yet noticeable differences exist at certain points. Particularly near the central point, the flash temperature values of the curve at a friction coefficient of 0.09 are slightly higher than those at 0.08.
It can be concluded that the flash temperature of the tooth surface is closely related to the friction coefficient. A higher friction coefficient results in a relatively higher flash temperature of the tooth surface. This could be attributed to the fact that an increase in the friction coefficient leads to the generation of more frictional heat, thereby raising the temperature of the tooth surface. Regardless of the magnitude of the friction coefficient, the flash temperature of the tooth surface exhibits a V-shaped variation with the change of certain specific parameters or states, possibly indicating some inherent thermal dynamic characteristics. It is clearly demonstrated through the advanced thermodynamic model and the method for calculating average heat flux density devised in this study, that the distribution of gear heat and its relationship with the friction coefficient have been successfully captured.
Figure 6. Temperature distribution of tooth surface along the line of action
In Figure 6, the temperature distribution of the tooth surface along the line of action is depicted. It is observed from the figure that, within the range from "less than -1" to "1," both the driving tooth surface and the driven tooth surface exhibit a trend of temperature increase followed by a decrease. The temperature of the driving tooth surface is consistently higher than that of the driven tooth surface. Under identical conditions, the peak temperature of the driving tooth surface exceeds 110 degrees, whereas the peak temperature of the driven tooth surface is close to 104 degrees. The temperature difference between the two is maximized near the central point, and subsequently, the difference gradually diminishes.
It can be concluded that along the line of action, the temperature of the tooth surface initially increases, reaches a peak near the central point, and then gradually decreases. This may be related to the previously mentioned thermal dynamic characteristics, as well as the distribution of frictional heat generated during the meshing process. The temperature of the driving tooth surface is consistently higher than that of the driven tooth surface, potentially due to the driving tooth surface experiencing greater loads and friction, resulting in the generation of more frictional heat. The greatest temperature difference between the two is observed near the central point, possibly due to the most pronounced effects of meshing, leading to the maximum difference in frictional heat. Through this figure, the thermal dynamic characteristics of the gear and the temperature difference between the driving and driven tooth surfaces are distinctly observed. This meticulous analysis of temperature distribution is based on the thermodynamic model and the method for calculating average heat flux density mentioned previously. The figure provides an in-depth and detailed analysis of the thermal dynamics of the gear, further validating the high effectiveness and reliability of the models and methods proposed for practical applications.
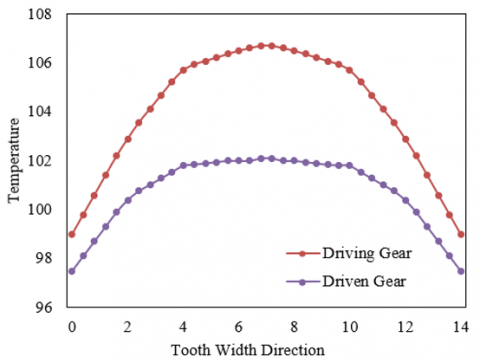
Figure 7. Temperature distribution of tooth surface along the tooth width
In Figure 7, the temperature distribution of the tooth surface along the tooth width is displayed. Observation from the figure reveals that a distinct symmetry in the temperature distribution along the tooth width is exhibited by both the driving and driven tooth surfaces, reaching a maximum value at the center position. The temperature of the driving tooth surface is consistently observed to be higher than that of the driven tooth surface. Particularly at the center of the tooth width, the peak temperature of the driving tooth surface exceeds 105 degrees, while the peak temperature of the driven tooth surface is close to 104 degrees. Within the range from 0 to the center point, a gradual increase in tooth flank temperature is noted, while from the center point to 14, a gradual decrease in temperature is observed.
Based on the data presented in the figure, the following conclusions are drawn: along the tooth width, the tooth flank temperature reaches its maximum at the center position, subsequently decreasing gradually towards both sides. This symmetrical temperature distribution is likely related to the operational principles of the gear and the distribution of frictional heat generated during the meshing process. The consistent observation of higher temperatures in the driving tooth surface, in comparison to the driven tooth surface, aligns with previous analyses, potentially attributable to the greater loads and friction borne by the driving tooth surface. The symmetry of the temperature distribution and the localization of the peak value at the center position further corroborate the uniform distribution of frictional heat along the tooth width.
Figure 8. Temperature rise calculation results at gear nodes
In Figure 8, the temperature rise calculation results at the gear nodes are depicted. It is observed from the graph that all curves reach their peak values at the position 0 on the x-axis, potentially representing the highest point or the center point of gear engagement. The temperature rise near the lower surface" and the temperature rise in the middle layer nearly coincide at the peak value, and the magnitudes of their temperature rises are quite close. Conversely, the temperature rise at the upper surface and the temperature rise near the upper surface are relatively lower, yet their trends are remarkably similar. The rate of cooling following the peak temperature rise is notably faster for the temperature rise near the lower surface" and the temperature rise in the middle layer compared to the temperature rise at the upper surface and the temperature rise near the upper surface. From the figure, it can be inferred that the temperature rise is most significant at the center point or the highest point of gear engagement, consistent with the principles of concentrated heat generation and heat distribution due to friction. Looking at the cooling rates, the heat at the central part dissipates more quickly, potentially related to the material, structure, or operational mode of this gear section. This graph of temperature rise calculations reveals the thermal characteristics of different parts of the gear during operation, aiding in a more comprehensive understanding of the gear's thermal dynamic behavior and the impact of frictional heat. This precise analysis is grounded in the thermodynamic model previously mentioned. The results of this graph further validate the efficiency and accuracy of the model and method proposed in this document for analyzing gear temperature.
Table 1. Prediction errors of different models
|
|
|
Proposed Model |
GRU |
LSTM |
RF |
ARIMA |
|
Training set |
MSE |
0.12 |
0.13 |
0.14 |
1.02 |
1.05 |
|
MAE |
0.32 |
0.38 |
0.41 |
1.03 |
1.04 |
|
|
RMSE |
0.33 |
0.38 |
0.41 |
0.81 |
0.81 |
|
|
Test set |
MSE |
0.07 |
0.11 |
0.12 |
0.83 |
0.92 |
|
MAE |
0.31 |
0.42 |
0.45 |
0.91 |
0.94 |
|
|
RMSE |
0.41 |
0.55 |
0.57 |
0.72 |
0.72 |
From Table 1, the performance differences in predicting gear heat generation among various models are clearly demonstrated. In comparison to other models, the model proposed in this study consistently exhibits superior performance across all evaluation metrics. Lower Mean Squared Error (MSE), Mean Absolute Error (MAE), and Root Mean Squared Error (RMSE) values are observed for this model, indicating a more accurate fit to the training data. Notably, the errors associated with this model are significantly smaller than those of the traditional ARIMA model, underscoring the effectiveness and advanced nature of the introduced time series convolutional network.
On the test set, the proposed model continues to outperform, manifesting lower MSE, MAE, and RMSE values relative to other models. When compared to common RNN structures such as GRU and LSTM, the proposed model demonstrates smaller prediction errors, reconfirming its robust non-linear fitting capabilities and capacity to capture dynamic changes in gear heat generation. In comparison to Random Forest and ARIMA models, a clear enhancement in prediction accuracy is evident with the proposed model, highlighting its suitability for this specific application.
In conclusion, the gear heat generation prediction model constructed in this study is evidently superior to other comparative models. Across all evaluation metrics, lower errors are consistently displayed by the proposed model, both on the training and test sets, validating its superiority in terms of prediction precision and generalization capabilities. These results underscore the efficiency and accuracy of time series convolutional networks in addressing gear heat generation prediction challenges, introducing an effective predictive tool to the field.
1) Training set
2) Test set
Figure 9. Prediction errors of different models on different sample sets
Figures 9-1 and 9-2 respectively depict the prediction errors of different models on the training and testing sample sets. As can be observed from Figure 9-1, the error bars of TCN (the model proposed in this study) are lower across all three evaluation metrics (MSE, MAE, RMSE), indicating its exemplary performance on the training data. A slight increase is noticed in GRU and LSTM compared to TCN, yet their errors remain relatively close, showcasing the advantages of RNN structures in handling time series data. The errors associated with RF and ARIMA are comparatively higher, especially in terms of MSE and MAE, suggesting that these two methods may be less suitable for this problem or might require further parameter tuning. Figure 9-2 illustrates that the TCN model continues to demonstrate its superiority on the test set, with its error bars being the lowest across all three evaluation metrics, emphasizing its commendable generalization capabilities. The testing errors of GRU and LSTM are similar to their training errors, maintaining a low level, yet are slightly higher than those of TCN. The errors of RF and ARIMA further widen on the test set, particularly for ARIMA, where the errors significantly surpass those of the other models.
From the above figures, it is vividly evident that the gear heat generation prediction model (TCN) constructed in this study exhibits significant advantages, both on the training and testing sample sets. Compared to other models, the TCN model has smaller prediction errors, validating its effectiveness and accuracy in predicting gear heat generation during operation. These results not only highlight the efficiency of time series convolutional networks in handling such issues but also provide a powerful and reliable tool for gear heat prediction.
In this study, an advanced thermodynamic model has been utilized to conduct a comprehensive and meticulous analysis of heat generation during gear operation. A method for calculating average heat flux density has been designed, aiming to provide more reliable measurement data for practical applications. For the first time, an attempt has been made to introduce TCN into the field of gear heat prediction, with a focus on studying the dynamic characteristics and nonlinear behavior of gears. The dynamic characteristics and nonlinear behavior during gear operation have been fully considered, with the aim of enhancing the accuracy of predictions. To validate the effectiveness of the new model, comparisons have been made with other common prediction models such as GRU, LSTM, RF, and ARIMA.
Experimental results have demonstrated that the TCN model exhibits favorable prediction performance in experiments involving gear surface temperature distribution, temperature distribution along the gear width, and temperature rise calculations at gear nodes. The prediction error analysis of different models reveals that the errors of the TCN model are lower than those of other models, both on the training and testing sets, particularly when compared to RF and ARIMA, highlighting the TCN's distinct advantages. The proposed model has shown not only exemplary performance on training data but, more importantly, outstanding generalization capabilities on testing data.
This research has successfully introduced the TCN into the field of gear heat prediction and validated its superior predictive performance through a series of experiments. Compared to other commonly used models, the TCN has demonstrated higher accuracy and generalization capabilities in handling the dynamic characteristics and nonlinear behavior of gear operation. This study provides a new and efficient method for predicting gear heat, potentially offering valuable references for research in related fields.
This paper is supported by the National Natural Science Foundation of China project (Grant No.: U1804162) and the Henan Institute of Engineering Cultivation Fund (Grant No.: PYXM202019).
[1] Golbakhshi, H., Namjoo, M. (2017). Thermo-structural analysis on evaluating effects of friction and transient heat transfer on performance of gears in high-precision assemblies. Journal of Central South University, 24(1): 71-80. https://doi.org/10.1007/s11771-017-3410-3
[2] Nakamura, K., Koresawa, H., Narahara, H. (2018). One action press forming of helix bevel gear by using multi-cylinder press and die heating system. International Journal of Automation Technology, 12(5): 767-774. https://doi.org/10.20965/ijat.2018.p0767
[3] Hamzah, M.N., Merza, A.S. (2023). Geometric optimization of spur gears for stress reduction and enhanced performance. Mathematical Modelling of Engineering Problems, 10(3): 943-950. https://doi.org/10.18280/mmep.100326
[4] Li, H.P., Li, Z.H. (2010). Failure of rotary forging die and its finite element simulation. In 2010 Third International Symposium on Information Processing, Qingdao, China, pp. 372-375. https://doi.org/10.1109/ISIP.2010.109
[5] Concli, F., Gorla, C. (2021). Dynamic modeling of gears: an innovative hybrid FEM–analytical approach. International Journal of Computational Methods and Experimental Measurements, 9(2): 117-125. https://doi.org/10.2495/CMEM-V9-N2-117-125
[6] Li, H.P., Liu, Z.H. (2010). Straight bevel gear cold rotary forging technology and its CAPP system development. In International Conference on Advanced Technology of Design and Manufacture (ATDM 2010), Beijing, China, pp. 471-475. https://doi.org/10.1049/cp.2010.1347
[7] Hassan, A.R., Hawas, M.N., Abdullah, A.R., Majdi, H.S., Habeeb, L.J. (2023). High-speed helical gear design parameters effect on the dynamic stress. Mathematical Modelling of Engineering Problems, 10(4): 1189-1198. https://doi.org/10.18280/mmep.100411
[8] Qin, F., Qi, H., Li, Y., Liu, C., Qi, H., Kang, Y. (2021). Technology of integrated manufacturing in forming and modification of aluminum alloy rings. Cailiao Daobao/Materials Reports, 35(9): 9049-9058.
[9] Concli, F., Fraccaroli, L. (2023). Investigation of the fatigue strength behaviour of a fine 2 mm module gear. International Journal of Computational Methods and Experimental Measurements, 11(2): 73-78. https://doi.org/10.18280/ijcmem.110202
[10] Syam, S., Kurniati, S., Ramang, R. (2020). Design and characteristics of axial magnetic gear using rectangular magnet. Journal Européen des Systèmes Automatisés, 53(2): 167-175. https://doi.org/10.18280/jesa.530202
[11] Zheng, T.C., Qiu, Z.X., Shao, J.X., Lu, G., Yuan, J. (2019). Design and experimental analysis for quantitative glue-pouring system of aluminium electrolytic capacitor. International Journal of Industrial and Systems Engineering, 32(3): 287-303. https://doi.org/10.1504/IJISE.2019.101111
[12] Mastrone, M.N., Concli, F. (2022). Application of the GRAMC mesh-handling strategy for the simulation of dip and injection lubrication in gearboxes. International Journal of Computational Methods and Experimental Measurements, 10(4): 303-313. https://doi.org/10.2495/CMEM-V10-N4-303-313
[13] Concli, F., Maccioni, L., Gorla, C. (2020). Development of a computational fluid dynamics simulation tool for lubrication studies on cycloidal gear sets. International Journal of Computational Methods and Experimental Measurements, 8(3): 220-232. https://doi.org/10.2495/CMEM-V8-N3-220-232
[14] Tian, X., Qing, T., Li, Z., Han, W., Li, W. (2023). Study on the influence of heat on deformation and stress of planetary gear transmission. Journal of Failure Analysis and Prevention, 23(1): 399-413. https://doi.org/10.1007/s11668-022-01587-3
[15] Casalino, G. (2005). Laser welding of the synchronizer stop ring and the rear gear in a manual transaxle. Journal of Laser Applications, 17(3): 171-177. https://doi.org/10.2351/1.1961722
[16] Miller, J.B., Shankar, R., Walters, J. (2013). Numerical simulation advances in gear manufacturing processes. In ASM International - 27th Heat Treating Society Conference 2013, Indiana, USA, pp. 173-176.
[17] Heuer, V., Bolton, D., Friedel, J. (2021). Enhanced Distortion Control - ISO Class 8 Gears After Case Hardening. In American Gear Manufacturers Association Fall Technical Meeting 2021, Fenton, Michigan, USA, pp. 292-308.
[18] Stroh, J., Sediako, D. (2019). Residual stress characterization for marine gear cases in as-cast and T5 heat treated conditions with application of neutron diffraction. In Light Metals 2019, Quebec City, Canada, pp. 395-399. https://doi.org/10.1007/978-3-030-05864-7_50
[19] Guo, M., Dai, Y., Huang, B. (2023). Application status and development of laser powder bed fusion technology in typical electromechanical aviation products. Zhongguo Jiguang/Chinese Journal of Lasers, 50(16): 1602304. https://doi.org/10.3788/CJL230452
[20] Newill-Smith, D., Shatts, J., Dillon, R.P., Karras, J., Brinkman, A., Backus, S., Fleischner, R. (2023). Cold Operable Lunar Deployable Arm (COLDArm) System Development and Test. In 2023 IEEE Aerospace Conference, Big Sky, MT, USA, pp. 1-19. https://doi.org/10.1109/AERO55745.2023.10115649
[21] Monica, Z., Banaś, W., Ćwikla, G., Topolska, S. (2017). Modelling of teeth of a gear transmission for modern manufacturing technologies. Materials Science and Engineering, 227(1): 012080. https://doi.org/10.1088/1757-899X/227/1/012080
[22] Jiang, X., Zhou, C., Su, J., Jin, G., Shen, R. (2023). Injection parameter design to improve the high-speed gear heat dissipation: CFD simulation and regression orthogonal experiment. Simulation Modelling Practice and Theory, 128: 102795. https://doi.org/10.1016/j.simpat.2023.102795
[23] Yang, X., Zeng, L., Chen, P., Du, Y., Li, B. (2022). Complex characteristics and multi-dimensional control strategies of heat flow in dry gear hobbing machines. China Mechanical Engineering, 33(5): 623-629. https://doi.org/10.3969/j.issn.1004-132X.2022.05.012
[24] Xiang, Y., Lin, T., Liu, W. (2022). Characteristics of internal flow field and convection heat transfer in planetary gear reducer of shield machine. In Journal of Physics: Conference Series, 2383(1): 012023. https://doi.org/10.1088/1742-6596/2383/1/012023
[25] Yi, J., Yi, T., Guo, Z.F., Chen, B. (2022). Analytical modeling and experimental verification of the depth of subsurface heat-affected layer in gear profile grinding. The International Journal of Advanced Manufacturing Technology, 121(5-6): 4141-4152.
[26] Yang, S., Chen, W., Nong, S., Dong, L., Yu, H. (2022). Temperature field modeling in the form grinding of involute gear based on high-order function moving heat source. Journal of Manufacturing Processes, 81: 1028-1039. https://doi.org/10.1016/j.jmapro.2022.07.014
[27] Xiao, N., Zhang, C., Hui, W., Che, H., Yang, Z. (2023). Study of an economical and effective heat treatment method to improve the performance of gear steels. Steel Research International, 94(8): 2300030. https://doi.org/10.1002/srin.202300030
[28] Yang, C., Chen, C., Yang, P., He, Z., Li, Z., Li, F. (2023). Effect of austenitizing temperature on microstructure, strength and toughness of gear and bearing steel with ultrahigh strength and high heat-resistant. Cailiao Gongcheng/Journal of Materials Engineering, 51(2): 98-105. https://doi.org/10.11868/j.issn.1001-4381.2021.000418
[29] Mazumder, N.U.S., Mandal, S., Agnew, R.J., Petrova, A., Boorady, L.M., Song, G. (2022). Characterizing the tensile strength of the fabrics used in firefighters’ bunker gear under radiant heat exposure. Polymers, 14(2): 296. https://doi.org/10.3390/polym14020296
[30] Li, W., Jia, J., Li, Z., Cui, H., Lu, X., Min, J., Liu, Z., Li, S., Jia, J. (2021). Research on the temperature measurement of C919 aircraft landing gear during heat treatment. High Temperatures - High Pressures, 50(3): 197-212.