
Mukul Bhatnagar | Nitin Pathak | Sanjay Taneja*
(This article is part of the Special Issue: Sustainability Development through Green Economics-A New Paradigm in the World of Business)
© 2023 IIETA. This article is published by IIETA and is licensed under the CC BY 4.0 license (http://creativecommons.org/licenses/by/4.0/).
OPEN ACCESS
Current advancements in the economic inclusion plan of the state of India strengthen the quality of financial inclusion as a fundamental foundation for inclusive growth. Objectives - The research is conducted to compare the influence of various awareness sources on economic policies introduced by the government. It will also focus on the measurement of the effectiveness of various communication mediums in persuading people to register for the Jan Dhan Yojna. Methodology - People's responses were analyzed by applying binary logit regression to find the probability of getting registered under Jan Dhan Yojana based on various communication mediums. Findings - Tech-optimists are more likely to be financially aware of the benefits of PMJDY and other government schemes. Value - The result of the study would enable the government to use the appropriate medium of communication to spread financial literacy.
economic policies, PMJDY, social media technology, banks, peer, tech-optimists, financial awareness, financial inclusion
The dissemination of government economic policy has also undergone fast change as new channels of communication have emerged in the age of digitization. Tech-optimists claim that the development of new technologies will eventually lead to the elimination of all issues and the expansion of the economy. However, the issue arises as to whether or not these channels of information effectively inform the public about the economic policies of the government. In this research, we examine the methods governments employ to distribute financial education and assess how well these strategies work to increase the general public's financial literacy. Our goal is to aid policymakers in making educated decisions about the best ways to communicate financial education to the masses by conducting a thorough review of relevant literature and conducting empirical analysis. If you want to know how technology is changing financial education and what methods work best for spreading economic policies in the modern day, you need to read this paper.
In the wave of digital marketplace community, the usefulness and benefits of digital Inclusive Banking have been highlighted [1]. Current advancements in the economic inclusion plan of the state of India strengthen the quality of financial inclusion as a fundamental foundation for inclusive growth [2]. Even before 2020, the use of social media in financial services was substantial. Then the epidemic significantly transformed the connection with consumers. Social networks are becoming unnegotiable [3]. During the epidemic, social media altered the nature of customer interactions for 90% of financial advisers [4]. This year, more than half of those that introduced new businesses expanded their usage of social media [5].
Technology optimism is the conviction that technology can be enhanced to enrich individuals' lives and the planet as a whole [6]. You are a techno-optimist if you believe that technological advancements will continue to improve our lives [7]. You acknowledge that technological innovation is the answer to society's issues [8].
The growth of every economy continues to face new fundamental difficulties. The same is true of India [9]. India was one of the world's fastest-growing economies. Nevertheless, it was a source of considerable worry for policymakers that, despite spectacular growth, 41 per cent of India's population remained unbanked, including its banking industry [10]. A large section of the unbanked population is still reliant on conventional credit sources like money lenders, huge landowners who use it to charge excessive interest rates [11]. Such financial exclusion expands the inequality gap and negatively impacts long-term economic development [12]. Several studies have shown that both financial and financial inclusion are essential tools for inclusive economic development [13]. Financial inclusion has thus been recognised as one of the World Bank's Sustainable Development Goals [14]. This means enhancing the financial inclusion of disadvantaged groups without access to financial services, reducing poverty, instilling the habit of saving, boosting capital creation, etc. [15].
This research has focused on finding the most effective medium of communication of awareness of PMJDY (Pradhan Mantri Jan Dhan Yojna). PMJDY is an Indian State financial inclusion initiative (under the age of 10 and above may also establish a custodial account) designed to increase inexpensive approach to monetary services such as bank accounts, remittances, loans, insurance and pensions [16]. On 28 August 2014, Prime Minister Narendra Modi started this financial inclusion programme. On his first Independence Day address on 15 August 2014, he unveiled this plan [17].
PMJDY is a National Mission on Financial Inclusion that takes a complete attempt to ensure that all families in the nation have access to financial services [18]. As part of the idea, every home would have at least one primary bank account [19], and people would be taught financial literacy skills and be able to apply for loans [20], insurance, and retirement plans [21]. With the RuPay Debit card, the recipients will also get accident insurance coverage of a million rupees [22]. Direct benefits transfer (DBT) is a Union Government initiative that transfers money directly from the federal, state, or local governments to people's bank accounts [23]. For Financial Inclusion, the Scheme also plans to leverage mobile transactions via telecom companies and their established centres as Cash Out Points [24]. As part of this Mission Mode Program [25], efforts are also being made to engage the country's youth [26].
Promoting economic growth and development requires an emphasis on financial literacy. Budgeting, savings, investing, and debt management are just few of the financial concepts that people need to grasp in order to make good choices with their money. Governments throughout the globe have launched several programs in recent years to increase citizens' financial literacy. However, the success of these efforts is heavily dependent on the dissemination channels used.
With the rise of the internet and other forms of digital communication, governments are starting to spread financial literacy messages through these channels. These channels have gained in popularity as a result of their extensive reach, easy availability, and low production costs. It is unknown, however, whether or not these channels are helpful in their stated goal of increasing financial literacy. Furthermore, those who do not have access to technology or are not comfortable utilizing digital platforms may be left out due to the prevalence of digital communication media.
Newspapers, television, and radio, on the other hand, have all been utilized for decades to communicate financial education. One of the benefits of these formats is that they may reach a larger audience than ever before, regardless of their level of technical expertise. They may not be as successful, however, in getting the attention of younger people or those who prefer digital formats for receiving news and other information.
Therefore, studies assessing the usefulness of different channels of communication in disseminating financial literacy information are crucial. The dedication of this study is to give a thorough analysis of the literature and empirical facts about the most successful channels of government financial education dissemination. The outcomes of this study will be essential in determining the most efficient means of disseminating financial education to the general public and in guiding policymakers in their pursuit of this goal.
This paper measures the impact of social media technology, role of banks, interactions with peer and relatives in registration for PMJDY- Pradhan Mantri Jan Dhan Yojna. By "social media," we mean computer-based platforms for exchanging views, ideas, and information in online communities [27]. The internet-based nature of social media facilitates the rapid electronic transmission of material, such as personal data, documents, films, and photographs, among its members [28]. Computers, tablets, and smartphones with web-based software or apps are often used to access social media. Indonesia, for example, uses social media at a far higher rate than any other Asian country [29]. In contemporary years, financial education has been given a lot of attention by governments worldwide [30]. It is widely accepted that a nation with a high degree of financial literacy has a higher percentage of its citizens who bank [31]. Hence, the banking industry and the economy as a whole are active [32]. Banks are under a lot of pressure to develop new products and services that benefit a more comprehensive range of people [33]. They should consider the quality of the services they provide, the interest rates they charge on their loans, and the repercussions of the money each customer places in their accounts [34]. PISA calculations confirm a significant correlation concerning financial literacy and family discussion on money problems [35]. Peer effects are essential in fostering financial literacy [36]. Good behaviour is enhanced by personal significance, societal standards, and peer influences [37].
Since financial exclusion may lead to social exclusion, banks should evaluate their capabilities and local expertise to upgrade financial inclusion and literacy [38]. The idea was bolstered by Ghirmai, who discussed the importance of financial guidance, banking services, and access to credit [39]. The research also found that the country's economic growth might be boosted by fostering financial inclusion [40]. In contrast, the rural population, household size, literacy rate, paved road networks, Internet, and deposit penetration were all indicated by Sanderson et al. [41] as major drivers of financial inclusion. The goal of financial inclusion should extend beyond just giving access to credit, and should include the provision of savings, insurance, and other services [42]. All of this is doable with the help of either sound banking counsel or widespread literacy programmes. Some researchers [43, 44] who conducted a similar investigation, also stressed the need of remembering those who are often overlooked.
National and international development organisations address the dissertation of involvement in expansion financing to the impoverished in the global south. Such a discourse, often called financial inclusion, enables development actors to employ its exceedingly nuanced information technology and social media to target the poor, take part in critical economic pronouncements distressing their lives, and access products that advance their material conditions to secure their credit ratings [45, 46].
A high level of social media penetration in South Africa does not necessarily translate into high levels of mobile money usage. Conversely, Zimbabwe has a greater rate of adoption of mobile money, but it has lower rates of penetration in social media. The adoption of mobile money in Zimbabwe is a success due to a lower degree of financial inclusion than in South Africa. Mobile money thus tends to relieve the lower degree of financial inclusion [47].
If there is a reduction in the number of bank branches in the rural community, the P2P loan requests rise when at least one bank branch may take part in the P2P market in the community. We also discover that the number of requests for P2P credits from metropolitan regions is more significant if these areas have fewer pawnshops per person. Our findings indicate that P2P promotes the financial integration of people who lack conventional institutions in rural areas and provides an option to those with fewer urban periphery banks [48].
The social significance in disseminating financial awareness of PMJDY is significantly lower than other products on the subsistence market. The impact of social network transmission and ATM is relatively more significant. We examine the processes behind this phenomenon and argue that word-of-mouth and network effects are the most likely explanations for why this phenomenon has been seen [49].
A novel peer monitoring method to encourage agents to disclose mutual gains may be utilised in conjunction with profit-sharing, enhancing individual borrower profit-sharing arrangements. Then we compare interest-oriented loans with profit-sharing loans in individual and parallel surveillance settings and provide circumstances under which profit-sharing contracts with peer surveillance outstrip interest-oriented contracts regarding borrower welfare [50].
The increasing adoption of blockchain technologies in peer-to-peer (P2P) lending platforms provides secure, transparent and rapid access to money without dealing with banks' more complicated and expensive procedures. In addition, this study aims to investigate trust-enhancing heuristics that reveal the need for blockchain to help monitor and recover problematic loans. Investors with financial trauma tend to raise and lend more considerable sums to lenders highly trusted by other lenders. This impact is more substantial for male investors who lend to highly trustworthy women borrowers [51].
Peer-to-peer credit platforms are becoming and more practical option for small value loans than conventional forms of credit intermediation. There are strong expectations that financial inclusion would be improved and borrowers will be better off. To explore these aspirations, we add altruistic investors to the credit intermediation peer-to-peer model. We find altruistic investors not enhancing financial inclusiveness but lower borrowing rates than those with self-interested investors [52]. Some more researches related to variables used in research has been listed below in Table 1.
Table 1. List of variables used in research
|
S.NO. |
Name of Variable for Awareness Generation |
Related Studies |
|
1. |
Social Media Technology |
[47, 53, 54] |
|
2. |
Information through relatives and peer |
[48, 50-52, 55] |
|
3. |
Bank |
[56-59] |
Source: Author compilation
3.1 Objectives
To compare the impact of various awareness sources on PMJDY.
To measure the effectiveness of various communication mediums in persuading people to register for Jan Dhan Yojna.
3.2 Hypothesis
Use of technology leads to enrolment in PMJDY.
Visiting to Banks regularly leads to enrolment in PMJDY.
Discussion with relatives leads to registration for PMJDY.
Discussion with peer leads to registration for PMJDY.
3.3 Research methodology
A conceptual model was framed based on the literature review in line with research objectives. Based on the model, data collection was done by crafting a questionnaire. The direct personal investigation technique of data collection was utilised. Based on various communication mediums, people's responses were then analysed by applying binary logit regression to find the probability of getting registered under Jan Dhan Yojana.
The study comprises answers from 680 people of villages of Punjab (State in India) aged 18 years or older. The survey sample represents the rural population of Punjab. Still, it excludes residents of the territory of Punjab and those dwelling on aboriginal aids and in establishments, such as prisons and residential care facilities. Full-time members of the army were correspondingly excluded from this analysis. Since the survey was collected from rural areas, direct personal investigation is used for data collection because of the low education level of people.
The reliability of the questions was checked by collecting data from 100 respondents. Reliability statistics in SPSS gave 705 as the value of Cronbach's alpha. Cronbach's alpha is a metric for gauging a scale or test's inner consistency or reliability. Cronbach's alpha measures the degree to which a response is consistent, and the dependability of any particular measurement relates to this consistency. After reliability, the validity of the questions was checked by employing bivariate correlation. The derived values based on Pearson correlation was compared with total and was found to be significant in every question. Hence the data set passes the validity test, and questions are ready to be circulated at a large scale.
The general expression of logistic function applied in research is:
$p(x)=\sigma(t)=\frac{1}{1+e^{-\left(\beta_0+\beta_1 x\right)}}$
Later odds ratio in the following form was used to draw the conclusions:
$\mathrm{OR}=\frac{\operatorname{odds}(\mathrm{x}+1)}{\operatorname{odds}(\mathrm{x})}=\frac{\left(\frac{\mathrm{p} *(\mathrm{x}+1)}{1-\mathrm{p} *(\mathrm{x}+1)}\quad\right)}{\left(\frac{\mathrm{p}(\mathrm{x})}{1-\mathrm{p}(\mathrm{x})}\,\right)}=\frac{\mathrm{e}^{\beta_0+\beta_1(\mathrm{x}+1)}}{\mathrm{e}^{\beta_0+\beta_1 \mathrm{x}}}=\mathrm{e}^{\beta_1}$
Finally, the present research considers a logistic model “M” explanatory variables and 2 categorical values-0 and 1. The following model is employed on the assumption of linear relationship between predictor variable and the log-odds:
a. $\quad t=\log _b \frac{p}{1-p}=\beta_0+\beta_1 x_1+\beta_2 x_2+\cdots+\beta_M x_M$
b. $\quad t=\sum_{m=0}^M \beta_m x_m=\beta \cdot x$
c. $\quad p(x)=\frac{b^{\beta \cdot x}}{1+b^{\beta \cdot x}}=\frac{1}{1+b^{-\beta \cdot x}}=S_b(t)$
d. $\quad \begin{gathered}\ell=\sum_{\mathrm{k}=1}^{\mathrm{K}} \mathrm{y}_{\mathrm{k}} \log _{\mathrm{b}}\left(\mathrm{p}\left(\mathrm{x}_{\mathrm{k}}\right)\right)+\sum_{\mathrm{k}=1}^{\mathrm{K}}(1-\left.\mathrm{y}_{\mathrm{k}}\right) \log _{\mathrm{b}}\left(1-\mathrm{p}\left(\mathrm{x}_{\mathrm{k}}\right)\right)\end{gathered}$
e. $\quad \frac{\partial \ell}{\partial \beta_{\mathrm{m}}}=0=\sum_{\mathrm{k}=1}^{\mathrm{K}} \mathrm{y}_{\mathrm{k}} \mathrm{x}_{\mathrm{mk}}-\sum_{\mathrm{k}=1}^{\mathrm{K}} \mathrm{p}\left(\mathrm{x}_{\mathrm{k}}\right) \mathrm{x}_{\mathrm{mk}}$
f. $\quad \mathrm{t}=\log _{10} \frac{\mathrm{p}}{1-\mathrm{p}}=-3+\mathrm{x}_1+2 \mathrm{x}_2$
g. $\quad p=\frac{b^{\beta \cdot x}}{1+b^{\beta \cdot x}}=\frac{b^\beta{0}+\beta_1 x_1+\beta_2 x_2}{1+b_0 \beta_0+\beta_1 x_1+\beta_2 x_2}=\frac{1}{1+b^{-\left(\beta_0+\beta_1 x_1+\beta_2 \, x_2\right)}}$
3.4 Conceptual model
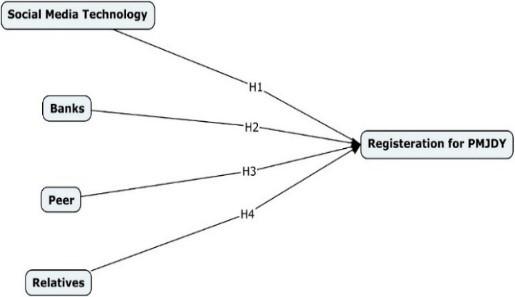
Figure 1. Conceptual model
Figure 1 contains the diagrammatic presentation of the relationship between regressor and regressand. As observed from the figure, the variable of registration for PMJDY is the representation of financial literacy. The person who is financially aware of the financial inclusion scheme of the nation only can take advantage of it by enrolling himself into it. This financial awareness can be regarding the bank account, the insurance policy or any other subsidy scheme. Being literate is the primary condition to avail benefit of the project issued. This awareness can come from various sources. Based on the literature review, one can be financially aware of the scheme introduced through banks, social media, or word of mouth from peers and relatives. This paper considers the registration for PMJDY as a representation of financial awareness, which is impacted by four exogenous variables, as shown in Figure 1. This conceptual model applies necessary tools to measure the role of the most impactful variable on endogenous variables.
Table 2 shows the response recorded in the actual dataset. Based upon this beginning block, the initial data says the prediction percentage is 60.3%, and the cut value is 0.50. So based on it, the collected dataset is correct to the tune of 60.3%. The values in the table signify in the absence of independent variables, 410 people were registered for the scheme of PMJDY because of their financial awareness. Hence in the lack of the effect of the explanatory variable, 60.3% of people, i.e., 410, can get themselves registered in PMJDY. This means when the impact of the explanatory variable is missing, 270 (39.7%) people are financially unaware, and 410 (60.3%) people will be financially aware. There are 1.519 times (Table 3) more probability of a financially educated person.
If there is no independent variable in the equation, the dependent variable is equal to constant (Beta), i.e., .418 (Table 3). Moreover, the value of exponential Beta is 1.519. This value is more than 1. Hence it can be interpreted that 51.9% more chances are there that the candidate is registered for PMJDY. Statistical data (Table 4), perhaps from a stepwise regression or similar modeling strategy, are shown in the table. The four categories are "Tech," "Bank," "Peer," and "Relative," and each has its own weighted score and degree of relevance. However, only "Tech" and "Relative" exhibit statistically significant correlations with the dependent variable, whereas "Bank" and "Peer" do not. Overall, statistical significance indicates the model's predictive strength. However, additional background information and familiarity with the study are needed for firmer conclusions. The author's calculations are cited as the basis for the table, suggesting it was created as part of a larger investigation.
As per the Omnibus Test (Table 5), the introduction of variables in the model is impacting significantly, i.e., all the variables contribute to the projection of the probability of whether a person is registered or not for Jan Dhan Yojna.
Table 2. Prediction percentage based on actual data
|
Classification Tablea,b |
|||||
|
Observed |
Predicted |
||||
|
Registered |
Percentage Correct |
||||
|
Not Registered for PMJDY |
Registered for PMJDY |
||||
|
Step 0 |
Registered |
Not Registered |
0 |
270 |
0.0 |
|
Registered |
0 |
410 |
100.0 |
||
|
Overall %age |
|
|
60.3 |
||
|
b. The cut-value is .50 |
|||||
Source: Author's calculation
Table 3. Variables in the equation
|
|
B |
S.E. |
Wald |
df |
Sig. |
Exp(B) |
|
|
Step 0 |
Constant |
.418 |
.111 |
14.204 |
1 |
.000 |
1.519 |
Source: Author's calculation
Table 4. Variables not in the equation
|
|
Score |
df |
Sig. |
||
|
Step 0 |
Variables |
Tech |
145.478 |
1 |
.000 |
|
Bank |
2.546 |
1 |
.111 |
||
|
Peer |
.137 |
1 |
.711 |
||
|
Relative |
5.401 |
1 |
.020 |
||
|
Overall Statistics |
153.740 |
4 |
.000 |
||
Source: Author's calculation
Table 5. Omnibus-tests of model-coefficients
|
|
Chi-Square |
df |
Sig. |
|
|
Step 1 |
Step |
174.789 |
4 |
.000 |
|
Block |
174.789 |
4 |
.000 |
|
|
Model |
174.789 |
4 |
.000 |
|
Source: Author's calculation
There are two r-square in Table 6: Cox & Snell R Square and Nagelkerke R Square. As per the available literature Nagelkerke R Square is a better criterion for reporting results which arrives at the value for .544 in present research. The value of 0.544 depicts the prediction rate of the given model is 54.4%. Both the R-square are indicative in nature, they are not conclusive.
Table 6. Model-summary
|
Step |
-2 Log Likelihood |
Cox & Snell R Square |
Nagelkerke R Square |
|
1 |
282.036a |
.402 |
.544 |
|
a. Estimation terminated at iteration number 5 because parameter estimates changed by less than .001. |
|||
Source: Author's calculation
Table 7. Hosmer and lemeshow test
|
Step |
Chi-Square |
df |
Sig. |
|
1 |
1.932 |
6 |
.951 |
Source: Author's calculation
A arithmetic test gaging the goodness of fit of logistic regression models is the Hosmer-Lemeshow test [60]. In risk prediction models, it is commonly utilised. The test establishes whether or not the examined event rates in different segments of the model population are consistent with the projected event rates [61].
The test is based upon chi-square values, detailed calculations of which are shown in Table 8. However, from Table 7 it can be interpreted that the p-value of relation between the observed and expected values is 0.951. Hence, we fail to reject the null hypothesis which states that there is no association between the observed and expected values of the given dataset. This signifies the framed model is a good fit to draw observations and conclusions.
Table 8 is detailed analysis of the conclusions obtained in Table 7. As seen in Table 8, a better model fit is indicated by a smaller discrepancy between the observed and projected classification. The fitted model (0.951 from Table 7) fails the Hosmer and Lemeshow test, showing that there are still negligible discrepancies between the actual and expected values. This is a potent indicator of a solid model match (i.e., well calibrated).
The first step for interpreting results in Table 9 is that the overall percentage (81.8) will be compared with the prediction based overall percentage in Table 2 (60.3). The value of percentage in Table 9 is more than Table 2 indicating the strong model for prediction. Considering the value 180, if the value of not registered for PMJDY is predicted, then it is poor model as the correction percentage is only 66.7%.
Table 8. Contingency table for hosmer and lemeshow test
|
|
Not Registered for PMJDY |
Registered for PMJDY |
Total |
|||
|
Observed |
Expected |
Observed |
Expected |
|||
|
Step 1 |
1 |
86 |
77.374 |
0 |
0.376 |
77.75 |
|
2 |
84 |
72.682 |
0 |
1.068 |
73.75 |
|
|
3 |
24 |
45.81 |
62 |
63.94 |
109.75 |
|
|
4 |
8 |
9.716 |
34 |
32.034 |
41.75 |
|
|
5 |
32 |
27.082 |
96 |
98.668 |
125.75 |
|
|
6 |
16 |
12.016 |
70 |
71.734 |
83.75 |
|
|
7 |
14 |
10.702 |
70 |
73.048 |
83.75 |
|
|
8 |
6 |
2.614 |
78 |
81.136 |
83.75 |
|
Source: Author's calculation
Table 9. Classification tablea
|
Observed |
Predicted |
||||
|
Registered |
Percentage Correct |
||||
|
Not Registered for PMJDY |
Registered for PMJDY |
||||
|
Step 1 |
Registered |
Not Registered for PMJDY |
180 |
90 |
66.7 |
|
Registered for PMJDY |
34 |
376 |
91.7 |
||
|
Overall Percentage |
|
|
81.8 |
||
|
a. The cut-value is .50 |
|||||
Source: Author's calculation
Table 10. Variables in the equation
|
|
B |
S.E. |
Wald |
df |
Sig. |
Exp(B) |
95% C.I.for EXP(B) |
||
|
Lower |
Upper |
||||||||
|
Step 1a |
Tech |
1.642 |
.182 |
81.216 |
1 |
.000*** |
5.164 |
3.613 |
7.380 |
|
Bank |
.042 |
.179 |
.054 |
1 |
.816 |
1.042 |
.735 |
1.479 |
|
|
Peer |
-.334 |
.265 |
1.588 |
1 |
.208 |
.716 |
.426 |
1.204 |
|
|
Relative |
-.878 |
.397 |
4.894 |
1 |
.027** |
.416 |
.191 |
.905 |
|
|
Constant |
-.672 |
1.460 |
.212 |
1 |
.645 |
.511 |
|
|
|
|
a. Variable(s): Tech, Bank, Peer, Relative. |
|||||||||
Source: Author's calculation
The variables used in the equation are listed in Table 10, suggesting that it is based on a logistic regression or related statistical model. The table lists the degrees of freedom (df), significance levels (Sig.), odds ratios (Exp(B)), and coefficients (B) for each independent variable. With a coefficient of 1.642 and a p-value of.000, it is clear that the "Tech" variable is positively associated with the outcome variable. In this case, the odds ratio of 5.164 indicates that the probabilities of the event increase by a factor of about 5.164 for each unit increase in "Tech," with a 95% confidence range of 3.613 to 7.380. However, the higher p-values for the "Bank," "Peer," and "Relative" variables show that they are not significantly related to the result. Since the author claims to have calculated the data in the table, it is safe to assume that it is included in some kind of academic investigation.
In nutshell it can be interpreted that, Table 2 demonstrates the response taped in the real dataset. Cantered upon this beginning block, the original data says the forecast percentage is 60.3%, and the cut value is 0.50. So based on it can be said accumulated dataset is correct to the tune of 60.3%. If there is no exogenous variable in the equation, the endogenous variable is equal to Beta, i.e., .418 (Table 3). According to exponential Beta in Table 3, 1.59 times odds are there that based upon the current data, a person is enrolled for Jan Dhan Yojna. As per the Omnibus Test (Table5), the introduction of variables in the model is impacting significantly, i.e., all the variables contribute to the prediction of the probability of whether a person is registered or not for Jan Dhan Yojna. Also, according to Table 6 the value of Nagelkerke R Square .544. Hence model can be used for prediction. Comparing Table 9 and Table 2, the overall percentage in Table 9 is more than the overall percentage in Table 2. This shows the model is a good fit for making predictions.
If use of technology increases, then probability of getting registered for Jan Dhan Yojna will increase. According to odds ratio of Tech there is 5.16 times better probability of getting registered in PMJDY, if a person in tech-optimists. As per the odds ratio of Bank 81.6% more chances that if a person visiting the bank, he will be persuaded for getting registered for PMJDY. There is 28.42% probability that one might be avoiding getting registered for PMJDY if the person is taking advices from its peer. There is 58.42% probability that one might be avoiding getting registered for PMJDY if the person is taking advice from its relatives. Statistically, only social media technology and relatives of a person are significantly influencing the decision making of a person to get registered under the scheme.
Hence, it can be concluded that tech-optimists are more likely to be financially aware of the benefits of PMJDY and other government schemes. Therefore, the interpretation of mobile technology spreading its roots into the weaker section of Indian society can be made.
These results obtained from the calculations take our attention to promoting technology's use for the nation's inclusive development. The nation's foremost goals since India's independence have been economic development, educational opportunities for everyone, and financial inclusion for the majority of the people. Despite India's progress in the previous decades, the topic of financial inclusion has seen a slowdown. Technology may be a valuable tool for delivering financial literacy since it can provide individuals with the skills, knowledge, or information they need to utilise various media, including computers, cell phones, and the Internet. In addition, we must make sure that individuals can critically examine the information they have acquired through digital means, and they must also have the capability to implement what they have learned to their best potential. While it may seem hard to believe, it is not so far-fetched to imagine that financially struggling people might profit from new technologies. Technology is a significant facilitator for the impoverished. There is evidence that technology may go a long way in bridging the gap between far-flung villages throughout the nation by providing banking correspondent services to serve customers in various remote locations.
In conclusion, it can be said that social media technology act as a springboard for promoting financial education. Social media user has shown a significant rise in recent year, and it is acting as a catalyst for promotion. Anything can be promoted and made popular with the power of social media, whether it is business, the lifestyle of the individual, present needs or even government policies. Considering the power of social media, the government must equip itself with its use. It must be used to the extent possible to educate the nation's people financially when the level of financial education increases, only the goal of inclusive growth can be achieved. To increase the level of financial education, the government shall employ social media platforms in their awareness generation programmes.
[1] Chen, X.F., Yang, J.Z. (2021). Analysis on farmers' entrepreneurship decision-making based on digital technologies. In 2021 2nd International Conference on E-Commerce and Internet Technology (ECIT), IEEE, pp. 360-363. https://doi.org/10.1109/ECIT52743.2021.00082
[2] Banerjee, S., Ghosh, S. (2021). Financial inclusion in India: A giant structure on weak foundation. Academy of Accounting and Financial Studies Journal, 25(2): 1-6.
[3] Taneja, S., Özen, E. (2023). To analyse the relationship between bank's green financing and environmental performance. International Journal of Electronic Finance, 12(2): 163-175. https://doi.org/10.1504/IJEF.2023.129919
[4] Donthu, N., Gustafsson, A. (2020). Effects of COVID-19 on business and research. Journal of Business Research, 117: 284-289. https://doi.org/10.1016/j.jbusres.2020.06.008
[5] Kemp, S. (2021). Half a billion users joined social in the last year. Social Media Marketing & Management Dashboard. https://blog.hootsuite.com/simon-kemp-social-media, accessed on Jul. 30, 2021.
[6] Huesemann, M., Huesemann, J. (2011). Techno-Fix: Why Technology Won't Save Us or The Environment. New Society Publishers.
[7] Gordon, R.J. (2014). The turtle’s progress: Secular stagnation meets the headwinds. InSecular Stagnation: Facts, Causes and Cures, London: CEPR Press, 2014: 47-60.
[8] Grimm, R., Fox, C., Baines, S., Albertson, K. (2013). Social innovation, an answer to contemporary societal challenges? Locating the concept in theory and practice. Innovation: The European Journal of Social Science Research, 26(4): 436-455. https://doi.org/10.1080/13511610.2013.848163
[9] The world bank in India. The World Bank. https://www.worldbank.org/en/country/india/overview, accessed on July 30, 2021.
[10] Allen, F., Demirguc-Kunt, A., Klapper, L., Peria, M.S.M. (2016). The foundations of financial inclusion: Understanding ownership and use of formal accounts. Journal of Financial Intermediation, 27: 1-30. https://doi.org/10.1016/j.jfi.2015.12.003
[11] Reserve Bank of India. India’s Central Bank. https://www.rbi.org.in/Scripts/FAQView.aspx?Id=77, accessed on July 30, 2021.
[12] Cingano, F. (2014). Trends in income inequality and its impact on economic growth. Trends Income Inequal. Its Impact Economic Growth, 163. https://doi.org/10.1787/5jxrjncwxv6j-en
[13] Sun, T. (2018). Financial Inclusion-an overview|ScienceDirect Topics. Handbook of Blockchain, Digital Finance, and Inclusion, 2. https://www.sciencedirect.com/topics/economics-econometrics-and-finance/financial-inclusion, accessed on July 30, 2021.
[14] World Bank Group and the 2030 Agenda. The World Bank, 2015. https://www.worldbank.org/en/programs/sdgs-2030-agenda, accessed on July 30, 2021.
[15] Reserve Bank of India. (2015). Reserve Bank of India Annual Report 2014-15. 53(2). https://www.rbi.org.in/Scripts/AnnualReportPublications.aspx?year=2015
[16] RBI-Precautions for PMJDY. (2016). https://rbidocs.rbi.org.in/rdocs/notification/PDFs/PMJDYD4050B70404343FA9B8711348487E2C2.PDF, accessed on July 30, 2021.
[17] Press information bureau, government of India. PIB, 2014. https://pib.gov.in/newsite/erelease.aspx?relid=109113, accessed on July 30, 2021.
[18] Pradhan Mantri Jan Dhan Yojana (PMJDY). Department of Financial Services, 2014. https://www.pmjdy.gov.in/about, accessed on Dec. 27, 2021.
[19] Schäfer, D. (2016). A banking union of ideas? The impact of ordoliberalism and the vicious circle on the EU banking union. JCMS: Journal of Common Market Studies, 54(4): 961-980.https://doi.org/10.1111/jcms.12351
[20] Lyons, A.C., Grable, J., Zeng, T. (2019). Impacts of financial literacy on the loan decisions of financially excluded households in the people's republic of China. SSRN Electronic Journal. https://doi.org/10.2139/SSRN.3370021
[21] Willis, L.E. (2008). Against financial-literacy education. Iowa Law Rev., 94: 197.
[22] Qazi, M.F.A., Iqbal, J. (2020). A conceptual framework of pradhan mantri jan dhan.
[23] Paramasivan, C., Arunkumar, G. (2018). Direct benefit transfer-an innovative approach to financial inclusion in India.
[24] Pearce, D. (2011). Financial inclusion in the middle east and north Africa: Analysis and roadmap recommendations. Policy Research Working Papers. https://doi.org/10.1596/1813-9450-5610
[25] Zaenal, M.H., Astuti, A.D., Sadariyah, A.S. (2019). Bringing the zakat distribution from the principles to financial inclusion on mission mode. Working Papers-Puskas Baznas, 1.
[26] Atkinson, A., Messy, F.A. (2014). OECD/INFE evidence, policies and practice 2013.
[27] Kaplan, A.M., Haenlein, M. (2010). Users of the world, unite! The challenges and opportunities of social media. Business Horizons, 53(1): 59-68. https://doi.org/10.1016/j.bushor.2009.09.003
[28] Woermann, N. (2012). On the slope is on the screen: Prosumption, social media practices, and scopic systems in the freeskiing subculture. American Behavioral Scientist, 56(4): 618-640. https://doi.org/10.1177/0002764211429363
[29] Steckman, L.M., Andrews, M.J. (2017). Online around the world: A geographic encyclopedia of the internet, social media, and mobile apps. ABC-CLIO.
[30] Patiño, O.A., Gutiérrez, L.M.P. (2019). Financial education and inclusion: The role of banks. International Journal of Sustainable Entrepreneurship and Corporate Social Responsibility (IJSECSR), 4(1): 57-72. https://doi.org/10.4018/ijsecsr.2019010104
[31] Lusardi, A., Mitchell, O.S. (2011). Financial literacy around the world: An overview. Journal of Pension Economics & Finance, 10(4): 497-508. https://doi.org/10.1017/S1474747211000448
[32] Kiliç, M., Kuzey, C., Uyar, A. (2015). The impact of ownership and board structure on corporate social responsibility (CSR) reporting in the turkish banking industry. Corporate Governance, 15(3): 357-374. https://doi.org/10.1108/CG-02-2014-0022
[33] Cowling, A., Newman, K. (1995). Banking on people: TQM, service quality and human resources. Personnel Review, 24(7): 25-40. https://doi.org/10.1108/00483489510095789
[34] Louzis, D.P., Vouldis, A.T., Metaxas, V.L. (2012). Macroeconomic and bank-specific determinants of non-performing loans in Greece: A comparative study of mortgage, business and consumer loan portfolios. Journal of Banking & Finance, 36(4): 1012-1027. https://doi.org/10.1016/j.jbankfin.2011.10.012
[35] OECD/UNICEF. (2021). Education in Eastern Europe and Central Asia: Findings from PISA, PISA, OECD Publishing, Paris. https://doi.org/10.1787/ebeeb179-en
[36] Fernandes, D., Lynch Jr, J.G., Netemeyer, R.G. (2014). Financial literacy, financial education, and downstream financial behaviors. Management Science, 60(8): 1861-1883. https://doi.org/10.1287/mnsc.2013.1849
[37] Borsari, B., Carey, K.B. (2001). Peer influences on college drinking: A review of the research. Journal of Substance Abuse, 13(4): 391-424. https://doi.org/10.1016/s0899-3289(01)00098-0
[38] Aduda, J., Kalunda, E. (2012). Financial inclusion and financial sector stability with reference to kenya: A review of literature. Journal of Applied Finance and Banking, 2(6): 95-120.
[39] Kefela, G.T. (2010). Promoting access to finance by empowering consumers-financial literacy in developing countries. Educational Research and Reviews, 5(5): 205-212. https://doi.org/10.5897/ERR.9000268
[40] Mushtaq, R., Bruneau, C. (2019). Microfinance, financial inclusion and ICT: Implications for poverty and inequality. Technology in Society, 59: 101154. https://doi.org/10.1016/j.techsoc.2019.101154
[41] Sanderson, A., Mutandwa, L., Le Roux, P. (2018). A review of determinants of financial inclusion. International Journal of Economics and Financial Issues, 8(3): 1-8.
[42] Dasgupta, M., Gupta, R.K. (2009). Innovation in organizations: A review of the role of organizational learning and knowledge management. Global Business Review, 10(2): 203-224. https://doi.org/10.1177/097215090901000205
[43] Barathi Kamath, G. (2007). The intellectual capital performance of the Indian banking sector. Journal of Intellectual Capital, 8(1): 96-123. https://doi.org/10.1108/14691930710715088
[44] Taneja, S., Ozen, E. (2023). Impact of the European Green Deal (EDG) on the agricultural carbon (CO2) emission in Turkey. International Journal of Sustainable Development and Planning, 18(3): 715-727. https://doi.org/10.18280/ijsdp.180307
[45] Singh, J.P. (2019). Development finance 2.0: Do participation and information technologies matter? Review of International Political Economy, 26(5): 886-910. https://doi.org/10.1080/09692290.2019.1616600
[46] Taneja, S. Kaur, S. Özen, E., (2022). Using green finance to promote global growth in a sustainable way. International Journal of Green Economics, 16(3), 246-257. https://doi.org/10.1504/ijge.2022.10052887
[47] Munongo, S., Makina, D., Tsaurai, K. (2019). Social media and mobile money: Evidence of usage in south Africa and Zimbabwe. InECSM 2019 6th European Conference on Social Media, Academic Conferences and Publishing Limited, 215.
[48] Maskara, P.K., Kuvvet, E., Chen, G.X. (2021). The role of P2P platforms in enhancing financial inclusion in the United States: An analysis of peer-to-peer lending across the rural-urban divide. Financial Management, 50(3): 747-774.https://doi.org/10.1111/fima.12341
[49] Singh, V.K., Prasad, R. (2021). Diffusion of banking products in financial inclusion linked savings accounts: A case study based on pradhan mantri jan dhan yojana in India. Global Business Review, 09721509211006866. https://doi.org/10.1177/09721509211006866
[50] Cameron, A., Oak, M., Shan, Y.P. (2021). Peer monitoring and Islamic microfinance. Journal of Economic Behavior & Organization, 184: 337-358. https://doi.org/10.1016/j.jebo.2021.02.001
[51] Gonzalez, L. (2020). Blockchain, herding and trust in peer-to-peer lending. Managerial Finance, 46(6): 815-831. https://doi.org/10.1108/MF-09-2018-0423
[52] Berentsen, A., Markheim, M. (2021). Peer‐to‐peer lending and financial inclusion with altruistic investors. International Review of Finance, 21(4): 1407-1418. https://doi.org/10.1111/irfi.12333
[53] Munongo, S., Makina, D., Tsaurai, K. (2020). The impact of social media on mobile money adoption: South African evidence. In 7th European Conference on Social Media ECSM, pp. 180-186.
[54] Bawre, S., Kar, S. (2019). Social media and financial institutions in the Indian context. International Journal of Economics and Business Research, 18(3): 343-355. https://doi.org/10.1504/IJEBR.2019.102734
[55] Patwardhan, A. (2018). Peer-to-peer lending. In Handbook of Blockchain, Digital Finance, and Inclusion, Academic Press, 1: 389-418. https://doi.org/10.1016/B978-0-12-810441-5.00018-X
[56] Kumari, D.A.T., Ferdous, Azam, S.M., Khalidah, S. (2020). Financial literacy: As a tool for enhancing financial inclusion among rural population in Sri Lanka. International Journal of Scientific & Technology Research, 9(4): 2595-2605.
[57] Judit, S., László, V., Csaba, L. (2020). Innovative solutions in the development of households’ financial awareness: A hungarian example. Economics and Sociology, 13(3): 27-45. https://doi.org/10.14254/2071-789X.2020/13-3/2
[58] Reams-Johnson, A., Delker, S. (2016). The development of the financial literacy program at the community college of Baltimore County. Community College Journal of Research and Practice, 40(7): 571-579. https://doi.org/10.1080/10668926.2015.1125817
[59] Taujanskaite, K., Milcius, E., Saltenis, S. (2016). Control of non-performing loans in retail banking by raising financial and consumer awareness of clients. Inzinerine Ekonomika, 27(4): 405-416. https://doi.org/10.5755/j01.ee.27.4.14420
[60] Kramer, A.A., Zimmerman, J.E. (2007). Assessing the calibration of mortality benchmarks in critical care: The hosmer-lemeshow test revisited. Critical Care Medicine, 35(9): 2052-2056. https://doi.org/10.1097/01.CCM.0000275267.64078.B0
[61] Archer, K.J., Lemeshow, S. (2006). Goodness-of-fit test for a logistic regression model fitted using survey sample data. The Stata Journal, 6(1): 97-105. https://doi.org/10.1177/1536867X0600600106