Rania Rushdy Moussa
© 2022 IIETA. This article is published by IIETA and is licensed under the CC BY 4.0 license (http://creativecommons.org/licenses/by/4.0/).
OPEN ACCESS
Some cities in the Global South are challenging the adverse effects of accumulating waste, which pollutes the environment and affects public health. This research presents a solution to get rid of organic waste and reuse it to generate energy. The research methods included a two-stream approach of data collection in: a qualitative method of collecting data using a field survey in Egypt and a quantitative way of measuring the amount of energy generated from using anaerobic digesters. The results revealed that anaerobic digester tanks produced 396 more than the gas consumed by the community and covered 3.6% of the electricity needed. The findings compared the energy generated from storing organic waste in anaerobic digester tanks with the power consumed by citizens. The results indicated that Egypt has challenges managing organic waste and needs innovative policies to confront draining a large portion of the local economy and causing environmental hazards.
anaerobic digesters (AD), Egyptian district, electricity and gas production, organic wastes (OW), sustainable neighbourhood
One of the global environmental problems facing humanity is ozone depletion, climate change, and the product of greenhouse gases in the atmosphere at high concentrations. In the atmosphere, the most important and harmful greenhouse gases are mainly those of anthropogenic origin, especially CO2, which is produced from burning wastes and fossil fuels [1, 2].
WM techniques vary between developed and developing countries. Moreover, the techniques used to manage the waste produced by metropolitan, rural, industrial, and inhabited regions are also different. Each sector has its own techniques for managing its waste [3]. For example, the local government is responsible for setting a strategy for managing the waste produced by urban and rural regions [4].
In Egypt in 1968, the Ministry of Housing Decree "134" declared the methods of waste treatment such as dumping, burning, incineration, and composting. In 1983, the Presidential Decree "284" established Giza and Cairo Cleansing Authorities and Beautification. The mandates of these authorities include garbage collection and dumping of waste in special areas such as "Hay El-zabalen".
According to Guirguis and Moussa [5], Waste accumulation has become one of the Egyptian citizens' daily problems. The increasing rate of garbage and its encirclement of places in human gatherings such as hospitals and schools have become a threat to serious environmental disasters. Moreover, it provides a good environment for increasing epidemics, which affect the health of citizens negatively as the Egyptian government has failed to solve this problem. In addition, there is a poor environmental awareness among Egyptian citizens [6]. Waste disposal is a major problem that worries scientists and Egyptian decision makers, who seek to deal with the environmental risks and reduce the public health risks that threaten the future of the new generation.
Today, one of the biggest problems that faces Egyptians and pollutes Egypt's atmosphere, as well as the respiratory system, is the burning of wheat and rice straw, which causes the "black cloud" [7]. Almost 64% of Egyptians have respiratory system illnesses due to the lack of a WM strategy. Each year, the Egyptians suffer from the "black cloud" which is produced after the harvest season of the rice crops. The "black cloud" affects Egyptians’ public health in several ways, such as: asthma, failure of the respiratory system requiring resorting to artificial respiration, & increasing number of cases of chest allergies [8-10].
The significance of this research is that it shows the effect of using anaerobic digesters in Egyptian neighbourhoods as a sustainable tool for reusing organic waste in producing clean energy in the form of electricity and gas, which can be used to satisfy the needs of the Egyptian neighborhood. Moreover, it will help the Egyptian neighbourhood to get rid of their organic waste using sustainable technology & achieves the goal of Egypt’s Vision of 2030 addresses reduction of environmental pollution in accordance to the 9th pillar of the vision. The 9th pillar of Egypt’s 2030 Vision is focusing on the environment, and its main objective is to ensure the privileges of the next generation in the utilisation of natural resources and development.
Very few researchers have tackled this problem in the past century, such as El-Qady [11], and almost no research has been published in the last 10 years addressing the advantages of storing organic waste in anaerobic digesters tanks in Egyptian neighbourhoods. Anaerobic digesters have never been used before in Egypt due to the lack of a waste management strategy and high land costs. This study proposes a solution to the issues that prevent the use of anaerobic digesters in Egyptian neighborhoods, such as high land costs and a lack of infrastructural support.
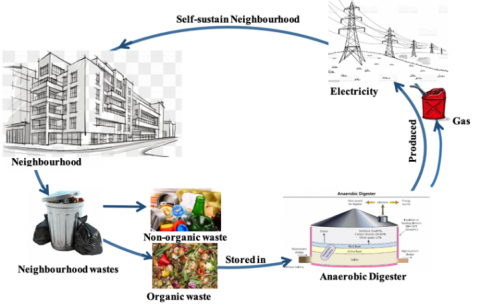
Figure 1. Graphical abstract
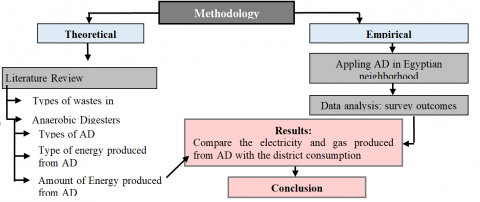
The presented research focuses on creating sustainable neighbourhoods using AD tanks in Egyptian neighbourhoods. The research will study the impact of storing the OW of Egyptian neighbourhoods in AD tanks and measure the outputs toward electricity generation and the reduction of environmental and social pollutants as shown in Figure 2.
Figure 2. Research methodology
The hypothesis of this research is that storing the neighborhood's organic waste in anaerobic digesters will produce gas and electricity, which will affect the economic state of the neighbourhoods and create a self-sustaining neighborhood, as shown in Figure 1. In addition, a reduction in pollution will occur because of getting rid of organic waste, which will affect the residential quality of living. In addition, it will affect the social and economic aspects of the neighbourhoods. As shown in the Figure 1, collecting organic waste in anaerobic digester tanks has a positive impact on the economic, social, and environmental aspects of a neighborhood, thereby assisting in the creation of sustainable neighborhoods.
The literature review section in this manuscript is divided into two sections. The first section describes the waste problem in Egypt and the amount of waste produced in Egypt. The second section describes a proposed system that is used in developed countries to get rid of organic waste, which will serve the main goal of the research and it will be tested in the study area to measure the efficiency in Egypt.
2.1 Amount of waste in Egypt
Egypt is located in northeastern Africa, with a total area of 1 million km2 approximately, distributed among 27 governorates [12]. The population of Egypt reached 101 million in 2021, and the number of the Egyptians’ middle-income was almost half the population, reaching 48% [13].
Egypt's average gross domestic product (GDP) per capita is 2413 USD [12], with 26.3 percent of the population living below the international poverty line [14].
Waste data is not available in many developing countries, and if available, it is inconsistent. Furthermore, the majority of the data is based on theoretical estimates rather than real measurements. In Egypt, up-to-date, reliable data on waste characteristics and properties, as well as their linkage with other local parameters, are lacking. The lack of waste data has a significant impact on waste management decision-makers and the economy [14].
The term "municipal solid waste" (MSW) commonly refers to garbage, trash, or refuse waste generated from several activities. As shown in Table 1, an average of 120 million tonnes of MSW is generated annually by developing countries.
Table 1. Municipal solid waste amount in the MENA region [15]
Table 1 reveals that the average values of waste generation per capita in developing countries are relatively low when compared to the countries in the Organization for Economic Cooperation and Development (OECD). The capitals of developing countries generate waste of 0.5 to 1.1 kg per capita per day, while the average value in the OECD is 2.2 kg per capita per day [15].
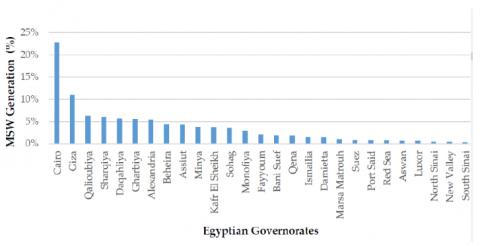
Annually, Egypt produces around 26 million tonnes of MSW. The amount of MSW produced varies greatly between cities and rural areas. In Egypt, approximately 45% of MSW is produced in the region of Greater Cairo, which consists of the three biggest governorates in Egypt; Cairo, Giza, and Qalioubiya. Alexandria is the 4th biggest governorat, with a total population of 30.7 million, and generates 32,570 tonnes of waste daily. These regions are followed by the Delta region, which consists of 7 governorates; Beheira, Kafr El-Sheikh, Gharbia, Monufia, Sharqia, Dakahlia, and Damietta, with a total population of 36.4 million, and generates 30% of the total MSW as shown in Figure 3 [15].
Figure 3. MSW generation distribution in Egypt
Figure 4. Average annual composition of MSW in Egypt [15]
As indicated in Figure 4, the MSW composition in Egypt is 56% organics, 15% miscellaneous material, 13% plastics, 10% cardboard and paper, 4%glass, and 2% metals [15]. However, MSW composition varies widely between the 27 governorates, were organic wastes ranging from 41-70 percent, plastic from 6-16 percent, glass from 1.5- 9.4 percent, and metals from 1-8 percent [15].
According to the Egyptian Ministry of Environment's concerning 2016 waste management practices in Egypt, MSW management was based on dumping (81%), recycling (12%), and only 7% was landfilled [14].
2.2 Types of wastes in Egypt
Worldwide, almost 38 billion metric tonnes of OW are produced every year [16, 17]. The dramatic increase in OW is due to the human consumption rate, the population explosion, and human behaviour. In Egypt, almost 60 million tonnes of SW are generated annually. According to Elfeki and Tkadlec [18], the Egyptian recycled OW does not exceed 20%. The un-recycled OW will have a serious negative effect on the residents’ public health and the environment, so there is an urgent need to manage the rest of the OW [18, 19]. The improper disposal ways of SW in drains, waterways, and opened dump sites has led to the contamination of water supplies and atmosphere which hinders Egypt’s heritage, natural resources, and the health & welfare of its residents.
The OW holds the highest percentage of waste production in Egypt. which is counted almost 56% according to other wastes such as glass 4%, paper 10% and plastics 13%. Although the Egyptian government commenced several initiatives to develop a strategy for the WM sector in the year 2000, their efforts showed little improvement. The percentage of recycled and reused waste does not exceed 2.5%, while almost 83.5% of waste is dumped [18].
2.3 Anaerobic digesters
AD has numerous influences on climatic change extenuation. AD replaces the fossil fuel needed to produce heat energy or electricity [1, 20-24].
In many countries, especially in third world countries such as Egypt and China, more than 2000 tonnes of food waste are generated daily [25]. AD is a technology for getting rid of food waste and generating energy [26, 27].
Table 2. Energy produced from biogas Tanks [28, 29]
|
Energy generated from biogas and biomethane |
|||||
|
1 m³ biogas |
5.0-7.5 kWh energy content |
||||
|
1 m³ biogas |
50-75% methane content |
||||
|
1 m³ biogas |
Approximate 0.6 l heating oil equivalent |
||||
|
1 m³ methane |
9.97 kWh energy content |
||||
|
1 m³ methane |
Heating value 36 MJ/ m³ Or 50 MJ/kg |
||||
|
1 m³ methane |
1 l heating oil equivalent |
||||
|
Electricity production from different types of crops in one hectare |
|||||
|
Energy crop |
Harvest yield (t FM) |
Methane yield (Nm3) |
Electricity yield (kWh) |
Number of households supplies |
|
|
Silage maize |
50 |
4,945 |
18,731 |
5.2 |
|
|
Sugar beets |
65 |
4,163 |
15,769 |
4.4 |
|
|
Whole crop cereal silage (WCCS) |
40 |
3,846 |
14,568 |
4.0 |
|
|
Cup plant |
55 |
3,509 |
13,291 |
3.7 |
|
|
Grassland |
29 |
2,521 |
9,549 |
2.7 |
|
Using AD is an effective practical system for OW management. It decreases the volume of waste and produces a variety of energy sources as attributed to high solid destruction efficiency (up to 90%) with high methane yields [30, 31]. However, the characteristics of food waste include high volatile solids to total solids ratios [32-34].
A large amount of water is needed to regulate the volatile solids of feedstock, which decreases the treatment capacity of the digester and increases operating costs [35].
Biogas produced from digesters is a non-toxic and colourless and has the scent of natural gas and flame velocity at ignition-35 cm/sec which is slower than natural gas-this makes it a safer alternative, and the resulting thermal energy ranges from 5000 to 6000 kcal per cubic metre [28, 36, 37].
According to Bundestag [29], 1m3 of biogas generates 5–7.5 kWh, as shown in Table 2. Table 2, presents the different types of crops that produce different amounts of electricity, such as: silage maize produces an average of 18731 kWh, while grassland produces 9549kWh [28].
This research uses an empirical method to investigate the impact of AD on the Egyptian neighbourhood. Surveys have been undertaken in this research targeting the residents and cleaners in the study area for the data collection phase. The data collected in this research was to estimate the quantities of OW produced by District 4 located in the 5th settlement neighbourhood in which it will be stored in AD to generate heat, electricity, and fertilizer.
Moreover, the research used a quantitative method to measure the amount of electricity and gas produced from storing OW in AD. Finally, the research used comparative analysis to compare the amount of energy produced from AD with the energy consumed by the district.
3.1 Study area
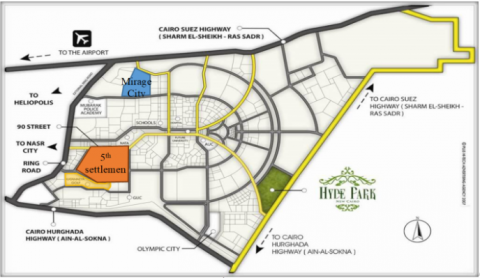
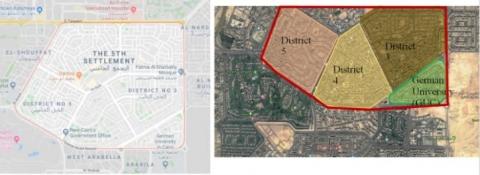
New Cairo city has been chosen to be the study area of this research as it is one of the neighbourhoods that have gas and electricity issues in Egypt. New Cairo is a new city with an average area of more than 30000 hectares (70000 acres). It is located on the eastern side of Cairo, and is surrounded by important highways and high-density roads. From the eastern side, it is surrounded by the ring road, while from the north and western sides, it is surrounded by the Cairo-Suez desert road. It is located between the Cairo-Suez desert road and the Katameya-Ain Sokhna road, as shown in Figure 5 [38].
Figure 5. Location of the 5th Settlement, New Cairo city, Egypt
New Cairo city was built around Cairo to alleviate the congestion in downtown Cairo. It can be easily accessed from the ring road and the El-Moshir Tantawy Axis, as well as the Cairo-Suez and Cairo-Hurghada highways. It was established in the year 2000 by presidential decree number 191. It consists of several residential complexes such as the fifth settlement, Al-Rehab, the first settlement, the third settlement, Hyde Park, Mirage City, Katameya Golf and other urban settlements as shown in Figure 5.
The study area of this research is district 4 located inside the 5th settlement neighbourhood, one of the biggest neighbourhoods in New Cairo City as shown in Figure 6. District 4 is a middle class residential area, surrounded by district 5 and district 3 as shown in Figure 4. The government offices of New Cairo are located in district 4, which gives this district a special concentration. The average area of district 4 is 96,393m2.
Figure 6. The urban zooning of 5th Settlement, New Cairo city
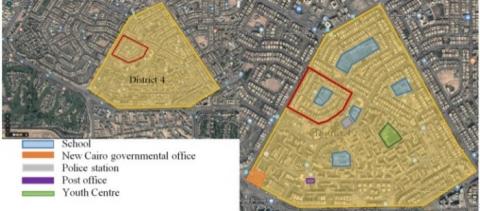
District 4 is considered a residential area, but it includes some services. There are different types of buildings located in district 4. District 4 contains residential buildings, educational buildings, religious buildings, police stations, fire stations, post offices, New Cairo governmental offices, and a youth centre as shown in Figure 7.
Figure 7. The monumental buildings in district 4
Most of the buildings in the study area are residential buildings, but it includes one school called "Al-Farabi" school, as shown in Figures 5 and 6. Moreover, District 4 contains educational buildings such as "Seiza Nabarawy Girl’s School", religious buildings such as "Quds Mosque" and some public service buildings such as "Al-Tagamo Police Station & Fire Station" as shown in Figure 8.
Figure 8. The accessibility and buildings type of district 4
3.2 Data collection
This research used two types of methods. Each method requires different data to be collected. The data collection phase is divided into two sections. Section one presents the amount and weight of garbage bags, in addition to the percentage of organic waste located inside the garbage bags, as an indicator for middle class residents, since they are approximately using the same size and weight of garbage bags.
Section two presents the energy consumption of middleclass residential apartments, which will help in estimating the electricity and gas consumption of the residential sector in the Egyptian district.
3.2.1 Section one
In this section, part of the data collected was from site questionnaires. The site questionnaires were made to estimate the percentages of OW produced from Egyptian districts. In addition to that, the research measures the environmental and social effect of using AD in Egyptian districts.
Two types of questionnaires were designed in this research. The first questionnaire targeted the district's garbage collectors and street cleaners. The first questionnaire aimed to identify the nature of the waste gathered from the district and calculate the percentages of organic materials in the district's garbage.
The second questionnaire targeted the district residents, in which it aims to validate the data collected from the first questionnaire as well as measure the negative impact of garbage accumulation on Egyptian residents.
Two kinds of participants participated in this research. The research first targeted the street cleaners & garbage collectors working in district 4. In addition to that, the research targeted the residents of district 4.
A total of 255 people participated in this research; they were surveyed during March 2020. The research interviewed 20 participants from district 4 cleaners and garbage collectors.
275 participants were randomly selected amongst the district residents, but only 235 participants completed the survey and answered all the questions. The distribution of the participants’ social and demographic characteristics is shown in Table 3.
Table 3. The characters of participants
|
GENDER |
AGE |
||
|
Type |
Percentage |
Range |
Percentage |
|
Male |
36% |
Below 20 |
5% |
|
20-29 |
20% |
||
|
Female |
64% |
30-39 |
20% |
|
40-49 |
35% |
||
|
Above 50 |
20% |
||
According to the Egyptian culture, the house wife’s are the family member that take care of the house and thronging the garbage bags, that’s why the research targeted the house wife’s which explain the reason for the gender gap shown in Table 2.
3.2.2 Section two
The study area is considered a middle class residential area, knowing that most Egyptian middle class families consist of four to five persons. During the second interview, the residents were asked about their monthly electricity and gas consumption, in which the research estimated the percentage of electricity and gas consumed by the resident sector in district 4. The average electricity and gas consumption of a single residential house is presented in Table 4.
Table 4. An example for the electricity and gas bills of single residential house in district 4
|
Bills Date |
Electricity Consumption |
Gas Consumption |
|||||
|
Consumption in kWh |
Number of days |
Price / EGP |
Date |
Number of days |
Amount of BTU consumed |
Price / EGP |
|
|
7/2020 |
401 |
30 |
238 |
5/2020 |
30 |
8 |
20 |
|
8/2020 |
541 |
31 |
429 |
9/2020 |
31 |
18 |
50 |
|
10/2020 |
388 |
30 |
276 |
10/2020 |
30 |
12 |
35 |
|
Average Consumption |
443.3 kWh |
30 |
|
|
30 |
12.7 Btu |
|
In this section, the research presents the results using qualitative and quantitative analysis. The result section is divided into two sections; section one uses qualitative analysis while section two presents quantitative and comparative analysis by comparing the energy produced from installing the AD system in the Egyptian district and comparing it with the energy consumed by the district.
4.1 Section one
This section calculates the amount of OW produced by district 4 and calculates the amount of gas and electricity generated from storing the OW produced in AD. Moreover, the research will use comparative analysis to compare the amount of gas and electricity generated from storing OW in AD with the amount of gas and electricity consumed by the district 4 residential sector to identify the percentage of self-satisfaction that the AD system will provide.
According to the research questionnaire, which proved that a single residential apartment gets rid of an average of 4-6 trash bags every week. While the school gets rid of approximately 15-20 trash bags/week as shown in Table 5.
Table 5. Amount of wastes produced from different buildings of the neighborhood/week
|
Type of building |
No. of trash bags |
||||
|
1-6 |
6-10 |
10-15 |
15-20 |
< 20 |
|
|
Schools |
|
|
|
✔ |
|
|
Residential apartment |
✔ |
|
|
|
|
The survey revealed that the residential trash bags contain more than 60% OW [5], unlike the schools, which contain more SW than OW. The weight of one residential trash bag ranges between 1.5kg to 3.5kg, while the school trash bags ranged from 3-5kg. The second survey that was targeting the cleaners shows that the waste produced in the neighbourhood is being thrown in a dump area called "the Katameya waste dump", where OW is being burnt, which pollutes almost 15% of the air in the Katameya neighbourhood. According to the field survey, the study area has 152 buildings and one school. Each building consists of 3 floors. A single apartment may produce 4 trash bags/week. Each bag may weigh 2.5kg/bag as shown in Eqns. (1), (2), (3) and Table 6.
Weight of apartments waste
Number of apartments x number of floors x number of garbage bags per week
(152) x (3) x (4)= 1,824 Trash bag (1)
Number of Trash bag x average weight of each bag
(1,824) x (2.5) =4,560 kg (2)
Weight of school waste
Number of Schools x number of garbage bags per week x average weight of each bag
x (21) x (5) =105 kg (3)
According to Table 5, 4,560 kg (4.56 tonnes) of SW & OW are produced from the residential sector weekly. In addition to that, the school gets rid of about 3 trash bags daily, which is 21 bags per week, and the average weight of each trash bag is about 5kg. According to Guirguis and Moussa [5] and to the field survey, 60% of the trash bags are OW. The percentage of OW from leftover food and vegetables represents 74.5% of the total OW, while 10% represents waste paper and 15.5% from other OW like fertilisers and liquids as shown in Table 7. The average amount of waste produced by district 4 is 4,665 kg (4.67 tonnes)/week, which is equivalent to 2,799 kg (2.80 tonnes)/week of OW as shown in Table 7.
AD technology affects positively the environmental, economic, and social aspects of the neighbourhood. In return, it will help in creating sustainable urban neighbourhoods. Using AD in district 4 will reduce the transportation costs which are paid for transporting garbage from New Cairo City to Katameya waste dump. With the help of the residents and by separating the types of waste into garbage bags, the neighbourhood can save 5,400 L.E. per month as shown in Table 8.
4.2 Section two
Using AD in district 4, which is located inside the 5th settlement neighborhood, will save an average of 1,350 EGP weekly, which is equivalent to 64,800 EGP annually from transport waste, as shown in Table 8.
The literature stated that AD needs 15 days to complete the digestion process. Furthermore, the literature stated that the amount of energy produced by the AD system could be calculated as follows:
Table 6. Total amount of wastes produced/week from district 4
|
Building type |
Number of Buildings |
No. of trash bags/ week |
Avg. Weight of one trash bag |
Total amount in Kg |
Total amount of wastes in study area/week |
|
|
building |
3 apartments in each building |
152 building x 3 apartments =456 apartment |
4 bags |
2.5kg/bag |
152 x 3 x 4 x 2.5= 4,560 kg |
4,560 +105 = 4,665 Kg |
|
School |
1 |
21 |
5 Kg |
1 x 21 x 5 =105 kg |
||
Table 7. Total amount of OW only produced from the neighbourhood/week
|
Types of OW |
Percentage of wastes in trash bags [39] |
Total amount of wastes produced from the neighbourhood |
Total percent of OW |
Total OW |
|
(food and vegetables leftovers |
74.5% |
4,665 kg |
(4,665 x 60) ÷ 100 = 2,799 kg |
2,799 x 74.5% = 2,085.3kg |
|
Paper |
10% |
2,799 x 10% = 279.9 kg |
||
|
Animal wastes |
2% |
2,799 x 2% = 55.98 kg |
||
|
Plants waste |
1.5% |
2,799 x 1.5% = 41.99 kg |
||
|
Other organic waste |
12 % |
2,799 x 12% = 335.88 kg |
Table 8. The total costs of transporting garbage from district 4 to Katameya waste dump
|
|
Transpiration cost (garbage cars) |
Workers monthly/ Salary |
|
No. of fuel litters in vehicle |
200 |
|
|
Gasoline price |
6.75 |
|
|
No of vehicles/ week |
1 |
|
|
Total cost/week |
200 x 6.75 x 1= 1,350 EGP |
|
|
Total Cost/month |
1,350 x 4 = 5,400 EGP |
1,800 |
|
Total Cost/year |
5,400 x 12= 64,800 EGP |
1,800 x 12= 21,600 EGP /year |
1kg of any OW produces approximately 0.04m3 of biogas, which means that 1m3 of biogas can be produced from 25 kg. In addition, 1m3 of biogas produces approximately 5kWh of electricity and approximately 5000 Btu of gas, which means 1kg can produce 200 Btu. The amount of electricity and gas produced from storing district 4 OW in AD is calculated in Table 9.
In Egypt, there is a WM strategy for recycling paper waste. This research will exclude paper waste from the waste that will be stored in AD in order not to thread the paper industry. According to table 10, the total energy generated weekly from storing the OW of district 4 in AD tanks is 559.81 kWh, which is equivalent to 559.81 x 4 =2,239.24 kWh/month
Table 4 shows that a single residential house consumes 401 kWh of electricity and 12.7 Btu of natural gas each month. Since there are 152 apartments in the study area, therefore the total electricity and gas monthly consumption of the residential sector in the study area is 60,952 kWh /month and 1930.4 Btu/month as shown in Table 10.
The study revealed that storing OW collected from district 4 in AD will save up to 3.6% of the electricity consumed by the district's residential sector. In addition, using AD will produce 396 times more than the gas needed to satisfy the residential sector, as calculated in Table 10. This nonstop energy generation can be sold to the government, and in return, it will bring an extra income to the neighbourhood.
The anaerobic digester system produces an average amount of 9028.8 KW of clean energy every 15 days which is consistent with the research outcomes. This non-stop energy produced every 15 day, can be used in households to run home appliances (lighting, TV, etc.) at a cheaper price. It can also be used in medical buildings such as hospitals in different ways (lighting, X-ray, and other medical devices which use electricity). The AD system can also produce 361152 kilocalories of biogas, which can be used in heating space and water. It can also be used in stoves, ovens, clothes dryers, lighting fixtures, and other appliances like vehicle fuel [32].
Applying AD digesters in Egyptian districts will reduce street garbage accumulation, which in turn will decrease the rate of air and water pollution, resulting in a better and healthier environment for the residents. Installing AD systems in residential districts will reduce the gathering of street dogs and their negative impact on residents’ health, safety, and street visual image. The accumulation of waste causes smelly streets which attract insects and create unhealthy environments for kids, so using AD will reduce this impact [5].
In Egypt, one of the ways of getting rid of organic waste is by burring the wastes which form the "black cloud" [40]. Due to the "black cloud", most Egyptian residents suffer from chest allergies. Moreover, it increases the urban heat island and the atmospheric temperature [9, 41].
Using AD in Egyptian districts and neighborhood will help in creating clean and healthy neighbourhood. Moreover, it will affect the economy, environment, as well as the quality of life of the people in the neighborhood. Using AD in Egyptian districts and neighbourhoods will help in creating a clean and healthy neighbourhood. Moreover, it will affect the economy, environment, as well as the quality of life of the people in the neighborhood.
The limitation of this research can be summarized as the following
-The accurate amount of electricity and gas consumed by the study area.
-The precise amount of organic waste in kilo gram collected from a specific site.
-The impact of street garbage accumulation on residents' health.
Table 9. The total energy generated from storing OW produced from district 4 in AD tanks
|
Amount of OW produced from the study area in week |
Type of Energy |
Electricity |
Biogas |
||
|
Electricity generated from 1kg of OW |
Total electricity produced in 15 days |
Amount of Btu produced from 1kg of OW |
Total gas in Btu in 15 days |
||
|
2,085.3 kg |
Food & vegetable leftovers |
0.2 kWh |
2,085.3 kg x 0.2 kWh = 417.06 kWh |
200 |
2,085.3 kg x 200 Btu = 417,060 Btu |
|
279.9 kg |
Paper |
0.2 kWh |
279.9 kg x 0.2 kW = 55.98 kWh |
200 |
279.9 kg x 200 Btu = 55,980 Btu |
|
55.98 kg |
Animal wastes
|
0.2 kWh |
55.98 kg x 0.2 kW = 11.196 kWh |
200 |
55.98 kg x 200 Btu = 11,190 Btu |
|
41.99 kg |
Plants waste |
0.2 kWh |
41.99 kg x 0.2 kW =8.398 kWh |
200 |
41.99 kg x 200 Btu = 8,398 Btu |
|
335.88 kg |
other organic materials |
0.2 kWh |
335.88 kg x 0.2 kW = 67.176 kWh |
200 |
335.88 kg x 200 Btu = 67,176 Btu |
|
2,799 kg |
Total |
559.81 kWh |
559,804 Btu |
||
|
2,519.1 kg |
Total without the paper wastes |
503.83 kWh |
503,824Btu |
||
Table 10. Calculating the efficiency of using AD in district 4
|
Number of apartments |
Electricity |
Biogas |
||||
|
Consumption of single residential house |
Consumption of residential sector |
Generated from AD in month |
Consumption of single residential house |
Consumption of residential sector |
Generated from AD in 30 days |
|
|
152 |
401 kWh |
401 x 152 = 60,952 kWh |
559.81 x 4 =2,239.24 kWh |
12.7 Btu |
12.7 x 152 = 1930.4 Btu |
382805.48 x 2 = 765610.96 Btu |
|
Total energy saved |
- 2,239.24 + 60,952 = 58,712.76 kWh/month
|
765610.96 - 1930.4 = 763680.56 Btu |
||||
This article discussed the potential of using OW to become a major energy supplier, a sustainable solution for getting rid of OW produced from residential neighbourhoods in developing countries like Egypt. Moreover, using these wastes to generate energy and gas. The research proposed that the AD system could play a principal role in minimizing the activities of garbage collection and waste exposition in low-income countries by incorporating large AD tanks into the residential neighbourhoods and districts. These large AD tanks are cheap and will satisfy the residents’ needs for energy. Incorporating the AD system will generate renewable energy that will meet the needs of the residential sector.
The result section showed that, using AD in developing countries such as Egypt will generate 396 more gas than the neighbourhood consumes, and this energy can be used as an extra income for the neighbourhood by selling this non-stop energy to the government.
Using AD in return will help in solving one of the major problems facing developing countries and standing in front of their development, which is the availability of gas and power supply.
Recently, the Egyptian government set a new police for dealing with solid waste, but the Egyptian government still has no clear police or strategy for dealing with organic waste. This research recommended installing AD tanks in the middle of the district with a reasonable walkable distance and under the district's main streets and roads. Planning a long-term strategy for constructing AD tanks under the main roads or streets in each Egyptian district This action will help in solving the waste accumulation problem, and it will preserve governmental lands since the AD tanks will not need free land for the tanks and the tanks can be accessed for maintenance from the sidewalks.
[1] Moussa, R.R. (2018). The role of energy-scape elements in creating sustainable economic project in Egyptian parks. Ain Shams Engineering Journal, 9(4): 3045-3053. https://doi.org/10.1016/j.asej.2018.09.001
[2] Moussa, R.R., Mansour, M.M.M. and Yossif, N.M. (2021). Statistic equation to estimate the amount of CO2 emission produced from high traffic density roads. WSEAS Transactions on Power Systems, 16: 78-86. https://doi.org/10.37394/232016.2021.16.8
[3] Alaa, H., Khaled, N., Moussa, R.R., Hatem, T.M. (2021). Zero energy educational building: A case study of the energy and environmental engineering building in the British university in Egypt. 2021 IEEE 48th Photovoltaic Specialists Conference (PVSC), pp. 1913-1915. https://doi.org/10.1109/PVSC43889.2021.9518995
[4] Micheal, A., Moussa, R.R. (2021). Investigating the economic and environmental effect of integrating sugarcane bagasse (SCB) fibers in cement bricks. Ain Shams Engineering Journal, 12(3): 3297-3303. https://doi.org/10.1016/j.asej.2020.12.012
[5] Guirguis, M.N., Moussa, R.R. (2019). Investigation on utilizing garbage as a resource for a sustainable neighbourhood: Case study of a neighbourhood in New Cairo, Egypt. IOP Conf. Series: Earth and Environmental Science, 397: 012018. https://doi.org/10.1088/1755-1315/397/1/012018
[6] Machate, M. (2020). The conundrums of the estimated magnitude of food waste generated in South Africa. International Journal of Sustainable Development and Planning, 15(6): 893-899. https://doi.org/10.18280/ijsdp.150613
[7] Micheal, A., Moussa, R.R. (2022). Evaluating the Effect of adding sugarcane bagasse to the fire clay brick's properties. Civil Engineering and Architecture, 10(1): 71-78. https://doi.org/10.13189/cea.2022.100106
[8] Tolba, R.A., El-Shirbeny, M.A., Abou-Shleel, S.M., and El-Mohandes, M.A. (2018). Monitoring and assessment of rice straw fires in the Egyptian Nile delta using satellite data. Conference: 1st International Scientific Conference “Agriculture and Futuristic Challenges”, At Faculty of Agriculture-Cairo, Al-Azhar University, Nasr City, Cairo, Egypt. https://www.researchgate.net/publication/326973073_Monitoring_and_Assessment_of_Rice_Straw_Fires_in_the_Egyptian_Nile_Delta_Using_Satellite_Data.
[9] Marey, H.S., Gille, J.C., El‐Askary, H.M., Shalaby, E.A., El‐Raey, M.E. (2010). Study of the formation of the “black cloud” and its dynamics over Cairo, Egypt using MODIS and MISR sensors. Journal of Geophysical Research, 115(D21): 1-10. https://doi.org/10.1029/2010JD014384
[10] Kamal, M.A., Moussa, R.R., Guirguis, M.N (2021). Recycled plastic as an aggregate in concrete. Civil Engineering and Architecture - HRPUB, 9(5): 1289-1294. https://doi.org/10.13189/cea.2021.090502
[11] El-Qady, H. (2012). Waste problem in Egypt, Cairo: Council of Ministers, Information and Decision Support Center. https://manshurat.org/node/11075
[12] World Bank. (2018) World Development Indicators [WWW Document]. https://www.worldbank.org/, accessed on Feb. 20, 2022.
[13] ZainAlabidin, N. (2019). Effect of middle class decline on cultural and value framework. Egyptian institute for studies. 1-10. https://en.eipss-eg.org/effect-of-middle-class-decline-on-cultural-and-value-framework/, accessed on Feb. 20, 2022.
[14] Abdallah, M., Arab, M., Shabib, A., El Sherbiny, R., El Sheltawy, S. (2020). Characterization and sustainable management strategies of municipal solid waste in Egypt. Clean Technologies and Environmental Policy, 22: 1371-1383. https://doi.org/10.1007/s10098-020-01877-0
[15] Hemidat, S., Achouri, O., El Fels, L., Elagroudy, S., Hafidi, M., Chaouki, B., Ahmed, M., Hodgkinson, I., Guo, J. (2022). Solid waste management in the context of a circular economy in the MENA region. Sustainability, 14(1): 480. https://doi.org/10.3390/su14010480
[16] Kiyasudeen, K., Ibrahim, M.H., Quaik, S., Ismail, S.A. (2016). Prospects of Organic Waste Management and the Significance of Earthworms. Applied Environmental Science and Engineering for a Sustainable Future, Springer International Publishing Switzerland. https://doi.org/10.1007/978-3-319-24708-3
[17] Abdullatif, K.G., Guirguis, M.N., Moussa, R.R. (2020). Analyzing the structural properties of fire clay bricks after adding cigarette filters. WSEAS Transactions on Environment and Development, 16: 671-679. https://doi.org/10.37394/232015.2020.16.69
[18] Elfeki, M., Tkadlec, E. (2015). Treatment of municipal organic solid waste in Egypt. J. Mater. Environ. Sci., 6(3): 756-764. https://www.jmaterenvironsci.com/Document/vol6/vol6_N3/88-JMES-1184-2014-Elfeki.pdf.
[19] Dawoud, N., Micheal, A., Moussa, R.R. (2020). A review on investigating the experimental process for partial replacement of cement with sugarcane bagasse in the construction industry. The international conference on Civil and Architecture Engineering (ICCAE), Cairo_ Egypt. IOP Conference Series: Materials Science and Engineering, 974(1): 012036. https://doi.org/10.1088/1757- 899X/974/1/012036
[20] Ciolkosz, D. (2013). Introduction to Biogas and Anaerobic Digestion. http://articles.extension.org/pages/26608/introduction-to-biogas-and-anaerobic-digestion, accessed on Dec. 15, 2017.
[21] Council, A.B. (2015). What is Anaerobic Digestion. https://www.americanbiogascouncil.org/biogas_what.asp, accessed on Jan. 21, 2017.
[22] Moussa, R.R., Mahmoud, A.H. (2017). Energy-scape elements: An approach on integrating landscape elements with renewable energy devices. Journal of Cleaner Production, 153: 114-130. https://doi.org/10.1016/j.jclepro.2017.03.077
[23] Noaman, A.S., Alsaffar, A.E. (2019). A suggestion of a procedural method for the management of post-war waste. Civil Engineering Journal, 5(10): 2143- 2151. http://dx.doi.org/10.28991/cej-2019-03091400
[24] Moussa, R.R., Mahmoud, A.H., Hatem, T.M. (2020). A digital tool for integrating renewable energy devices within landscape elements: Energy-scape online application. Journal of Cleaner Production, 254: 1-13. https://doi.org/10.1016/j.jclepro.2019.119932
[25] Kong, X., Wei, Y., Xu, S., Liu, J., Li, H., Liu, Y., Yu, S. (2016). Inhibiting excessive acidification using zero-valent iron in anaerobic digestion of food waste at high organic load rates. Bioresour. Technol., 211: 65-71. https://doi.org/10.1016/j.biortech.2016.03.078
[26] Fiore, S., Ruffino, B., Campo, G., Roati, C., Zanetti, M.C. (2016). Scale-up evaluation of the anaerobic digestion of food-processing industrial wastes. Renew. Energy, 96: 949-959. https://doi.org/10.1016/j.renene.2016.05.049
[27] Rajagopal, R., Masse, D.I., Singh, G. (2013). A critical review on inhibition of anaerobic digestion process by excess ammonia. Bioresour. Technol., 143: 632-641. https://doi.org/10.1016/j.biortech.2013.06.030
[28] Rauh, S. (2016). The role of biogas in the heat transition in Germany. DBFW Conference, Paris: German Biogas Association. file:///C:/Users/Rania/Downloads/07_Stefan_Rauh_Fachverband_Biogas_OFATE_DFBEW.pdf, accessed on Jan. 3, 2020.
[29] Bundestag, G. (2019). Bioenergy in Germany Facts and Figures 2020. Berlin: Fachagenhur Nachwachsende Rohstoffe. http://www.fnr.de/fileadmin/allgemein/pdf/broschueren/broschuere_basisdaten_bioenergie_2018_engl_web_neu.pdf.
[30] Lou, X.F, Nair, J., Ho, G. (2013). Potential for Energy Generation from anaerobic digestion of food waste in Australia. Waste Manag Res., 31(3): 283-294. https://doi.org/10.1177/0734242X12474334
[31] Linville, J.L., Shen, Y., Wu, M.M., Urgun-Demirtas, M. (2015). Current state of anaerobic digestion of organic wastes in North America. Curr Sustainable Renewable Energy Rep., 2: 136-144. https://doi.org/10.1007/s40518-015-0039-4
[32] Prabhu, M.S., Mutnuri, S. (2016). Anaerobic co-digestion of sewage sludge and food waste. Waste Manag. Res., 34(4): 307-315. https://doi.org/10.1177/0734242X16628976
[33] Zhang, D., Cheng, S., Gao, L., Cao, X., Liu, X., Liu, Y., Bai, J., Wen, Y. (2016). Ecological footprint of catering industry food waste in Beijing. Resour. Sci., 38(1): 10-18. https://doi.org/10.5846/stxb201504150769
[34] Zhang, R., El-Mashad, H.M., Hartman, K., Wang, F., Liu, G., Choate, C., Gamble, P. (2007). Characterization of food waste as feedstock for anaerobic digestion. Bioresour. Technol., 98: 929-935. https://doi.org/10.1016/j.biortech.2006.02.039
[35] Pantaleo, A., Gennaro, B.D., Shah, N. (2013). Assessment of optimal size of anaerobic co-digestion plants: An application to cattle farms in the province of Bari (Italy). Renew. Sustain. Energy Rev., 20: 57-70. DOI: https://doi.org/10.1016/j.rser.2012.11.068
[36] Mohammed, J., Ridha, A.M., Majeed, M.H. (2020). Improved of biogas production by anaerobic co-digestion of ziziphus leaves and cow manure wastes. International Journal of Design & Nature and Ecodynamics, 15(2): 239-244. https://doi.org/10.18280/ijdne.150214
[37] Nugraha, A.T., Prayitno, G., Himah, D.A. (2021). The concept for the development of biogas as renewable energy in rural Indonesia. International Journal of Sustainable Development and Planning, 16(6): 1177-1183. https://doi.org/10.18280/ijsdp.160618
[38] Moussa, R.R. (2019). The potential of using anaerobic digesters in developing countries. Cleaner Engineering and Technology, 100517. https://doi.org/10.1016/j.clet.2022.100517
[39] Moussa, R.R., Elsawaf, L.A. (2022). Using anaerobic digesters as a sustainable approach in creating sustainable cities in Egypt. Environment and Ecology Research, 10(2): 314-323. https://doi.org/10.13189/eer.2022.100222
[40] Daoud, A.O., Othman, A.A.E., Ebohon, O.J., Bayyati, A. (2021). Quantifying materials waste in the Egyptian construction industry: A critical analysis of rates and factors. Ain Shams Engineering Journal, 12(4): 4275-4289. https://doi.org/10.1016/j.asej.2021.02.039
[41] Moussa, R.R. (2019). The reasons for not implementing green pyramid rating system in Egyptian buildings. Ain Shams Engineering Journal, 10(4): 917-927. https://doi.org/10.1016/j.asej.2019.08.003