Nida Nasir | Neda Afreen* | Ranjeeta Patel | Simran Kaur | Mustafa Sameer
© 2021 IIETA. This article is published by IIETA and is licensed under the CC BY 4.0 license (http://creativecommons.org/licenses/by/4.0/).
OPEN ACCESS
Diabetic Retinopathy (DR) and Diabetic Macular Edema (DME) are complication that occurs in diabetic patient especially among working age group that leads to vision impairment problem and sometimes even permanent blindness. Early detection is very much needed for diagnosis and to reduce blindness or deterioration. The diagnosis phase of DR consumes more time, effort and cost when manually performed by ophthalmologists and more chances of misdiagnosis still there. Research community is working on to design computer aided diagnosis system for prior detection and for DR grading based on its severity. Ongoing researches in Artificial Intelligence (AI) have set out the advancement of deep learning technique which comes as a best technique to perform analysis and classification of medical images. In this paper, research is applied on Resnet50 model for classification of DR and DME based on its severity grading on public benchmark dataset. Transfer learning approach accomplishes the best outcome on Indian Diabetic Retinopathy Image Dataset (IDRiD).
diabetic macular edema, diabetic retinopathy, transfer learning, ResNet50
In the medical care field, therapy of disease is more viable when detected at a beginning phase. Diabetes disease occurs when level of glucose rises due to insufficient insulin. Diabetes influences retina, kidneys, heart and nerves. According to the report of WHO diabetes affected 423 million people in 2014 across worldwide which may go to 700 million in 2050 [1].
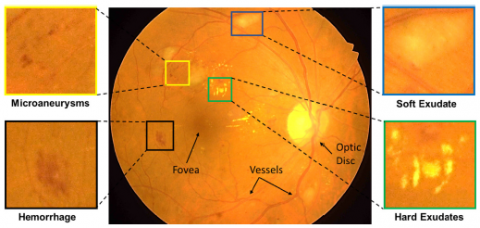
Diabetic Macular Edema (DME) and Diabetic Retinopathy (DR) are complication that occurs in diabetic patient especially among working age group. DR is an intricacy of diabetes that leads to expand the retina veins and to spill liquids and blood. DR leads to vision impairment problem [2]. Diagnosis of DR at early stage might be founded on practical conversion in electroretinography (ERG), retinal vein type and retinal blood stream [3]. The probability of DR increases in diabetes patients who experience the ill effects of the disease for an extensive stretch. The screening of retina at regular time is important for patients to analyze and for DR treatment at an initial phase to mitigate the possibility of vision loss [4]. DR is distinguished by the presence of various kinds of sign on a retina picture. These signs are listed as [5] Haemorrhages (HM), Soft exudates, hard exudates (EX) and Microaneurysms (MA) in Table 1.
Detection is very crucial for the diagnosis at early stage and to reduce blindness or deterioration. Manual diagnosis takes more time and is costly. On the other hand, automated detection makes the process easy. To address such issue and to maximize the result, this study explored the transfer leaning based Resnet50 network for DR and DME detection. The main contribution of this study is to implement transfer learning technique to get improved DR and DME classification result based on severity grading on the publicly available dataset as transfer learning use less computation and time as compared to traditional machine learning.
Table 1. Lesion and their description
|
Lesion |
Description |
|
Haemorrhages |
Enormous mark upon the retina having dimension more than 125 µm |
|
Microaneurysms |
Initial condition of DR shows up like little red round specks upon the retina and size is under 125µm and sharp edge |
|
Soft exudates |
White marks upon the retina due to inflammation of the nerve fibre, having round or oval shape |
|
Hard exudates |
Dazzling yellow mark upon the retina Keen edge present in the retina’s external layer |
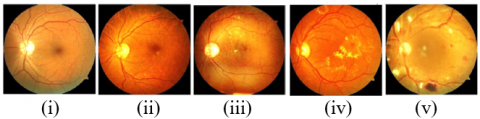
DR is graded into five different stages relying upon the appearance of these signs which are no DR, mild DR, moderate DR, severe DR and proliferative DR [6], that are concisely mentioned in Table 2 [7]. In the stage of mild DR patients have at least one MA in which close inspection and monitoring is very important, in moderate stage patients could have hemorrhages or MAs in one to three retinal quadrants and it is essential to visit the doctor every 6 to 8 months, in severe DR patients have intraretinal hemorrhages, venous beading in two or more quadrants and it should be monitored using both macular OCT and fluorescein angiography to detect any DME and in the proliferative stage patients require immediate referral to a retina specialist . Retina image having some abnormalities and its grading into different stages are illustrated in Figure 1 and Figure 2.
DR detection based on automated methods saves time and cost and shows better proficiency compared to manual analysis. The chance of misdiagnosis is more when performed manually and more effort is also required in this method compared to automated technique. Early detection is crucial for diagnosis and to reduce blindness or deterioration. Ongoing researches in Artificial Intelligence (AI) have set out the advancement of deep learning technique which comes as a best technique to perform analysis and classification of medical images. And here Resnet50 model performs classification of DR and DME based on severity grading on public benchmark dataset IDRiD and achieves better accuracy for training and testing. The proposed challenge design provides an avenue for determining precise DR severity status as well as the potential to deliver precise measures for lesions, which may aid in follow up studies to notice changes in the retinal atlas.
The paper is arranged in the following manner: Section 2 introduces literatures of related work. Section 3 depicts the details of working model methodology, Section 4 shows our dataset along with exploratory outcomes and Section 5 follows conclusions.
Figure 1. Retina images with grading levels (i) normal, (ii) mild, (iii) moderate, (iv) severe and (v) proliferative DR
Figure 2. Normal retinal image and abnormalities related to DR
Table 2. Grading of DR on its severity basis and presence of sign
|
DR severity grading |
Signs |
|
No DR |
Absence of any abnormalities |
|
Mild DR |
Only MA present |
|
Moderate DR |
Signs lying between MA and severe DR |
|
Severe DR |
Can be any of them: Number of intraretinal HM in each four quadrants is more than 20. Venous beading in more than two quadrants. Noticeable intraretinal microvascular issue in more than one quadrant |
|
Proliferative DR |
neovascularization Pre-retinal/Vitreous HM |
Early work on DR depends on manual features to quantify the veins and optic circle and measuring the presence of irregularities, for example, Haemorrhages, Microaneurysms, Hard exudates and soft exudates. After that grading was performed by hand crafted features using different machine learning methods such as support vector machines (SVM), k-nearest neighbor (KNN). Lachure et al. [8] suggested a method for detecting microaneurysms and exudates from retina which is considered as first sign of DR with the help of K-nearest neighbor and support vector machine classifier. After preprocessing, feature extraction using GLCM is performed for further classification. SVM classifier gets better result over KNN. Patton et al. [9] performed exploration and laid out standards for retinal image examination and discussed about the technique for detecting retinal landmarks and signs related with DR. Jordon et al. [10] gives a short prologue to quantitative strategies for the examination of fundus pictures with an attention on recognizing retinal signs and examining of retinal disease based on automatic techniques. Acharya et al. [11] suggested a method for grading DME into stages by applying feature extraction techniques without any segmentation process. Features are mainly shape, size, texture, brightness, color, pixels clusters information in domain of spatial and or transform. Feature extraction is performed using Top-hat filtering, Radon transform, discrete cosine transform and discrete wavelet transform and classification is done through support vector machine and decision tree classifier.
2.1 Deep learning techniques
In deep learning method, network directly learns low level depiction and high level parameters from data directly and lowers the need of human intervention for feature engineering. Hacisoftaoglu et al. [12] presented a method based on GoogleNet, AlexNet, ResNet50 and CNN based framework to increase the result of DR recognition in cell-phone based and conventional fundus camera retina pictures. Retraining of these frameworks are performed on various datasets such as Messidor, EyePACS, IDRiD to examine the outcome of deploying images from different group of single, multiple, cross datasets. These techniques achieve high accuracy on independent test datasets. Alyoubi et al. [13] presented the new cutting edge strategies for DR color fundus pictures location and deep learning procedures for classification. Moreover, the DR datasets for the color fundus retina surveyed. Contrast testing issues that need more examination are additionally taken by them. Li et al. [14] presented a new method for grading DR and DME jointly using cross disease attention network. It investigates the inward connections between the diseases with just picture level oversight. They designed two attention modules separately to learn disease dependent and disease specific features and then integrate these for grading DR and DME to increase the outcome of grading. They use Messidor and IDRiD dataset for evaluation. Reguant et al. [15] proposed a method where they initially perform visualization using CNN to find the innate image features engaged with the CNN's accountability process. Then, they fundamentally break down those provisions regarding generally known pathologies in particular hemorrhages, microaneurysms and exudates, and other visual segments. And additionally examine different CNNs by thinking about what picture highlights they get at learning time for predicting their clinical importance. The analyses are done on openly accessible fundus EyePACS and DIARETDB1 datasets. While different CNNs bring out predictable characterization results, the pace of getting image features conflict among models can be pretty much higher as 70%.
Here, we opted to classify the most recent papers on the basis of whether or not they used deep learning in the ambience of DR. Researchers can improve the performance of the DR referral system by using artificial intelligence to create more robust diagnosis system that can offer quantitative information for many diseases that meets international clinical relevance requirements. Some of the shortcoming of traditional technique is overcome by machine learning specifically deep learning techniques because of its automatic feature extraction technique. Discussed recent literature concludes that deep learning can be efficiently used for retinal lesion detection and grading.
This segment introduces the overall structure of employed deep learning architecture with the help of transfer learning technique. Deep learning (DP) is a subset of Artificial Intelligence (AI) which takes motivation from the structure of human brain. DL has different layers of hierarchy consisting of non-linear processing phases for pattern classification as well as for unsupervised features learning. DL has many applications in medical image analysis including segmentation, image registration, retrieval and classification. DL learns the structure by extracting relevant features from the network using training set images [16]. This learning ability definitely reduces the requirement for engineering special features, but the approach based on full end-to-end training of DL commonly require a critical number of samples. Training is important part of any DL framework where the network wants more than thousand numbers of images to be feed into to learn pixel esteems and edges [17]. However, datasets which are available publicly have not sufficient number of retinal images to train such a large network from beginning, so transfer learning approach comes into picture to utilize the pretrained networks.
Training DL framework is exceptionally required in terms of managing computational resources and data requirement [18]. Training strong and precise model can be little bit difficult regarding clinical data. Medical images are exceptionally difficult to acquire because of the involvement of vital curation, lawful issues and annotation. It is conceivable anyway to use models that are already trained on huge datasets, for example, ImageNet which transfers the acquired information to another model regardless of whether the application fields contrast. Transfer learning does precisely improve the learning part of model by transferring the information from one to another which are already pretrained [19]. Knowledge transfer for medical imaging area from ImageNet [20] helps the network to easily find out the low level features from image. In retinal image dataset, detection of DR and DME can be performed by fine tuning the model which means retraining the model for new task which will increase the overall accuracy and speed in comparison to training the model from beginning [21].
3.1 Network architecture of ResNet50
We use ResNet50 architecture for classification and feature extraction problem. It is one of the famous DL architecture which is used to perform classification task. It is trained on large ImageNet dataset comprises millions of images and classify them into thousand number of classes [22]. ResNet50 have 177 layers and there is introduction of skip connection which takes the input from preceding layer and feed into the succeeding layer without any changes as mentioned in Figure 3. ResNet50 implements 1×1 layer of convolution to lessen the overall computation, which in turns decrease the size of the model and also the numbers of parameters. In transfer learning, the last three layers of pretrained network substitutes by fully connected, softmax and classification layer. First few layers are frozen by fixing the learning rate zero and remaining layers are updated during the training process [23]. The network is retrained on retina image using learning rate 1e-4, batch size of 20 for 100 to 200 epochs depends on image size followed by drop out layer with dropout rate 0.5 and Adam optimizer [24] for optimization. Loss function sparse categorical loss is employed for DR and DME grading and to find particular features of disease [25].
Figure 3. Transfer learning approach for grading DR/DME
4.1 Dataset (IDrId)
The IDRiD dataset was made from genuine clinical test acquired at an eye hospital situated in Nanded, a place inside Maharashtra, India. It collects the retinal photograph of a person having diabetes by focus on macula with the help of Kowa VX-10α fundus camera. The images captured by camera have field view of 50° and resolution of 4288×2848 pixels and are stored in jpg format. The final dataset contains 516 images having distinct pathological conditions of 5 DR classes and 3 DME classes [26]. The grading of DR into five classes is based on the disease severity and DME is annotated according to the least distance among the macula and the hard exudates position [27]. There are 413 training images and 103 testing images respectively [28]. The statistics labeling inside IDRiD dataset is given in Table 3. Three kind of ground truth are associated with the IDRiD dataset which are given below:
Table 3. Statistics of labels in the dataset with label counts and relative value
|
DR DME |
0 |
1 |
2 |
3 |
4 |
|
0 |
134,26% |
18,3.5% |
36, 7.0% |
5, 1.0% |
4, 0.8% |
|
1 |
0,0.0% |
0,0.0% |
24, 4.6% |
4, 0.8% |
2, 0.4% |
|
2 |
0,0.0% |
0,0.0% |
140,27.1% |
116,22.4% |
33,6.4% |
4.2 Performance metrics
There are numerous performance standard measures for quantifying classification performance of Deep Learning techniques. The widely used standard measures are area under curve (AUC), accuracy, specificity and sensitivity. Accuracy is measured as the number of images in percentage which are correctly classified. Specificity measures the normal images in percentage that classified as normal and sensitivity measure the abnormal image percentage which are classified as abnormal by classifier. AUC draws in form of graph which is plotted between specificity and sensitivity.
Accuracy $=\frac{\mathrm{TN}+\mathrm{TP}}{\mathrm{TP}+\mathrm{FP}+\mathrm{FN}+\mathrm{TN}}$ (1)
Sensitivity $=\frac{\mathrm{TP}}{\mathrm{FN}+\mathrm{TP}}$. (2)
Specificity $=\frac{\mathrm{TN}}{\mathrm{FP}+\mathrm{TN}}$ (3)
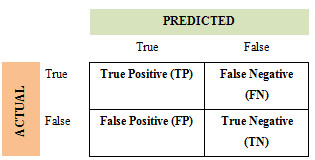
where, TP is True Positive which shows the instances disease images which are correctly classify into disease. True Negative (TN) is the instances of non-diseased image which classified under non-diseased. False Positive (FP) is the instances of non-diseased image but classify into diseased while False Negative (FN) is the instance of diseased image but are classify into normal. Confusion matrix is used to demonstrate these instances which is shown in Figure 4.
Figure 4. Confusion matrix
4.3 Results and discussion
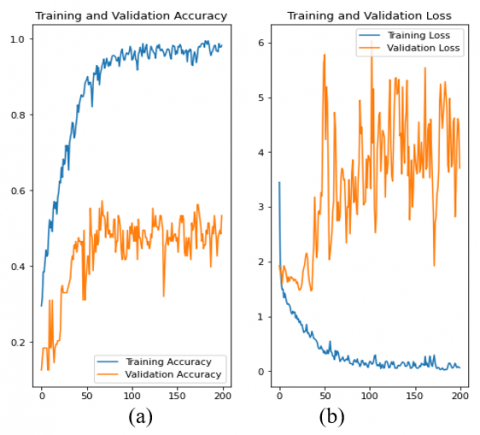
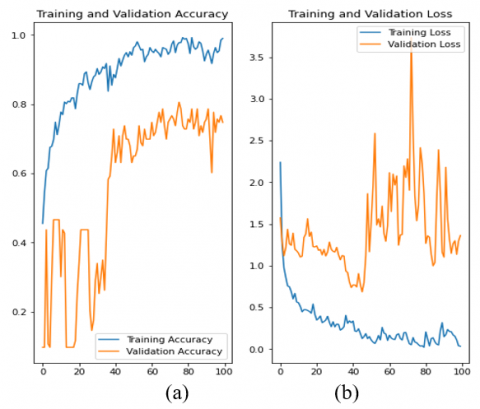
The ResNet50 framework is used for DR and DME grading. The network is retrained with the ADAM optimizer by putting learning rate 1e-4, batch size of 20 for 100 to 200 epochs followed by drop out layer with dropout rate 0.5 and sparse categorical loss is employed as loss function. These parameters are illustrated in Table 4. The model accuracy for DR and DME grading is given in Table 5. For DR grading, training accuracy is 98.5% and testing accuracy is 53.4% whereas for DME grading, the model achieves 95.8% training accuracy and 74.76% testing accuracy.
Table 4. Model parameters
|
Parameter |
Value |
|
Learning Rate |
1e-4 |
|
Epochs |
100/200 |
|
Optimization Loss Function |
Adam Optimizer Sparse categorical loss |
Table 5. Training and testing accuracy of DR and DME
|
Grading |
Training Accuracy |
Testing Accuracy |
|
DR |
98.5% |
53.4% |
|
DME |
95.8% |
74.76% |
Figure 5. (a) Accuracy curve (b) loss curve
Training and validation accuracy and loss of DR grading is given in Figure 5.
Training and validation accuracy and loss of DME grading on 100 epoch is given in Figure 6.
Figure 6. (a) Accuracy curve (b) loss curve
To advance research in clinical area especially for diabetic retinopathy diagnosis, employment of transfer learning for DR and DME classification based on its grading is performed. Diabetic Retinopathy is a complication that occurs in diabetic patient especially among working age group that leads to vision impairment problem and sometimes even permanent blindness. Early detection is crucial for diagnosis and to reduce blindness or deterioration. Ongoing researches in Artificial Intelligence (AI) have set out the advancement of deep learning technique which comes as a best technique to perform analysis and classification of medical images. And here ResNet50 model performs classification of DR and DME based on severity grading on public benchmark dataset IDRiD and achieves better accuracy for training and testing.
[1] National Diabetes Statistics Report. (2020). Centers for Disease Control and Prevention. Atlanta, GA. https://www.cdc.gov/diabetes/data/statistics-report.
[2] Bourne, R.R., Stevens, G.A., White, R.A., Smith, J.L., Flaxman, S.R., Price, H., Jonas, J.B., Keeffe, J., Leasher, J, Naidoo, K., Pesudovs, K., Resnikoff, S., Taylor, H.R. (2013). Causes of vision loss worldwide, 1990-2010: A systematic analysis. The Lancet Global Health, 1(6): e339-e349. https://doi.org/https://doi.org/10.1016/S2214-109X(13)70113-X
[3] Zhou, Y., Wang, B., Huang, L., Cui, S., Shao, L. (2020). A benchmark for studying diabetic retinopathy: Segmentation, grading, and transferability. IEEE Transactions on Medical Imaging, 40(3): 818-828. https://doi.org/10.1109/TMI.2020.3037771
[4] Tsiknakis, N., Theodoropoulos, D., Manikis, G., Ktistakis, E., Boutsora, O., Berto, A. (2021). Deep learning for diabetic retinopathy detection and classification based on fundus images: A review. Computers in Biology and Medicine, 135: 104599. https://doi.org/10.1016/j.compbiomed.2021.104599
[5] Sambyal, N., Saini, P., Syal, R., Gupta, V. (2020). Modified U-Net architecture for semantic segmentation of diabetic retinopathy images. Biocybernetics and Biomedical Engineering, 40(3): 1094-1109. https://doi.org/https://doi.org/10.1016/j.bbe.2020.05.006
[6] Fadzil, M.A., Izhar, L.I., Nugroho, H., Nugroho, H.A. (2011). Analysis of retinal fundus images for grading of diabetic retinopathy severity. Medical & Biological Engineering & Computing, 49(6): 693-700. https://doi.org/10.1007/s11517-011-0734-2
[7] Wilkinson, C.P., Ferris III, F.L., Klein, R.E., Lee, P.P., Agardh, C.D., Davis, M. (2003). Proposed international clinical diabetic retinopathy and diabetic macular edema disease severity scales. Ophthalmology, 110(9): 1677-1682. https://doi.org/https://doi.org/10.1016/S0161-6420(03)00475-5
[8] Lachure, J., Deorankar, A.V., Lachure, S., Gupta, S., Jadhav, R. (2015). Diabetic retinopathy using morphological operations and machine learning. In 2015 IEEE International Advance Computing Conference (IACC), pp. 617-622. https://doi.org/10.1109/IADCC.2015.7154781
[9] Patton, N., Aslam, T.M., MacGillivray, T., Deary, I.J., Dhillon, B., Eikelboom, R.H. (2006). Retinal image analysis: concepts, applications and potential. Progress in Retinal and Eye Research, 25(1): 99-127. https://doi.org/10.1016/j.preteyeres.2005.07.001
[10] Jordan, K.C., Menolotto, M., Bolster, N.M., Livingstone, I.A., Giardini, M.E. (2017). A review of feature-based retinal image analysis. Expert Review of Ophthalmology, 12(3): 207-220. https://doi.org/10.1080/17469899.2017.1307105
[11] Acharya, U.R., Mookiah, M.R.K., Koh, J.E., Tan, J.H., Bhandary, S.V., Rao, A.K. (2017). Automated diabetic macular edema (DME) grading system using DWT, DCT features and maculopathy index. Computers in Biology and Medicine, 84: 59-68. https://doi.org/10.1016/j.compbiomed.2017.03.016
[12] Hacisoftaoglu, R.E., Karakaya, M., Sallam, A.B. (2020). Deep learning frameworks for diabetic retinopathy detection with smartphone-based retinal imaging systems. Pattern Recognition Letters, 135: 409-417. https://doi.org/https://doi.org/10.1016/j.patrec.2020.04.009
[13] Alyoubi, W.L., Shalash, W.M., Abulkhair, M.F. (2020). Diabetic retinopathy detection through deep learning techniques: A review. Informatics in Medicine Unlocked, 20: 100377. https://doi.org/10.1016/j.imu.2020.100377
[14] Li, X., Hu, X., Yu, L., Zhu, L., Fu, C. W., Heng, P.A. (2019). CANet: Cross-disease attention network for joint diabetic retinopathy and diabetic macular edema grading. IEEE Transactions on Medical Imaging, 39(5): 1483-1493. https://doi.org/10.1109/TMI.2019.2951844
[15] Reguant, R., Brunak, S., Saha, S. (2021). Understanding inherent image features in CNN-based assessment of diabetic retinopathy. Scientific Reports, 11(1): 1-12. https://doi.org/10.1038/s41598-021-89225-0
[16] Razzak, M.I., Naz, S., Zaib, A. (2018). Deep learning for medical image processing: Overview, challenges and the future. Classification in BioApps, pp. 323-350. https://doi.org/10.1007/978-3-319-65981-7_12
[17] Mahajan, A., Somaraj, K., Sameer, M. (2021). Adopting artificial intelligence powered ConvNet to detect epileptic seizures. In 2020 IEEE-EMBS Conference on Biomedical Engineering and Sciences (IECBES), pp. 427-432. https://doi.org/10.1109/IECBES48179.2021.9398832
[18] Hussain, M., Bird, J.J., Faria, D.R. (2018). A study on CNN transfer learning for image classification. In UK Workshop on Computational Intelligence, pp. 191-202. https://doi.org/10.1007/978-3-319-97982-3_16
[19] Yosinski, J., Clune, J., Bengio, Y., Lipson, H. (2014). How transferable are features in deep neural networks? arXiv preprint arXiv:1411.1792.
[20] Russakovsky, O., Deng, J., Su, H., Krause, J., Satheesh, S., Ma, S. (2015). ImageNet large scale visual recognition challenge. International Journal of Computer Vision, 115(3): 211-252. https://doi.org/10.1007/s11263-015-0816-y
[21] Bora, A., Balasubramanian, S., Babenko, B., Virmani, S., Venugopalan, S., Mitani, A. (2021). Predicting the risk of developing diabetic retinopathy using deep learning. The Lancet Digital Health, 3(1): e10-e19. https://doi.org/https://doi.org/10.1016/S2589-7500(20)30250-8
[22] Reddy, A.S.B., Juliet, D.S. (2019). Transfer learning with ResNet-50 for malaria cell-image classification. In 2019 International Conference on Communication and Signal Processing (ICCSP), pp. 0945-0949. https://doi.org/10.1109/ICCSP.2019.8697909
[23] Zhang, Z. (2018). Improved Adam optimizer for deep neural networks. In 2018 IEEE/ACM 26th International Symposium on Quality of Service (IWQoS), pp. 1-2. https://doi.org/10.1109/IWQoS.2018.8624183
[24] Harshitha, C., Asha, A., Pushkala, J.L.S., Anogini, R.N.S., Karthikeyan, C. (2021). Predicting the stages of diabetic retinopathy using deep learning. In 2021 6th International Conference on Inventive Computation Technologies (ICICT), pp. 1-6. https://doi.org/10.1109/ICICT50816.2021.9358801
[25] Porwal, P., Pachade, S., Kamble, R., Kokare, M., Deshmukh, G., Sahasrabuddhe, V., Meriaudeau, F. (2018). Indian diabetic retinopathy image dataset (IDRiD): A database for diabetic retinopathy screening research. Data, 3(3): 25. https://doi.org/10.3390/data3030025
[26] He, X., Zhou, Y., Wang, B., Cui, S., Shao, L. (2019). Dme-net: Diabetic macular edema grading by auxiliary task learning. In International Conference on Medical Image Computing and Computer-Assisted Intervention, pp. 788-796. https://doi.org/10.1007/978-3-030-32239-7_87
[27] Porwal, P., Pachade, S., Kokare, M., et al. (2020) IDRiD: Diabetic retinopathy – segmentation and grading challenge. Med Image Anal, 59: 101561. https://doi.org/10.1016/j.media.2019.101561
[28] Decenciere, E., Cazuguel, G., Zhang, X., Thibault, G., Klein, J.C., Meyer, F. (2013). TeleOphta: Machine learning and image processing methods for teleophthalmology. IRBM, 34(2): 196-203. https://doi.org/10.1016/j.irbm.2013.01.010
[29] Giancardo, L., Meriaudeau, F., Karnowski, T.P., Li, Y., Garg, S., Tobin Jr, K.W., Chaum, E. (2012). Exudate-based diabetic macular edema detection in fundus images using publicly available datasets. Medical Image Analysis, 16(1): 216-226. https://doi.org/10.1016/j.media.2011.07.004