Giovanni Ciampi | Yorgos Spanodimitriou* | Niloufar Mokhtari | Michelangelo Scorpio | Antonio Rosato | Manuela Almeida | Sergio Sibilio
OPEN ACCESS
In this paper, the energy and environmental impacts of a passive retrofit action, involving the installation, on an office building, of a second-skin system with the external layer made of a PVC-coated polyester fabric, were evaluated in terms of primary energy saving and carbon dioxide equivalent emissions. The primary energy consumption and the carbon dioxide equivalent emissions associated with the considered case studies were evaluated through the dynamic simulation software TRNSYS, across a whole year. The study was carried out considering five cities (Athens, Barcelona, Lisbon, Marseille and Naples) in five different countries in southern Europe upon varying the orientation of the two main façades of building (north-south and east-west orientation were considered). The office building was modeled in detail considering different construction characteristics upon varying the country. The simulation results highlight that the best results in terms of PES (equal to 22.4%) in Naples, while the best results in terms of CO2 (equal to 32.0 MgCO2,eq) were obtained when the building is located in Athens. In addition, the adoption of the proposed passive lightweight retrofit solution allowed the reduction of both cooling and thermal yearly energy demand up to 57.7% (Marseille) and 17.8% (Barcelona), respectively.
tensile façade, building energy efficiency, second-skin façade, primary energy saving, TRNSYS
Nowadays, the building sector represents about 40% of the global energy consumption and about one-third of global greenhouse gases (GHG) emissions [1]. The European Union (EU) has set itself targets to progressively reduce its greenhouse gas emissions by 2050 [2]. Moreover, the vast majority of the existing non-residential EU building stock has been built before 1990 and almost the 55% of this stock has yet to be renovated [3, 4]; the problem is especially emphasized in the southern European area, where the combination of a hot summer climate, future increasing trends, and the probability of heatwaves strongly affects the indoor/outdoor comfort and the overall energy consumption [5]. This geographical scenario is characterized by old building stock with poor energy efficiency due to deterioration of the building components during the time or backwardness in the constructions’ standards over the decades (i.e. thermal transmittance of the envelope, the efficiency of the energy systems, etc.) [3, 4, 6]. Therefore, the reduction of the energy consumption in such buildings has been one of the main topics in the policies issued by the EU for the building sector [7, 8], effectively scheduling for the member states a set of goals for the renovation of these assets. In this context, these EU Directives have been developed to introduce several requirements for new and existent buildings. Accordingly, researchers and designers should optimize all possible aspects (heating and cooling system, regulation criteria, building envelope, shadowing components, etc.). Different products and systems have been studies to investigate the improvement of the buildings' energy efficiency in southern European countries. Several parameters are involved in the buildings’ energy consumption, such as external conditions, the characteristics of the envelope and the behavior of the occupants. The analysis of a building’s energy performance requires substantial input data describing detailed constructions, environmental conditions, thermo-physical properties, building geometry, and control strategies [9].
A recent research [10] suggests that the annual energy consumption of an office in Greece could be reduced by 33% as a result of changing envelope components features, like cooling set-point, natural ventilation strategies, glazing g-value and window-to-wall ratio. In France [11], a single-family house (built before 1974) was simulated through retrofit parameters, namely: ventilation, window glazing type, wall insulation, loft insulation, ground slab and infiltration, which lead to significant energy saving as well as cost reduction. An innovative design was considered in Spain [12] for retrofitting approach that makes the façade as an active element to dehumidify the ventilation air before entering the indoor environment and leads to lower energy consumption in both Mediterranean and Subtropical climates. In [13], the authors have presented retrofitting facades by applying solar passive technologies in Portugal that lead to improve the thermal comfort, more energy saving and lower greenhouse gas emissions. Finally, a comprehensive approach to optimizing the energy design of building envelopes in Italy [14] indicated the energy performance increase, economic benefits and thermal comfort simultaneously.
In general, the improvement of the energy performances of old existing buildings could be carried out by means of active and passive refurbishment actions [15]. Active actions include the installation of renewable energy generation technologies (i.e. PV systems), the replacement or redesign of the heating/cooling systems or the installation of different HVAC technologies. Passive actions, conversely, aim either to better managing the thermal gains and the energy losses of the building, or to increase the use of natural heating, cooling and lighting. Intuitively, the building envelope plays a key role in the effectiveness of passive actions. Among the different passive refurbishment actions that are possible to implement on existing buildings, the ventilated façade systems, and, in general, the Second-Skin systems (SS systems), seems to offer a good compromise in terms of ease of installation, performance and cost effectiveness [16]. The SS systems consists of an additional second skin layer hanged on the surface of the external building wall, with an air cavity in-between. Consequently, thanks to their simple structure, the SS systems are well suited adopt new materials as SS layer. Among these, the most interesting ones seem to be tensile and membrane-like materials, due to their lightweight and flexible nature [17]. Based on their characteristics, they are well-suited for both new and existing buildings, providing for thermal comfort through passive cooling/heating and thus reducing the energy consumption and the GHG emissions.
In recent years, different numerical models have been developed and tested by means of dedicated building simulation software as TRNSYS, DOE-2, BLAST, Energy Plus, and SPARK. However, the buildings’ energy performances are commonly evaluated through steady-state models [9].
In this work, the assessment of the energy and environmental impacts of a passive retrofit action on an existing office building, in terms of reduction of primary energy consumption and carbon dioxide equivalent emissions, were carried out using the dynamic simulation software TRNSYS [18], across a whole year. The refurbishment action involves the installation of a SS system, in which the external layer is made of a light and flexible PVC-coated polyester fabric, on the whole building. The study has been carried out considering five cities in five different countries in the Mediterranean biogeographical region (Greece, Spain, Portugal, France and Italy), and varying the orientation of the building. Moreover, different construction characteristics have been considered for each country: the reference buildings’ envelopes were characterized according to each country building stock context, while the refurbishment models were built according to the legal energy requirements of five different EU countries and based on their national standard for the existing building energy performances.
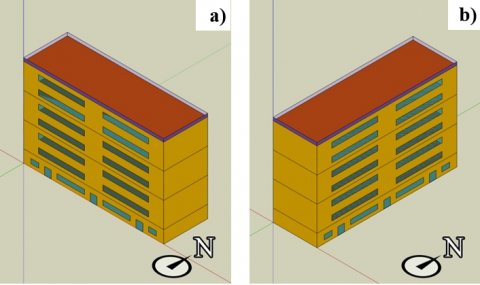
The study is focused on an office building and it is aimed at both proposing a general operational methodology and highlighting a best practice for retrofit actions in the Southern European territorial context. The software TRNSYS 18 has been used to evaluate the potential benefit achievable in an office building refurbishment using a PVC-coated polyester fabric as material in a SS system in terms of primary energy saving and reduction of carbon dioxide equivalent emissions. The reference building investigated in this research has been modeled in SketchUp 3D-modeling software on the basis of a “typical” office building from the IEA Annex 27 activity [19]. It consists of seven floors, each with a floor area of 661 m2 and 4.13 m height. The building has been simulated considering two different orientations for the two main façades, north-south (Figure 1a) and east-west (Figure 1b).
Figure 1. Axonometric view of the building model in two different orientations: a) north-south and b) east-west
The windows were implemented only on the two main façades considering different Windows-to-Wall Ratio (WWR) as suggested by [20], and reported in Table 1.
Table 1. WWR for the two main façades upon varying the building orientation
|
North-south orientation |
East-west orientation |
||
|
North façade |
South façade |
East façade |
West façade |
|
0.37 |
0.27 |
0.33 |
0.34 |
The geometrical model has been then imported in TRNSYS in order to characterize the envelope, the internal gains, the infiltration rate and the set point for the cooling and heating systems. The study was carried out in five cities located in five different countries in the Mediterranean biogeographical region [21]:
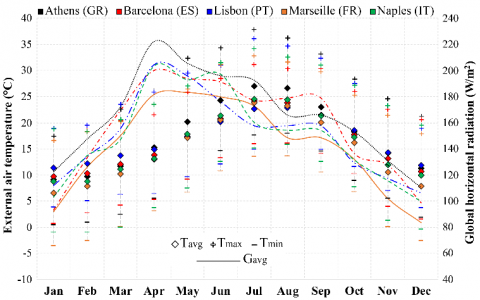
The monthly trends of the external air temperatures and average global horizontal radiation have been compared upon varying the different locations. Figure 2 reports the minimum, average and maximum outside temperature (Tmin/Tavg/Tmax) as well as the average global horizontal solar radiation (Gavg) of the five considered cities. This figure shows that: (i) the lowest value of Tmin is achieved in Marseille (-3.2℃), while the highest value of Tmax is achieved in Athens (37.9℃), (ii) the highest value of Gavg is achieved in Athens (165.6 W/m2) while the lowest one is achieved in Marseille (141.8 W/m2).
The envelope has been characterized differently in terms of thermal transmittance (U-value) of both opaque and transparent surfaces for each location. [22] provided an insight on the characteristics of the envelope of the European office buildings in different decades. The U-values implemented in this study are related to the 1980-1990 decade, which, as reported by [4], is the period when most of the non-residential European buildings were built, thus requiring a refurbishment. Table 2 summarizes the implemented U-values.
Figure 2. Values of Tmin/Tavg/Tmax and Gavg upon varying the month of the year and the city
Table 2. U-values of the office buildings for each location
|
Location |
Surface |
U-value (W/m2K) |
|
Athens (GR) |
Vertical Walls |
0.80 |
|
Roof |
0.70 |
|
|
Floor |
0.70 |
|
|
Windows |
3.70 |
|
|
Barcelona (ES) |
Vertical Walls |
1.80 |
|
Roof |
1.00 |
|
|
Floor |
2.00 |
|
|
Windows |
3.30 |
|
|
Lisbon (PT) |
Vertical Walls |
1.50 |
|
Roof |
2.70 |
|
|
Floor |
2.00 |
|
|
Windows |
4.40 |
|
|
Marseille (FR) |
Vertical Walls |
1.20 |
|
Roof |
0.80 |
|
|
Floor |
1.00 |
|
|
Windows |
3.40 |
|
|
Naples (IT) |
Vertical Walls |
0.80 |
|
Roof |
0.80 |
|
|
Floor |
0.50 |
|
|
Windows |
4.20 |
In TRNSYS, the reference building has been simulated though Type 56. Table 3 reports the common simulation parameters [20, 23-25]. In addition, a specific EnergyPlus weather data file [26] is considered to simulate the weather conditions of each city. In order to guarantee a comfortable indoor air temperature (see Table 3) two commercial parallel-connected electric heat pump (EHP) devices for each flat, coupled with a multi-split type air conditioning system, have been used to supply the heating and the cooling energy required by the offices [25].
In the refurbishment cases, a SS system (consisting of the SS external layer, a 10cm deep air cavity and an insulation layer on the external surface of the existing exterior wall) integrating the PVC fabric as external layer, has been implemented on the whole reference building, in both orientations, while the other surfaces have been left as in the original reference cases.
The SS system has been implemented in TRNSYS through the Type 1230 [27], following the same methodology that the authors presented and experimentally validated in [16]. The comparison between the experimental and the numerical data showed good reliability of this numerical model, with an RMSE of 0.5℃ and 0.4℃ for the indoor air temperature and the temperature of the air cavity, respectively [16].
Table 3. Summary of the simulations’ parameters
|
Parameter |
Detail |
Value |
|
Infiltration |
Air changes per hour |
0.6 h-1 |
|
Occupancy |
Workhours |
8:00 – 17:00 |
|
Heating system |
Workhours set point |
20℃ |
|
Night-time set point |
15℃ |
|
|
Operation period |
16 Nov/30 Mar |
|
|
COP |
2.67 |
|
|
Cooling system |
Workhours set point |
26℃ |
|
Night-time set point |
29℃ |
|
|
Operation period |
1 Apr/15 Nov |
|
|
EER |
2.41 |
|
|
Lighting system |
During workhours |
7.5 W/m2 |
|
During night-time |
0.0 W/m2 |
|
|
Equipment |
During workhours |
10.0 W/m2 |
|
During night-time |
1.0 W/m2 |
|
|
People |
During workhours |
11.5 W/m2 |
Table 4. Summary of the case studies for each location
|
Location and climatic zone |
Case study |
sEPS (m) |
Walls U-value (W/m2K) |
|
Athens, Zone B [28] |
Case 0_AT & Case 1_AT |
- |
0.80 |
|
Case 0R_AT & Case 1R_AT |
0.025 |
0.50 |
|
|
Barcelona, Zone C2 [29] |
Case 0_BA & Case 1_BA |
- |
1.80 |
|
Case 0R_BA & Case 1R_BA |
0.055 |
0.49 |
|
|
Lisbon, Zone I1/V2 [30] |
Case 0_LI & Case 1_LI |
- |
1.50 |
|
Case 0R_LI & Case 1R_LI |
0.048 |
0.50 |
|
|
Marseille, Zone H3 [31] |
Case 0_MA & Case 1_MA |
- |
1.20 |
|
Case 0R_MA & Case 1R_MA |
0.062 |
0.40 |
|
|
Naples, Zone C [32] |
Case 0_NA & Case 1_NA |
- |
0.80 |
|
Case 0R_NA & Case 1R_NA |
0.056 |
0.36 |
The insulation layer (Expanded PolyStyrene - EPS, l= 0.041 W/mK) has been set differently upon varying location, in order to reach the U-value thresholds highlighted by the legislation on the performance of the building envelope of each country. Table 4 reports a summary of the insulation layer thickness (sEPS) and the U-values of the refurbished external vertical walls, upon varying the simulation cases.
Finally, in order to take advantage of the characteristics of the polyester fabric, which allow to see-through, the SS external layer has been placed on the whole façade, including the windows; the polyester fabric portions installed in front of the windows are operated in order to manage the solar gains across the year, keeping them closed during the summer, while opening them during the winter. Also, the shutters at the inlet and the outlet of the air cavity are operated in order to keep the cavity open during the summer, to maximize the ventilation through the cavity, and closed during the winter to maximize the second-skin efficiency.
In this section the methodology used to compare the proposed cases has been compared with the reference cases from energy and environmental points of view.
The energy comparison between the proposed case (PC) and the reference case (RC) has been performed considering the primary energy consumption through the index PES (Primary Energy Saving) [16, 33]:
$P E S=\left[\left(E_{p}^{R C}-E_{p}^{P C}\right) / E_{p}^{R C}\right] \cdot 100$ (1)
where, $E_{p}^{R C}$ is the primary energy associated with the reference cases (Cases 0 and 1 see Table 4), while $E_{p}^{P C}$ is the primary energy associated with each of the proposed cases (Cases 0R and 1R, see Table 4). A positive value of the index PES indicates that the proposed refurbishment actions allow for a primary energy reduction in comparison to the reference case.
The values of the $E_{p}^{R C}$ and $E_{p}^{P C}$ are calculated as reported below:
$\begin{aligned}
&E_{p}^{R C}= \\
&\left(\frac{E_{t h}^{R C}}{C O P}+\frac{E_{c o o l}^{R C}}{E E R}+E_{e l, \text { equipment }}+E_{e l, \text { lighting }}\right) / \eta_{P P}
\end{aligned}$ (2)
$\begin{aligned}
&E_{p}^{P C}= \\
&\left(\frac{E_{t h}^{P C}}{C O P}+\frac{E_{c o o l}^{P C}}{E E R}+E_{e l, \text { equipment }}+E_{\text {el,lighting }}\right) / \eta_{P P}
\end{aligned}$ (3)
where, $\eta_{P P}$ is the power plants' average efficiency.
A different value of $\eta_{P P}$ for each location is assumed according to [33, 34].
The environmental comparison between the proposed case (PC) and the reference case (RC) has been performed considering the reduction of carbon dioxide equivalent emission ($\Delta$CO2) [16, 33]:
$\Delta C O_{2}=m_{C O_{2, e q}}^{R C}-m_{C O_{2, e q}}^{P C}$ (4)
where, $m_{C O 2, e q}^{R C}$ is the mass of the dioxide equivalent emission associated with the reference cases (Cases 0 and 1 see Table 4, while $m_{C O 2, e q}^{P C}$ is the one associated with each of the five proposed cases (Cases 0R and 1R, see Table 4). A positive value of $\Delta$CO2 indicates that the proposed refurbishment actions reduce the carbon dioxide equivalent emission with respect to the reference case.
The values of the $m_{C O 2, e q}^{R C} \text { and } m_{C O 2, e q}^{P C}$ are calculated as reported below:
$\begin{aligned}
&m_{C O_{2, e q}}^{R C}= \\
&\alpha \cdot\left(\frac{E_{t h}^{R C}}{C O P}+\frac{E_{c o o l}^{R C}}{E E R}+E_{e l, \text { equipment }}+E_{e l, l i g h t i n g}\right)
\end{aligned}$ (5)
$\begin{aligned}
&m_{C O_{2, e q}}^{P C}= \\
&\alpha \cdot\left(\frac{E_{t h}^{P C}}{C O P}+\frac{E_{c o o l}^{P C}}{E E R}+E_{e l, \text { equipment }}+E_{\text {el,lighting }}\right)
\end{aligned}$ (6)
where a is the CO2 equivalent emission factor for electricity production. Five different values of a are assumed according to [35]. Table 5 reports the values of $\eta_{P P}$ and $\alpha$ for each location [33-35].
Table 5. Values of $\eta_{P P}$ and a considered for each location
|
City |
$\eta_{P P}$ (-) |
$\alpha$ (kgCO2,eq/kWhel) |
|
Athens (GR) |
0.425 |
0.54901 |
|
Barcelona (ES) |
0.376 |
0.22026 |
|
Lisbon (PT) |
0.410 |
0.25255 |
|
Marseille (FR) |
0.601 |
0.03895 |
|
Naples (IT) |
0.465 |
0.33854 |
This table highlights that the values of $\eta_{P P}$ range from a minimum equal to 0.376 (Marseille) to a maximum value of 0.601 (Marseille), while the values of $\alpha$ vary between 0.03895 kgCO2,eq/kWhel and specific 0.54901 kgCO2,eq/kWhel for Marseille and Athens, respectively.
This section reports the simulation results; in particular, those related to the heating and cooling energy demands associated with the whole building as well as the primary energy saving and the reduction of carbon dioxide equivalent emission have been discussed in detail.
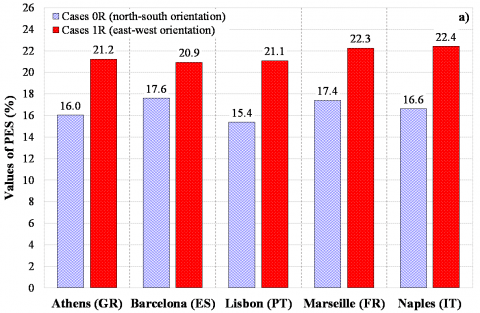
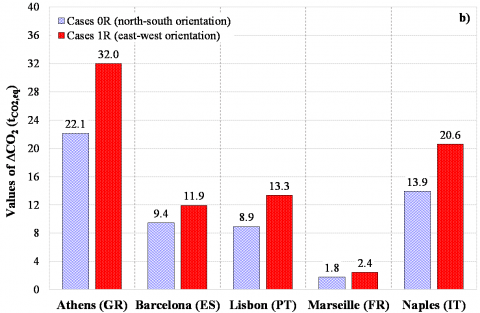
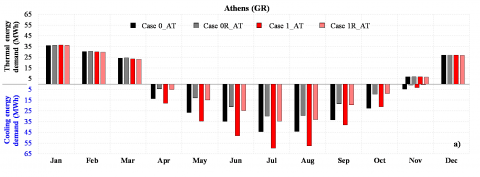
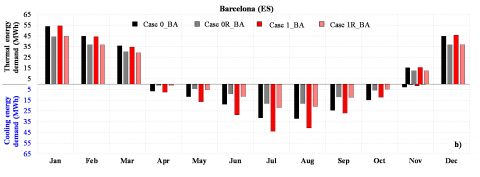
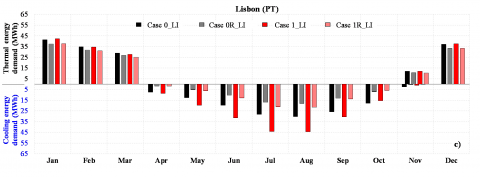
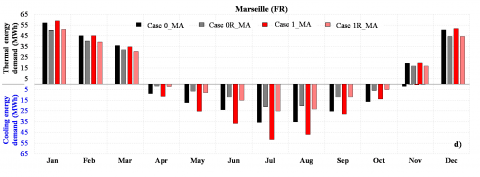
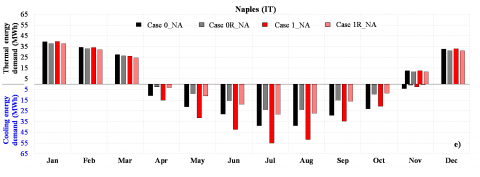
Figures 3a and 3b show the values of PES (Eq. (1)) and $\Delta$CO2 (Eq. (4)) upon varying the refurbishment case and the location. Figures 4a-e report the thermal and cooling energy flows associated with the whole office building as a function of the refurbishment case and month of the year for each location. In particular, in Figures 4a-e both thermal and cooling energy flows associated to the simulation cases with the main façades of the building oriented north-south are reported in black, while the energy flows associated to the simulation cases with the main façades of the building oriented east-west are reported in red.
Table 6 reports both the specific cooling and thermal energy yearly demand associated with the whole office building upon varying the location and the case study.
The results reported in Figures 3 and 4, as well as Table 6 highlight that:
Figure 3. Values of a) PES and b) $\Delta$CO2 varying the location
Figure 4. Energy flows upon varying the location: a) Athens, b) Barcelona, c) Lisbon, d) Marseille and e) Naples
Table 6. Annual specific cooling and thermal energy demand associated to the whole office building upon varying the case study
|
|
Cooling energy demand for space cooling (kWh/m2/year) |
Thermal energy demand for space heating (kWh/m2/year) |
||||||||
|
Case Study |
Athens |
Barcelona |
Lisbon |
Marseille |
Naples |
Athens |
Barcelona |
Lisbon |
Marseille |
Naples |
|
Case 0 |
48.6 |
30.9 |
31.3 |
36.0 |
42.1 |
26.8 |
42.0 |
33.3 |
45.0 |
31.5 |
|
Case 1 |
60.7 |
38.6 |
42.4 |
46.5 |
54.9 |
26.6 |
42.0 |
33.3 |
45.5 |
31.3 |
|
Case 0R |
27.5 |
15.1 |
15.8 |
17.3 |
21.9 |
26.9 |
34.7 |
30.1 |
39.7 |
30.3 |
|
Case 1R |
30.7 |
17.1 |
18.1 |
19.7 |
24.9 |
26.4 |
34.5 |
29.7 |
39.3 |
29.5 |
In this paper, the impacts of a passive retrofit action, involving the installation, on an office building, of a second-skin system with the external layer made of a PVC-coated polyester fabric, were evaluated in terms of primary energy saving and carbon dioxide equivalent emissions upon varying both weather conditions (Athens, Barcelona, Lisbon, Marseille and Naples were considered) and orientation of the two main façades of the building (north-south and east-west orientation were considered). The simulation results highlight that the best results in terms of PES and were achieved when the building is east-west oriented. In particular, the simulation returned the maximum value of PES (equal to 22.4%) for the Case 1R_NA, while the best results in terms of $\Delta$ CO2 (equal to 32.0 MgCO2,eq) were obtained when the building is located in Athens (Case 1R_AT). In addition, the adoption of the proposed passive lightweight and non-impacting retrofit solution allowed the reduction of both cooling and thermal yearly energy demand up to 57.7% (Case 1R_MA) and 17.8% (Case 1R_BA), respectively.
The authors would like to thank the European Union-PON for Research & Innovation 2014–2020.
|
COP |
Coefficient of performance (-) |
|
E |
Energy (kWh) |
|
EER |
Energy efficiency ratio (-) |
|
EPS |
Expanded Polystyrene |
|
G |
Global horizontal radiation (W/m2) |
|
GHG |
Greenhouse gases |
|
m |
Mass |
|
PC |
Proposed case |
|
PES |
Primary Energy Saving (%) |
|
RC |
Reference case |
|
RMSE |
Root Mean Square Error (°C) |
|
s |
Thickness |
|
SS |
Second-Skin |
|
T |
Temperature (°C) |
|
U-value |
Thermal transmittance (W/m2K) |
|
WWR |
Windows-to-Wall Ratio (-) |
|
Greek symbols |
|
|
$\alpha$ |
CO2 equivalent emission factor for the electricity production (kgCO2,eq/kWhel) |
|
$\Delta$ |
Difference |
|
$\eta$ |
Efficiency (%) |
|
$\lambda$ |
Thermal conductivity (W/mK) |
|
Subscripts |
|
|
avg |
Average |
|
CO2,eq |
Carbon dioxide equivalent emission |
|
el |
Electricity |
|
p |
Primary energy |
|
PP |
Power plant |
|
th |
thermal |
|
Superscripts |
|
|
PC |
Proposed case |
|
RC |
Reference case |
[1] Energy performance of buildings, Directive (EU) 2018/844, 2018.
[2] Climate strategies & targets. Available: https://ec.europa.eu/clima/policies/strategies_en.
[3] Boermans, T., Bettgenhäuser, K., Offermann, M., Schimschar, S. (2012). Building renovation in Europe - what are the choices? ECOFYS Germany GmbH, Köln, proj. n. PSTRDE102164, Jun. 2012.
[4] Schimschar, S., Grözinger, J., Korte, H., Boermans, T., Lilova, V., Bhar, R. (2011). Panorama of the European non-residential construction sector. ECOFYS, Report to European Copper Institute.
[5] Cantatore, E., Fatiguso, F. (2021). An energy-resilient retrofit methodology to climate change for historic districts. Application in the Mediterranean Area. Sustainability, 13(3): 1422. https://doi.org/10.3390/su13031422
[6] Cho, K.H., Kim, S.S. (2019). Energy performance assessment according to data acquisition levels of existing buildings. Energies, 12(6): 1149. https://doi.org/10.3390/en12061149
[7] Energy performance of buildings, Directive 2002/91/EC, 2002.
[8] Amending Directive 2012/27/EU on Energy Efficiency, Directive (EU) 2018/2002, 2018.
[9] Ciulla, G., Brano, V.L., D'Amico, A. (2016). Modelling relationship among energy demand, climate and office building features: A cluster analysis at European level. Applied Energy, 183: 1021-1034. https://doi.org/10.1016/j.apenergy.2016.09.046
[10] Giouri, E. D., Tenpierik, M., Turrin, M. (2020). Zero energy potential of a high-rise office building in a Mediterranean climate: Using multi-objective optimization to understand the impact of design decisions towards zero-energy high-rise buildings. Energy and Buildings, 209: 109666. https://doi.org/10.1016/j.enbuild.2019.109666
[11] Foda, E., El-Hamalawi, A., Le Dréau, J. (2020). Computational analysis of energy and cost efficient retrofitting measures for the French house. Building and Environment, 175: 106792. https://doi.org/10.1016/j.buildenv.2020.106792
[12] Hernández, F.F., Navarro, J.P.J., Atienza-Márquez, A., López, J.M.C., Andrés, A.C. (2020). An experimental and numerical model of a desiccant façade. A case of study of an office building in different weather conditions. Energy and Buildings, 224: 110255. https://doi.org/10.1016/j.enbuild.2020.110255
[13] Brito-Coimbra, S., Aelenei, D., Gloria Gomes, M., Moret Rodrigues, A. (2021). Building façade retrofit with solar passive technologies: A literature review. Energies, 14(6): 1774. https://doi.org/10.3390/en14061774
[14] Ascione, F., Bianco, N., Mauro, G.M., Napolitano, D.F. (2019). Building envelope design: Multi-objective optimization to minimize energy consumption, global cost and thermal discomfort. Application to different Italian climatic zones. Energy, 174: 359-374. https://doi.org/10.1016/j.energy.2019.02.182
[15] Chen, X., Qu, K., Calautit, J., Ekambaram, A., Lu, W., Fox, C., Gan, G., Riffat, S. (2020). Multi-criteria assessment approach for a residential building retrofit in Norway. Energy and Buildings, 215: 109668. https://doi.org/10.1016/j.enbuild.2019.109668
[16] Ciampi, G., Spanodimitriou, Y., Scorpio, M., Rosato, A., Sibilio, S. (2021). Energy performance of PVC-Coated polyester fabric as novel material for the building envelope: Model validation and a refurbishment case study. Journal of Building Engineering, 41: 102437. https://doi.org/10.1016/j.jobe.2021.102437
[17] Chiu, S.K., Lin, E.S. (2015). Tensile membrane façade: Performance analysis of energy, daylighting and material optical properties. In 10th Conference on Advanced Building Skins, Bern, Switzerland.
[18] Thermal Energy System Specialists, Transient System Simulation Tool - TRNSYS 18.
[19] Köhl, M. (2006). Performance, durability and sustainability of advanced windows and solar components for building envelopes, IEA-Task 27 “Solar Building Facade Components”, Freiburg, Germany, Final report 2006.
[20] Goia, F. (2016). Search for the optimal window-to-wall ratio in office buildings in different European climates and the implications on total energy saving potential. Solar Energy, 132: 467-492. https://doi.org/10.1016/j.solener.2016.03.031
[21] The Mediterranean Region. Available: https://ec.europa.eu/environment/nature/natura2000/biogeog_regions/mediterranean/index_en.htm.
[22] Birchall, S., Wallis, I., Churcher, D., Pezzutto, S., Fedrizzi, R., Causse, E. (2014). Survey on the energy needs and architectural features of the EU building stock. Development of Systemic Packages for Deep Energy Renovation of Residential and Tertiary Buildings including Envelope and Systems, Report D2.1a.
[23] Energy Performance of Buildings Part 1: Evaluation of Energy Need for Space Heating and Cooling, UNI/TS 11300-1, 2014.
[24] Heating Systems in Buildings – Method for Calculation of the Design Heat Load, EN 12831, 2017.
[25] G.I. Industrial Holding, Technical Brochure - CRA/K 15÷131.
[26] EnergyPlus - Weather data. Available: http://apps1.eere.energy.gov/buildings/energyplus/.
[27] Thermal Energy System Specialists, TESS Individual Components - TYPE 1230: Ventilated air cavity wall (Ventilated Facade).
[28] Αναλυτικεσ εθνικεσ προδιαγραφεσ παραμετρων για τον υπολογισμο τησ ενεργειακησ αποδοσησ κτηριων και την εκδοση του πιστοποιητικου ενεργειακησ αποδοσησ, Τ.Ο.Τ.Ε.Ε. 20701-1/2017, 2017.
[29] Documento Básico HE Ahorro de energía, DB-HE 2019, 2019.
[30] Portaria n.° 379-A/2015 - Primeira alteração à Portaria n.° 349-B/2013, 379-A/2015, 2015.
[31] Arrêté du 22 mars 2017 modifiant l’arrêté du 3 mai 2007 relatif aux caractéristiques thermiques et à la performance énergétique des bâtiments existants, LHAL1614615A, 2017.
[32] Adeguamento linee guida nazionali per la certificazione energetica degli edifici, Decreto interministeriale 26 giugno 2015, 2015.
[33] Roselli, C., Marrasso, E., Tariello, F., Sasso, M. (2020). How different power grid efficiency scenarios affect the energy and environmental feasibility of a polygeneration system. Energy, 201: 117576. https://doi.org/10.1016/j.energy.2020.117576
[34] Efficiency of conventional thermal electricity and heat production in Europe. Available: https://www.eea.europa.eu/data-and-maps/indicators/ efficiency-of-conventional-thermal-electricity-generation-4/assessment-2.
[35] Country specific electricity grid greenhouse gas emission factors, Carbon Footprint Ltd, Basingstoke, Hampshire, Grid Electricity Emissions Factors v1.1, 2020.