Carla Balocco* | Gerardo Lorenzo Petrone
OPEN ACCESS
The pandemic COVID-19 era we are experiencing has changed our way of seeing, thinking and designing indoor and outdoor environments and, above all, plant systems and building-plant management. Energy environmental sustainability is a common fundamental target for buildings and plant systems, but health protection and prevention are the priority issues for the basis of any retrofitting and refurbishment operation. This question becomes even more complex if the building is historic and used for hospital or for healthcare facilities.
In this research we propose a methodological approach based on the combination of physical-real and “virtual”, i.e. measured and simulated information. The proposed method can be a useful tool for setting up continuous monitoring systems for microclimatic and ventilation conditions, user influx/presence and behaviour, real operation (on demand) of the plants and control/regulation system adjustment. Results show the importance of drawing up useful guidelines for training health workers and people/patient subjects, aiming at conscious interaction for health and wellbeing protection, but also better indoor environment management. This is particularly important for healthcare environments such as the one studied.
experimental monitoring, CFD, ventilation effectiveness, people health, historic hospital
It is well known that energy efficiency is a common task for buildings and related plant systems, but the issue concerning health risk prevention deriving from environmental and pollution factors, microorganism dispersion and environmental and surface contamination, has become a priority, so much so that it requires the involvement of different competent subjects and imposes an integrated interdisciplinary approach [1-7]. On the other hand, among stakeholders, researchers, technicians and public decision makers, awareness of the importance of indoor air quality (IAQ) for guaranteeing people's health and wellbeing is on the increase [8]. Crucial findings have been discussed by recent literature and research concerning experimental and simulated investigation on IAQ, effective ventilation, and occupant behaviour and satisfaction inside historic, existing and newly designed energy-efficient buildings. These studies highlighted the fact that low energy consumption, IAQ, efficiency and efficacy of different air flow patterns and behaviour and self-reported occupant wellbeing can be obtained by integrating solutions for building physics improvement and controlled mechanical ventilation systems [9-12]. Moreover, the current standards and provisions on IAQ, controlled mechanical ventilation, hygiene, health and prevention of contagion risks, imposed by international and national organizations (i.e. WHO, ASHRAE, RHEVA, AICARR and ISS), suggest that heating, ventilation and air conditioning plants (HVAC) must be working 24 hours a day and continuously 7 days a week, without air recirculation and possibly with night attenuation also provided for periods of environmental non-occupation [13-23]. As a consequence, controlled mechanical ventilation systems must be equipped with high air filtration systems without recirculation and with large air flows to be treated. Most of the literature on this subject shows how the IAQ and infection risks are closely related to the air flow field and specific air flow patterns, internal pressure regimes, indoor thermo-hygrometric conditions, air filtration systems, as well as the correct maintenance and cleaning of plants and their components [1, 11]. Therefore, plant adaptation, retrofitting and refurbishment design solutions for existing buildings and in some cases that are also historical and also subject to protection and conservation constraints, are very complex issues. Any intervention solution must find a compromise between energy saving, energy costs necessary to ensure ventilation effectiveness and air quality, health protection of people and cultural heritage objects. Physical distancing and the increase in natural ventilation, both with automatic and manual techniques, are not sufficient to ensure health protection and reduction of contagion and contamination risks.
In this research, a methodological approach based on the combination of physical-real and “virtual”, i.e. measured and simulated information, is developed. The proposed method can therefore be a useful tool for setting up continuous monitoring systems on microclimate and ventilation systems, on user influx/presence and his behaviour, on the real operation (on demand) of the plants and control systems and their adjustment/management. The results obtained show the importance of drawing up useful guidelines for subject (i.e. health workers and people/patients) training and orientation towards a conscious interaction for health protection and wellbeing, but also for better management of environmental quality, which is particularly important for healthcare ambient such as the one studied.
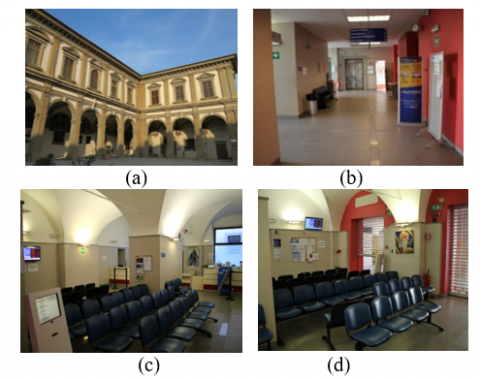
Santa Maria Nuova is the oldest hospital in Florence, the only one of the four city hospitals located in the historic centre. The testing centre, a portion of the historic building, defined as a space and public service - hospital complex, is the case study. It is classified in the Municipality Planning Regulation as an emergency of historical and architectural value, and subjected to the constraints of the city Department for listed buildings (Figure 1). The waiting room-testing centre has a volume of 409 m3 with vaulted ceilings, an average height of 3.82 m and an enveloping surface of very thick mixed masonry. From the external porch, two sliding doors, with glass and aluminium frames, lead on to the long corridor and waiting room. The latter has internal walls covered up to a height of 2.20 m by Gavatex-type fiberglass fabric, and double glazed windows (Visarm double glazing of 6 mm thickness), darkened with opal film, up to a height of 2.20 m, facing the only oriented South-West external side (Figure1). By means of analyses of evidence from historical information and literature, and all the data provided by the technical offices, it was possible to define internal and external wall stratigraphy: 3 cm external plaster - mixed type masonry of 78 cm thickness - 7 cm air gap - plasterboard double slab of 5 cm thickness with fiberglass fabric finishing. The floor consists of a crawl space in plastic cupolex placed on a 20 cm lean concrete, 5 cm thick concrete screed and 3 cm polyestyrene layer on which the radiant panels and its covering are laid. The air conditioning plant is integrated with a four-pipe radiant floor panel system. This operates with a delivery fluid temperature of 16℃ with return of 20℃ for summer operating conditions; and a delivery fluid temperature of 38℃ with return of 34℃ for winter operating conditions. The HVAC is a typical VAV with simple air flow system the operating conditions of which are fixed at 4 Vol/h air exchange. The air inlet operates from above, through micro-nozzle diffusers located above the sliding doors, at a maximum velocity of 0.10 m/s in winter and 0.15 m/s in summer. The total air flow rate of the two diffusers is 2240 m3/h. The air conditioning system of the corridor zone includes: two circular diffusers on the ceiling with a helical shape with high induction and adjustable cones in anodized aluminium. Each of these is positioned near the first and second sliding door and has an inlet air flow of 370 m3/h. Air extraction takes place on the corridor ceiling through two simple order extractors of fixed anodized aluminum fins, each of them with an air flow rate of 1690 m3/h. Furnishings is generally consist of laminate counter with four reception stations on the window-wall side and on the opposite side by 50 seats arranged in regular rows. The lighting system is provided by discharge lighting fixtures placed on the wall near the vault shutter.
Figure 1. Photo of S.M.Nuova Hospital: a) the façade with portico, texting centre side; b) the corridor; c) and d) internal view of the waiting room-texting centre
The experimental measurement campaign was carried out during a short time period due to access problems connected to this type of environment and all the limitations subsequently imposed by the COVID-19 pandemia, that we are still experiencing. The period is short but representative of a typical working week (from 12 March to 29 March 2019). A measurement protocol and experimental set-up were defined to obtain sequentiality, continuity and repetitiveness of the measurements, both in the waiting room and corridor. A time step of 5 minutes was fixed for data acquisition and recording. This fact allowed taking into account the influence of the sliding doors opening and closing and people passage.
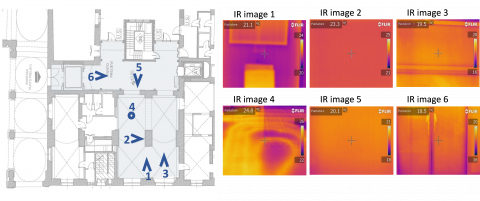
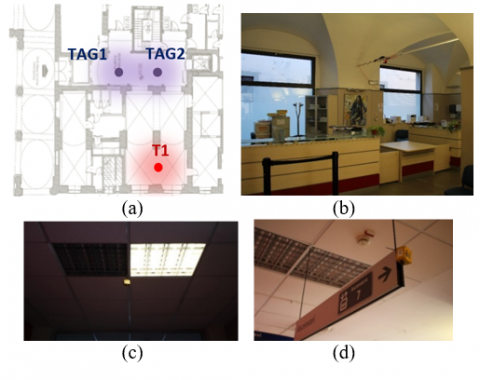
An initial investigation was carried out with a survey using an infrared FLIR camera. In Figure 2 some significant results of this investigation are shown. The main microclimatic parameters were measured: in the waiting room with a multifunction thermo-anemometer fixed to the reinforcement chain of the cross vault, so as not to hinder the activity carried out within the environment, and in a particular position that is not affected by the influence of the air supply diffusers and/or the sliding doors; in the corridor with two Tinytags positioned on the sign support and on the ceiling light grid. Figure 3 shows the instrument location and measuring points. Technical characteristics of the instruments used are given in Table 1.
Figure 2. FLIR infrared camera measurements: test areas (left) and the corresponding samples of IR images (right)
Figure 3. Instruments locations a) thermoanemometer (T1), tinytags (TAG1 and TAG2) in a plan view; b), c), d) respectively, photos: (T1), TAG1 and TAG2
Table 1. Technical characteristics of the used instruments
|
Flir T620 bx |
|
|
Imaging and optical data |
|
|
IR resolution |
640 × 480 pixels |
|
Thermal sensitivity/NETD |
<30 mK @ +30℃ (+86°F) |
|
Measurement |
|
|
Object temperature range |
–40℃ to +150℃ (–40°F to +302°F) +100℃ to +650℃ (+212°F to +1202°F) |
|
Accuracy |
±2℃ (±3.6°F) or 2%, whichever is greater, at 25°C (77°F) nominal. |
|
Measurement analysis |
|
|
Emissivity correction |
Variable from 0.01 to 1.0 or selected from materials list |
|
Tinytag TGP-4500 |
|
|
Temperature |
|
|
Reading Range |
-25℃ to +85℃ (-13°F to +185°F) |
|
Sensor Type |
10K NTC Thermistor (Internally mounted) |
|
Response Time |
25 mins to 90% FSD in moving air |
|
Reading Resolution |
0.01℃ or better |
|
Accuracy |
±0.5℃ between 0℃ & 40℃ |
|
Relative Humidity |
|
|
Reading Range |
0% to 100% RH |
|
Sensor Type |
Capacitive |
|
Accuracy |
±3.0% RH at 25℃ / 77°F |
|
Reading Resolution |
Better than 0.3% RH |
|
Sensor Location |
Externally mounted |
|
Response Time |
40 seconds to 90% FSD (current data loggers, from SN 613165) |
|
Airflow TA465 |
|
|
Velocity (TA Probe) |
|
|
Range |
0 to 9999 ft/min (0 to 50 m/s) |
|
Accuracy |
±3% of reading or ±3 ft/min (±0.015 m/s), whichever is greater |
|
Resolution |
1 ft/min (0.01 m/s) |
|
Temperature (TA Probe) |
|
|
Range |
14 to 140°F (-10 to 60℃) |
|
Accuracy |
±0.5°F (±0.3℃) |
|
Resolution |
0.1°F (0.1℃) |
|
Relative Humidity (TA Probe) |
|
|
Range |
5 to 95% RH |
|
Accuracy |
±3% RH |
|
Resolution |
0.1% RH |
|
Wet Bulb Temperature (TA Probe) |
|
|
Range |
40 to 140°F (5 to 60℃) |
|
Resolution |
0.1°F (0.1℃) |
|
Dew Point (TA Probe) |
|
|
Range |
5 to 120°F (-15 to 49℃) |
|
Resolution |
0.1°F (0.1℃) |
|
Logging Interval |
|
|
Intervals |
1 second to 1 hour |
3.1 Experimental results
In this section experimental results on the waiting room microclimate are analysed and discussed. Table 2 provides the analysis of the microclimatic parameters obtained during the monitoring campaign: measured data reability and accuracy can be noted. The mean air temperature in the corridors, but especially in the waiting room, as well as the air velocity value, agree with those suggested [13-24]. However, the relative humidity values are generally lower.
Table 2. Microclimatic parameters analysis
|
|
Air velocity (m/s) |
Air temp. (℃) |
Relative humidity (%) |
Wet-bulb air temp.(℃) |
Specific humidity (gv/ga.s) |
|
waiting room-thermo anemometer |
|
||||
|
mean |
0.057 |
23.67 |
27.74 |
13.06 |
5.128 |
|
max |
0.110 |
24.40 |
30.80 |
13.60 |
5.686 |
|
min |
0.020 |
23.00 |
24.70 |
12.70 |
4.669 |
|
median |
0.060 |
23.80 |
28.20 |
12.95 |
5.113 |
|
standard deviation |
0.014 |
0.316 |
1.598 |
0.266 |
0.265 |
|
corridor tinytag 1 |
|
||||
|
mean |
- |
21.93 |
31.45 |
- |
5.213 |
|
max |
- |
23.15 |
34.88 |
- |
5.848 |
|
min |
- |
21.49 |
28.90 |
- |
4.683 |
|
median |
- |
21.74 |
31.98 |
- |
5.279 |
|
standard deviation |
- |
0.430 |
1.706 |
- |
0.252 |
|
corridor tinytag 2 |
|
||||
|
mean |
- |
21.66 |
31.23 |
- |
5.095 |
|
max |
- |
22.18 |
36.70 |
- |
6.128 |
|
min |
- |
21.32 |
28.34 |
- |
4.531 |
|
median |
- |
21.54 |
31.33 |
- |
5.161 |
|
standard deviation |
- |
0.267 |
1.639 |
- |
0.290 |
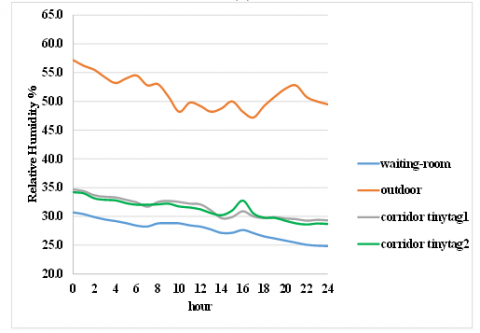
Figure 4 a, b shows the trends of the mean air temperature and relative humidity of the waiting room and corridor, in comparison with the corresponding trends of the air temperature and relative humidity in the external environment, during the coldest day of the monitoring campaign. It can be noted, especially during the central hours of the day, how the internal air temperature of the waiting room is affected by the mutual influence between people influx, door opening and closing phases, and higher values of the external air temperature.
In the corridor this value is always lower, both because this is a zone characterized by continuous people passage, and due to the greater influence of the sliding doors opening and closing.
An appreciable effect of thermal-buffer and humidity-damping of the corridor on the thermo-hygrometric conditions of the waiting room, compared to the external climatic conditions, is evident if the trend of the relative humidity values is taken into account (Figure 4 a, b).
(a)
(b)
Figure 4. Hourly data of the air temperature (a), the air relative humidity (b), measured in the waiting room and corridor in relation to the real data for the coldest day of the experimental campaign
Starting from the construction of a three-dimensional model of the environment studied, the dynamic energy analysis of the building-plant system carried out in compliance with the current standards [24, 25] was developed. These results provided the necessary input data for the CFD transient simulations developed for the coldest day of the monitoring campaign using the real external climatic data. Design-builder a well-known commercial software was used. The furnishings, all the chairs, reception desk, healthcare workers and people sitting were modelled. With reference to the real data on people influx and room usage time profiles, two basic conditions were defined: the first with a maximum number of 40 seated persons, and the second with a minimum of 7. In both cases, only two health workers were modelled. The condition of minimum presence of people was chosen as a limit and precautionary condition of quota admissions and physical distancing imposed by the pandemic context.
The total thermal load due to people sitting, clothing thermal resistance of 1 cloth [26, 27] and the CO2 emission of 0.012 m3/h were set as boundary conditions for all the persons (patients and sanitary workers [27]). Heat loads due to the lighting system and computers were taken into account [26, 27]. The thermo-physical characteristics of the walls, i.e. internal dividing walls, of the separating ones with the external environment, ceiling, floor and large windows, were implemented. Fixed and constant temperature conditions of the surrounding rooms, provided by the technical offices (i.e. typical offices with 20±2℃ indoor air temperature and 50% relative humidity) were assumed as boundary conditions for the walls and ceiling. Hourly variations of the external climatic parameters were set as the boundary conditions for the large glazed surfaces, facing South-West to the external environment. The HVAC with VAV system, combined with a four-pipe radiant floor panel system, and the connected regulation and control system were modelled. For the VAV, i.e. a typical simple air flow system in the waiting room, the external air flow rate was assumed to be 5700 m3/h with 4 vol/h air renewal. In particular, the air inlet diffusers, placed above the two sliding doors, were modelled, assuming a maximum air velocity of 0.10 m/s for winter with a total air flow rate of 2240 m3/h. For all the transient CFD simulations, a sufficiently dense and accurate computational mesh was used and all the parameters relating to convergence, were checked in relation to time and computational costs. The simulation model was calibrated and validated by means of the experimental data: standard deviation between all the measured and the corresponding calculated was 2.8%. Taking into account the standard deviation value and both the modelling simplifications as well as the quality/quantity of the received information (e.g. thermo-physical characteristics, plant set-point conditions, regulation and control systems, lighting systems, etc.) the model was found to be sufficiently reliable and robust.
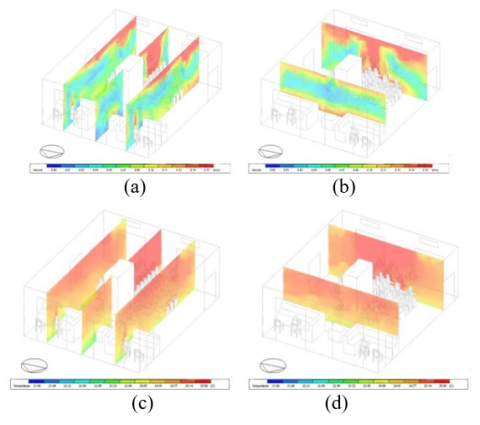
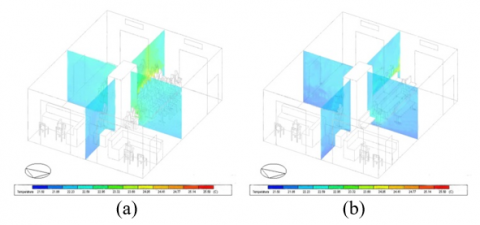
Figure 5. CFD simulation results for the max people presence condition: a), b) air velocity field at two different section planes; c), d) air temperature distribution at two different section planes
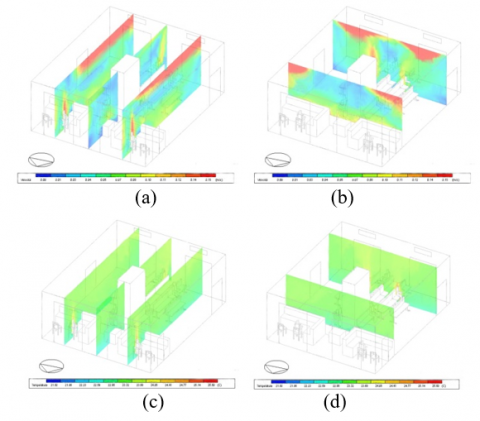
Figure 6. CFD simulation results for the min people presence condition: a), b) air velocity field at two different section planes; c), d) air temperature distribution at two different section planes
In this section, all the results obtained by transient CFD simulations for the characteristic day and for the two conditions of maximum and minimum people presence are analysed and discussed. Figures 5 and 6 show respectively the air velocity field on different section planes for the condition of maximum and minimum people presence: in the first condition, the effect of short-circuiting and partial air stagnation in the occupied zone can be noted.
This effect is absent for minimum people presence condition. In this last condition, the air velocity field is much more uniform throughout the volume of the environment with relatively higher velocity values near the ceiling, where the Coanda Effect, the shape of the jet and the effect of the launch length from the delivery diffusers, combined with the different temperature distributions, are particularly evident (Figures 5, 6).
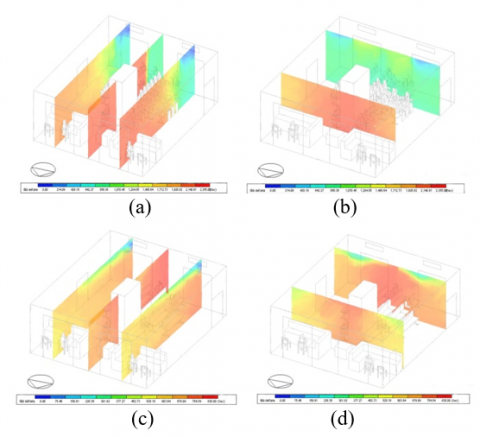
These effects can be noted in the distribution maps of the local average air age (LMA) (Figure 7). LMA is one of the most important parameters to evaluate the ventilation efficiency and/or contaminants removal and to quantify the average lifetime of air at a closed space for a steady airflow achieved. The local air age concept expresses the average time for air to travel from a supply inlet area to any location in a forced ventilated room: lower values are more favourable. At the inlet opening it was assumed to be zero (100% fresh). The average value of LMA was computed in the occupied zone at the two conditions of max and min people presence.
Figure 7. CFD simulation results. a), b) mean air age at two different section planes for the max people presence condition; c), d) mean air age at two different section planes for the min people presence condition
Comparison of these values with the theoretical residence time of air inside the room (i.e. the ratio between the total volume of the room and the mass flow rate of incoming ventilating air), provided the fundamentals for the Air Exchange Efficiency (AEE) index computation. In particular, applying a zonal method and referring to the LMA results obtained for the occupied zone, the AEE by means of the post-processing CFD results in the occupied zone was calculated as follows:
$A E E=\frac{(1 / A C H) \text { real }}{L M A_{\text {calculated }}}$ (1)
For the max and min people presence condition, the AEE obtained was respectively 0,768 and 1,326. This fact means that in the condition of max people presence with EEE <1 (i.e. 0.768) a partial short-circuit of the air with stagnation zones, happens, in particular, in the sitting zone. It can be noted that the air flow pattern in the total volume of the room is strongly conditioned by the subzones with inadequate and insufficient ventilation (Figure 7). Considering the air temperature distribution, it can be noted that for the max people presence condition, the values are on average higher, both in the total environment, and in the sitting zone, compared to those obtained for the min people presence condition (Figure 7). As expected, the zone near the double glazed wall, facing South-West, has lower air temperature values for both conditions. For people wellbeing evaluation, strictly connected to the air quality due to ventilation effectiveness, the Effective Draft Temperature (EDT) was calculated for both the max and min people presence conditions. By means of the CFD results post-processing for the sitting zone, the local average values of the air temperature and air velocity were calculated. Therefore, the following equation for EDT was used:
$E D T=\left(T_{i}-T_{a}\right)-0,8 *\left(v_{\text {mean }}-0,15\right)$ (2)
with Ti mean air temperature in the sub-volume/zone considered, Ta mean air temperature in the environment/total-volume (e.g. the HVAC system set-point value) and vmean mean air velocity in the considered sub-volume/zone.
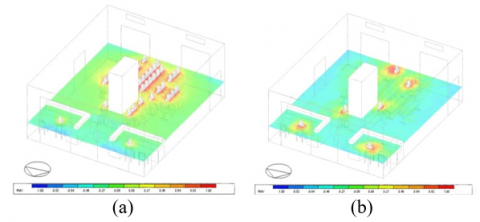
Figure 8. CFD simulation results. a) PMV at the max people presence condition; b) PMV at the min people presence condition
Figure 9. CFD simulation results. a) operative air temperature at the max people presence condition; b) operative air temperature at the min people presence condition
Usually, the optimal EDT value, which guarantees comfort conditions for people with poor metabolic activity and sessions, is in the range -1.7℃ and 1.1℃ [28, 29]. For the condition of max people presence, EDT was 0.98 and for the min people presence was -0.12. These results confirm those obtained by the VMP and PPD maps (Figure 8). Although the relative humidity is generally low (a condition imposed on the regulation and control system, as indicated by the technical office), the wellbeing conditions for the occupants are still guaranteed, as can be seen from the PMV and PPD distribution (Figure 8) and operative temperature distribution (Figure 9).
The zone around the large glazed surface shows local discomfort, as expected from the analysis of the building's thermo-physical behaviour. From result comparisons, it can be seen how the air motion field, temperature distribution and trend of the mean air age both for precautionary conditions of max people presence, and for the min people presence condition with physical distancing and limited entrances, the HVAC system guarantees air quality, good ventilation and comfortable conditions for occupants.
In particular, ventilation effectiveness and air washing are present in both conditions studied, but with better results for the min people presence condition.
Health, safety and wellness of people can be achieved with HVAC plant system designs finalised to IAQ, solutions based on demand ventilation regulation and control, airflow scheme effectiveness and correct air change rates [29, 30]. In addition, the HVAC system design must be based on demand, controlled mechanical ventilation and its correct management, because the air permeability of the building envelope and the natural ventilation due to manual window/door airing cannot ensure the correct and efficient air ventilation rate, contaminant dilution and/or removal [3].
Effective plant system management and control, for a special ambient just like the one studied, can be developed by means of a methodological approach based on the integration between the experimental/real measurements with the connected transient simulations.
Our research highlighted how the above findings are particularly complex but crucial and necessary when they must be designed for assuring health requirements, adapting the existing building-plant systems to the present pandemic context. The proposed methodological approach can be a fundamental tool for defining and developing continuous monitoring of environments and plant systems (e.g. microclimatic and biological monitoring, on the influx, presence and different user behaviours, on the actual functioning conditions and management of the plants and the connected control and regulation systems) that can be easily correlated and interfaced with DIGITAL TWIN simulation and modelling systems. The proposed method can be a useful support to identify basic guidelines for training concerning wellbeing, safety and security and health of workers and people and/or patients, towards a conscious interaction for the best management and protection/conservation of the indoor environmental quality. This is particularly mandatory for healthcare environments such as the one studied and also provides the key elements to stimulate effective participatory/training processes, supporting BIM techniques for facility management and maintenance, enhancing the ability to plan and implement intervention scenarios on critical elements, analysing and evaluating technologies/performance, IAQ & wellbeing, health & hygiene, energy and maintenance costs & management.
The authors thank: Eng. Luca Meucci, executive manager of the USL Toscana Centro; Antonio Croce expert technical office of S.M.Nuova Hospital; Dr. Luca Fibbi of the Centre LAMMA CNR IBIMET of Florence, for providing Florence climate data.
[1] Becchetti, L., Beccari, G., Conzo, G., Conzo, P., De Santis, D., Salustri, F. (2021). Air quality and COVID-19 adverse outcomes: Divergent views and experimental findings. Environmental Research, 193: 110556. https://doi.org/10.1016/j.envres.2020.110556
[2] Zhang, Y., He, M., Wu, S., Zhu, Y., Wang, S., Shima, M., Ma, L. (2015). Short-term effects of fine particulate matter and temperature on lung function among healthy college students in Wuhan, China. International Journal of Environmental Research and Public Health, 12(7): 7777-7793. https://doi.org/10.3390/ijerph120707777
[3] Sun, C., Zhai, Z. (2020). The efficacy of social distance and ventilation effectiveness in preventing COVID-19 transmission. Sustainable Cities and Society, 62: 102390. https://doi.org/10.1016/j.scs.2020.102390
[4] Dai, H., Zhao, B. (2020). Association of the infection probability of COVID-19 with ventilation rates in confined spaces. In Building Simulation, 13(6): 1321-1327. Tsinghua University Press. https://doi.org/10.1007/s12273-020-0703-5
[5] Buonanno, G., Stabile, L., Morawska, L. (2020). Estimation of airborne viral emission: Quanta emission rate of SARS-CoV-2 for infection risk assessment. Environment International, 141: 105794. https://doi.org/10.1016/j.envint.2020.105794
[6] Chartier, Y., Pessoa-Silva, C.L. (2009). Natural ventilation for infection control in health-care settings. World Health Organization, 2009. ISBN-13: 978-92-4-154785-7
[7] He, Q., Niu, J., Gao, N., Zhu, T., Wu, J. (2011). CFD study of exhaled droplet transmission between occupants under different ventilation strategies in a typical office room. Building and Environment, 46(2): 397-408. https://doi.org/10.1016/j.buildenv.2010.08.003
[8] Cheng, S.Y., Wang, C.J., Shen, A.C.T., Chang, S.C. (2020). How to safely reopen colleges and universities during COVID-19: Experiences from Taiwan. Annals of Internal Medicine, 173(8): 638-641. https://doi.org/10.7326/M20-2927
[9] Lipinski, T., Ahmad, D., Serey, N., Jouhara, H. (2020). Review of ventilation strategies to reduce the risk of disease transmission in high occupancy buildings. International Journal of Thermofluids, 100045. https://doi.org/10.1016/j.ijft.2020.100045
[10] Churazova, A. (2020). Displacement Ventilation vs. Mixing Ventilation, SimScale, 2020. www.simscale.com/blog/2017/12/displacement-ventilation-cfd.
[11] Guo, M., Xu, P., Xiao, T., He, R., Dai, M., Zhang, Y. (2020). Review and comparison of HVAC operation guidelines in different countries during the COVID-19 pandemic. Building and Environment, 107368. https://doi.org/10.1016/j.buildenv.2020.107368
[12] Zhang, Y., Han, O., Li, A., Olofsson, T., Zhang, L., Lei, W. (2021). Adaptive wall-based attachment ventilation: A comparative study on its effectiveness in airborne infection isolation rooms with negative pressure. Engineering. https://doi.org/10.1016/j.eng.2020.10.020
[13] Italian Higher Institute of Health. Interim Indications for the Prevention and Management of Indoor Environments in Relation to the Transmission of the SARS-CoV-2 Virus Infection. Version of 23 March 2020; 10 p. ISS COVID-19 Reports No. 5/2020; ISS Environment and Indoor Air Quality 2020 Working Group ii: 2020. https://www.iss.it/coronavirus.
[14] AICARR (Italian Association of Air Conditioning, Heating and Refrigeration). (2020-I). The Plants and the Spread of SARS-COV2-19 in the Workplace; AICARR: 2020. https://www.aicarr.org/Pages/Normative/FOCUS_COVID-19_IT.aspx.
[15] AICARR (Italian Association of Air Conditioning, Heating and Refrigeration). (2020-II). AICARR Position on the Operation of Air Conditioning Systems During the SARS-COV2-19 Emergency; AICARR: 2020. https://www.aicarr.org/Pages/Normative/FOCUS_COVID-19_IT.aspx.
[16] AICARR (Italian Association of Air Conditioning, Heating and Refrigeration). (2020). Protocol for the Reduction of the Risk from the Spread of SARS-COV2-19 in the Management and Maintenance Operations of Existing Air Conditioning and Ventilation Systems; AICARR: 2020. https://www.aicarr.org/Pages/Normative/FOCUS_COVID-19_IT.aspx.
[17] USEPA, U.S. Environmental Protection Agency (USEPA). Report of the Environment: Indoor Air Quality; USEPA: 2020. Available online: https://www.epa.gov/report-environment/indoor-air-quality, accessed on 19 April 2020.
[18] Kurnitski, J., Boerstra, A., Franchimon, F., Mazzarella, L., Hogeling, J., Hovorka, F. (2020). How to operate and use building services in order to prevent the spread of the coronavirus disease (COVID-19) virus (SARS-CoV-2) in workplaces. COVID-19 guidance document, REHVA.
[19] EPA, Environmental Protection Agency (EPA), Guidance 2020: Indoor Air and Coronavirus (COVID-19). Available online: https://www.epa.gov/coronavirus/indoor-air-and-coronavirus-covid-19.
[20] ASHRAE April 2020, Issues and Statements on Relationship Between COVID-19 and HVAC in Buildings. Available online: https://www.ashrae.org/about/news/2020/ashrae-issues-statements-on-relationship-between-covid-19-and-hvac-in-buildings.
[21] ASHRAE, July 2020, Updated Reopening Guide Schools Universities. online: www.ashrae.org/about/news/2020/ashrae-introduces-updated-reopening-guide-for-schools-and-universities.
[22] World Health Organization. (2020). Getting your workplace ready for COVID-19: how COVID-19 spreads, 19 March 2020 (No. WHO/2019-nCov/workplace/2020.2). World Health Organization.
[23] World Health Organization. (2020). Water, sanitation, hygiene and waste management for COVID-19: technical brief, 03 March 2020 (No. WHO/2019-NcOV/IPC_WASH/2020.1). World Health Organization.
[24] EN 16798-3:2017 Energy Performance of Buildings-Ventilation for Buildings-Part 3: For Non-Residential Buildings-Performance Requirements for Ventilation and Room-Conditioning Systems (Modules:M5-1, M5-4), http://store.uni.com/catalogo/en-16798-3-2017?josso_back_to=http://store.uni.com/josso-security-check.php&josso_cmd=login_optional&josso_partnerapp_host=store.uni.com.
[25] EN 15251:2008. Indoor Environmental Input Parameters for Design and Assessment of Energy Performance of Buildings Addressing Indoor Air Quality, Thermal Environment, Lighting and Acoustics. http://store.uni.com/catalogo/uni-en-15251-2008.
[26] UNI EN ISO 7730: 2006 Ergonomics of Thermal Environments-Analytical Determination and Interpretation of Thermal well-being by Calculating the PMV and PPD Indices and Local Thermal Well-Being Criteria. http://store.uni.com/catalogo/index.php/uni-en-iso-7730-2006.
[27] Persily, A., de Jonge, L. (2017). Carbon dioxide generation rates for building occupants. Indoor Air, 27(5): 868-879. https://doi.org/10.1111/ina.12383
[28] Liu, S., Novoselac, A. (2015). Air Diffusion Performance Index (ADPI) of diffusers for heating mode. Building and Environment, 87: 215-223. https://doi.org/10.1016/j.buildenv.2015.01.021.
[29] Sundell, J., Levin, H., Nazaroff, W.W., Cain, W.S., Fisk, W.J., Grimsrud, D.T., Weschler, C.J. (2011). Ventilation rates and health: multidisciplinary review of the scientific literature. Indoor Air, 21(3): 191-204. https://doi.org/10.1111/j.1600-0668.2010.00703.x
[30] Yang, S., Pernot, J.G., Jörin, C.H., Niculita-Hirzel, H., Perret, V., Licina, D. (2020). Energy, indoor air quality, occupant behavior, self-reported symptoms and satisfaction in energy-efficient dwellings in Switzerland. Building and Environment, 171: 106618. https://doi.org/10.1016/j.buildenv.2019.106618