Aneli Stefano | Arena Roberta | Antonio Gagliano* | Guido Sciuto
OPEN ACCESS
The current Italian photovoltaic park begins to show significant underperformance in efficiency mainly due to degradation of the modules, component defects, incorrect design, construction and maintenance of the systems. Such criticisms have the highest occurrences for the older installations which have had to meet feed-in tariff deadlines. According to GSE data, in Italy at the end of 2013 about 11,000 photovoltaic systems of between 200 kW and 5000 MW were installed, for a total power of about 11.0 GW, the prospective of upgrading and improving these older plants becomes progressively significant to both producers and PV plant owners. To meet these new needs, the Italian Energy Service System Operator (GSE) has recently issued new directives for repowering that allow producers of photovoltaic energy to maintain and modernize their plants without losing incentives. To evaluate the opportunities deriving from the possibility of revamping existing plants, a case study on a PV plant built in Sicily for which significant production losses were found is presented. The total investment costs, estimated in approximately € 444,000, is based on a market survey and the advice of industry experts. Considering the residual incentive period still recognized equal to 13, the economic return on investment is expected 8th year of post-revamping.
The possibility of making this type of operation compatible with the maintenance of incentives is, therefore, an opportunity to increase the efficiency and enhancement of the national photovoltaic park and at the same time a potentially advantageous investment for producers.
photovoltaic plant, revamping, investments, incentives
Photovoltaic (PV) is a key technology to implement the shift to a decarbonized energy supply. The rapid fall of PV system costs and the promotion of policies to support clean energy technologies have fostered a compound annual growth rate of over 40% in the last 15 years [1]. Otherwise, there was not a parallel growth of resources for diagnosis, monitoring and fault detection of grid-connected PV systems [2].
Large scale photovoltaic PV power plants are long term investments with a time frame of 20 to 30 years. Thus, accurate and consistent estimations of solar PV system output are crucial for the economic and technical planning of new plants. The return of the investment depends on their energy yields, which in turn is influenced by meteorological (e.g., solar resource), technical (e.g., the components’ quality) and contractual. parameters (e.g., operation and maintenance) [3].
The prediction of long-term photovoltaic (PV) yield varies significantly with the implemented technologies, the system design and the prevailing weather [4].
On the other hand, energy production forecasting has always represented a key issue in power system operation. In order to facilitate the continuous increase in PV penetration, the forecasting of solar energy becomes essential. A forecasting tool is necessary to estimate the available PV resources for the day(s) after.
The uncertainties on the amount of energy produced (the energy yield) are mostly due to the assessment of the solar resource and the performance of the system itself. Typically estimated uncertainties are 4% for the yearly climatic variability, 3% for the estimation of the solar radiation, 3% for the power rating of the modules, 2% for losses due to dirt and soiling, 1.5% for the losses due to snow, and 5% for other sources of error [5]. Modeling software packages are suitable tools for productivity forecasting [6]. Frequently, the model assumptions are applied as percentages of the predicted power (loss factor or derating). Most of the developed solutions use weather forecasts supplied by specialized providers [7]. Forecasting services mainly apply to utility-scale solar photovoltaic systems.
The trustworthiness of such software’s is dependent on the accuracy of the algorithms used to develop the implemented models. It is noteworthy that the performance of PV systems decreases due to the degradation over time of the system components (i.e., from the cell to the module, and from the array to the whole system) [8].
The degradation rate (DR), defined as the decrease in maximum power point performance over time depends on several factors, such as the PV technology, the operating conditions and the cumulative history of environmental exposure [9].
The concept of revamping is one of the newest terms in the solar industry. As the installed base of PV systems ages, the concept of upgrading and improving operating plants becomes increasingly relevant to both manufacturers and PV plant asset managers.
Revamping is the replacement of malfunctioning components of distressed PV plants that are no longer performing according to their original specifications and are not covered under product warranties. The replacement components are better performing, yet they do not alter the fixed power of the system.
Performance monitoring of the PV plants to ensure their performance and reliability is crucial to take full advantage of the benefits of producing solar energy [10].
Repowering aims to increase the power rating of the system within the surface boundaries of the existing plant. Solar PV plant repowering is mainly used to extend the life of plants at the end of their initial 20 to 25-year design life spans.
The importance of revamping is also relevant to the goal of digitalising energy assets, which is useful for the integration of energy data concerning consumption and production in a single platform to monitor performance, but also to carry out active (and remote) management of assets to implement preventative maintenance.
In Italy, almost 650 thousand photovoltaic plants were installed before 31 December 2014, the final year of the “Conto Energia” feed-in tariff incentive scheme.
An RSE report (Research on the Energy System) found that about one-third of the over 550,000 plants, which were installed in the 2007-2013 period, under the Conto Energia incentive scheme, for a total power of 17,332 MW, are poorly performing, i.e., they produce electricity with returns significantly lower than expected [11].
It is possible to assert that the future of the current Italian photovoltaic park will be closely related to its maintenance and technological modernization.
The importance of revamping is also relevant to the goal of digitalizing energy assets, which is useful for the integration of energy data concerning consumption and production in a single platform to monitor performance [12], but also to carry out active (and remote) management of assets to implement preventative maintenance.
In this framework, the opportunity to introduce novel configuration [13] and innovative PV modules [14] can be taken into consideration.
This kind of interventions is in full accordance with the European Green Deal, to make the continent’s economy more sustainable without increasing land take.
This study presents a case study of revamping of PV plant built-in Sicily for which significant production losses were found is presented. Firstly, the PV plant and the detection of defects, faults and failures in its current configuration are described. Thus, a proposal of revamping which allows maintaining the incentive is proposed. Finally, the financial analysis of the revamping is presented.
In theory, boosting the output of existing plants with high feed-in tariffs, by replacing components at today’s prices and performance, sounds like a straightforward opportunity.
Atmospheric agents such as ice, snow, rain and wind can structurally affect a PV panel with consequent performance deficits [15]. Furthermore, materials that are not very resistant or of low quality will be synonymous with decay and obsolescence. The most common causes of degradation of PV modules regards the arise of hot spots, breaks in the silicon, delamination and infiltration of humidity, malfunctions of the junction box, PID, deterioration of the back sheet. In the following, a synthetic description of the faults of PV modules is reported.
HOTSPOT. Hot spots highlight any imperfection in solar cells, such as cracks, poorly soldered joints, and mismatches, lead to higher resistance and become hot spots in the long run.
The long term effects of hot spots include burnt marks that degrade solar cells and back sheets and may eventually lead to fires if left unchecked.
MICROCRACKS. Wafer-thin solar cells are extremely brittle and prone to crack from any forceful impact. When microcracks form in a solar panel, the affected solar cells will have trouble conducting electric currents, which lead to poor energy production and hot spots.
Broken glass makes solar cells are more susceptible to weather damages. Extraneous elements such as water and dust can infiltrate under the glass to shade solar cells and impact energy output.
POOR CONNECTION. Solar panels with poorly soldered interconnections cause the solar cells to become open-circuited, reducing the energy production of the panel. The open circuit can be detected using an IR camera to see a significant temperature difference between solar cell strings.
DEFECTIVE JUNCTION BOX. If water or dust seeps into the junction box enclosure, the bypass diodes inside can become short-circuited and burn out. A burnt bypass diode or connector can leave the panel in an open circuit and stop transferring energy outward altogether.
SNAIL TRAILS. A snail track is a grey/black discolouration of the silver paste of the front metallisation of screen printed solar cells. When the underlying solar cells are broken, cells can continue to generate electric current along the cracks, causing localised heat that breakdown the cell surface and ethylene-vinyl acetate (EVA) encapsulation layer. If water vapour is also present, discoloured snail trails are formed along the microcracks to not only reduce energy production but also compromise the appearance.
PID POTENTIAL INDUCED DEGRADATION. PID degradation damages solar cells and reduces energy yield. The high voltage difference between the grounded frames and solar cells may generate a migration of electrical charges from the glass, through the EVA, towards the cell. This mechanism significantly reduces the conversion capacity of the cell. It is a reversible polarization effect in photovoltaic cells, sometimes due to electrochemical corrosion phenomena. For this, it will be useful to use certain materials and/or structures to avoid the slow deterioration of the parts of the system. It will be useful to choose materials with low sodium content and with anti-reflection coating.
CRACKED BACK SHEET. The cracked back sheet provides poor water insulation and damages solar cells.
DELAMINATION. Delamination refers to the detachment, even partial, of the encapsulant from the glass or back sheet.
It compromises the optical absorption capacity, increasing the reflection phenomenon of the EVA or other encapsulation materials.
DISCOLORING. The discolouration of the encapsulant layer is one of the most easily identifiable degradation phenomena with the naked eye in photovoltaic modules. The loss of transparency of the upper part of the form is highlighted.
The concept of revamping is one of the newest terms in the solar industry. As the installed base of PV systems ages, the concept of upgrading and improving operating plants becomes increasingly relevant to both manufacturers and PV plant asset managers.
Revamping is the replacement of malfunctioning components of distressed PV plants that are no longer performing according to their original specifications and are not covered under product warranties. These replacement components are better performing, yet they do not alter the fixed power of the system.
Photovoltaic Revamping interventions are regulated by the D.M. 23/06/2016, [16] whose objective is to establish guidelines for a correct modernization and optimization process of the photovoltaic system.
Revamping interventions as defined by Energy Service Manager GSE (Gestore Servizi Energetici) may concern Replacing of the Solar Panels, Inverter, electrical panels and cables, Installation of anti-PID (Potential Induced Degradation) devices, adapting the photovoltaic system to CEI 0-21 and CEI 0-16 standards, to move part or the whole system if shading problems arise due to fences, buildings, vegetation, etc.
In Italy, almost 650 thousand photovoltaic plants were installed before 31 December 2014, the final year of the “Conto Energia” feed-in tariff incentive scheme.
An RSE report (Research on the Energy System) [17] found that about one-third of the over 550,000 plants, which were installed in the 2007-2013 period, under the Conto Energia incentive scheme for a total power of 17,332 MW, are poorly performing, i.e. they produce electricity with returns significantly lower than expected. The same study found that the most critical period appears to occur between the fifth and sixth year of operation. These older installations have the highest incentives and internal rates of return, as well as more problems with component defects and plant underperformance, due to the rush to meet feed-in tariff deadlines.
Owners of plants installed when “Conto Energia” feed-in tariff incentive scheme was in place continue to benefit from a feed-in tariff for every kWh fed onto the grid, for a period of 20 years. So those owners have a vested interest in keeping their PV plant running as efficiently as possible and even upgrading their performance (within certain limits) in order to take full advantage of the benefits of producing solar energy.
Thus it is possible to argue that there will be a strong increase in revamping activities of the Italian photovoltaic park. The convenience of this kind of intervention is increasingly convincing the owners of the plants to commission revamping works. In fact, in 2017 alone, the GSE received about 13,000 requests, of which 93% related to the replacement of system components. It is noted that the modification almost entirely concerns the replacement of inverters (55%) and modules (20%) [18]. These interventions have regarded the residential sector (P = 1-20 kW) 47%; the industrial sector (P = 20-1000 kW) 49%, and utility-scale PV plant (> 1000 kW) 4%.
Following the total replacement of the modules, the life of the system is extended at least 10 years.
Therefore, the revenues coming from the sale of electricity produced out of the incentive scheme represents further convenience of the investment. The main reasons for replacing the PV modules were: hot spot breaks in the silicon, delamination and infiltration of humidity, malfunctions of the junction box, PID, deterioration of the back sheet.
The importance of revamping is also relevant to the goal of digitalising energy assets, which is useful for the integration of energy data concerning consumption and production in a single platform to monitor performance, but also to carry out active (and remote) management of assets with a view to implementing preventative maintenance.
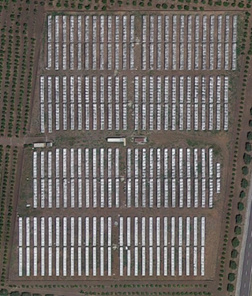
The Photovoltaic plant object of this study is located in Sicily, 37°29’32” N; 14°51’19” E, it is ground-mounted solar systems with a mono-axial tracking system, connected to the network of the medium voltage distributor at 20 kV through a 0.32 / 20 kV transformer of 1,250 kVA power.
The PV generator, depicted in Figure 1, consists of 3,777 modules divided into 199 strings associated with three 330 kW inverters with an installed peak power of 981.46 kWp.
This PV plant, which came into operation in September 2012, is incentivized according to the Ministerial Decree of 5 July 2012 (5th Energy Account). The concentration plants, like this, received an incentive rate of 238 €/MWh was envisaged, which was reduced by 8% starting from January 1, 2015. The current incentive rate is therefore equal to 218.96 €/ MWh. The photovoltaic modules are low crystalline concentration type, Solaria CPV, mounted on an Axone Single-axis (N-S axis) tracker. Their use with monoaxial roll tracking systems, thanks to the optical characteristics, should allow capturing 50% of the scattered radiation during the initial and final hours of the day.
Figure 1. Areal view of the plant and detail of the installed PV module
Table 1 reports the main characteristics of the Solaria CPV module.
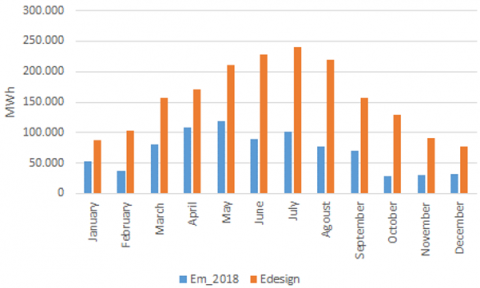
The design assumptions estimated that the tracking system, compared to the fixed one, can guarantee an increase of the energy yields of about 19%, with an estimated annual energy yield of 1,890 MWh.
Table 1. Main characteristics of the Solaria CPV module
|
Peak Power [W] |
Current [A] |
Voltage [V] |
Efficiency [%] |
|
P = 265.0 |
Impp =7.64 Isc = 7.93 |
Vmpp =34.70 Voc = 43.97 |
η = 13.0 |
Currently, it was observed a dramatic loss of efficiency of the plant, the energy yield for 2018, as certified by GSE, was just 825.105 MWh, which is about 53% less than the estimated energy yield of 1870 MWh calculated in the design phase, as shown in Figure 2.
Figure 2. Comparison between current and design energy yields
The decrease of the energy yield cannot be attributable to just the annual PV module degradation, which has values around 0.8% per year [19]. Degradation prediction is a difficult task since different PV technologies are subject to various differing degradation mechanisms [20].
Linear Regression (LR) represents the most common method used for calculating the DR [21].
For this specific case the shape of the “degradation curve,” was assumed as exponential.
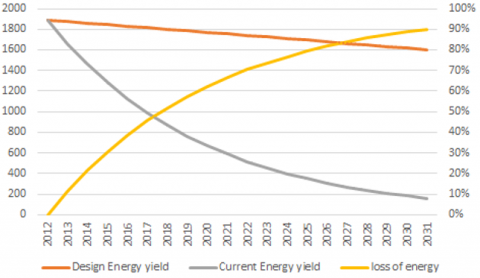
Thus it is possible to estimate the yearly energy yield after “n” years using the following equation: EPV(n) = 1870 e-nλ.
Comparing the energy yield of the plant in its 1st year of operation (2012) with that one observed in 2018.
The decay constant λ = 0.13 was determined.
Figure 3. Annual decays of the Energy yields
Figure 3 shows the yearly energy yields considering an annual decay rate of 0.8% (design EPV) with the decay determined with the actual decay (current EPV), as well as the loss of production due to the current degradation of the plant.
The PV plant was subjected to a verification analysis that involved thermal and electrical testing procedures to evaluate the efficiency of the whole PV power plant as well as its components.
The analysis begins with a visual inspection to establish if the plant is built according to its design documentation and it is followed by a review of PV component quality and a performance ratio analysis.
5.1 Thermal testing
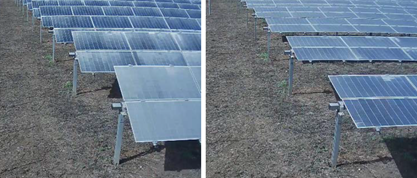
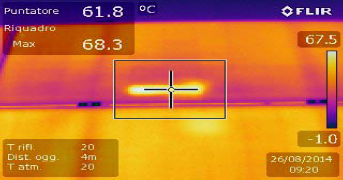
Many PV modules were randomly chosen and inspected with the IR camera, the audits were carried out on connectors, string box, junction boxes.
An extended hotspot phenomenon was detected, partly attributable to the poor manufacturing of the components and aggravated by the presence of reverse currents induced by the mismatching between modules with different characteristics.
Figure 4 shows two infrared images for two investigated modules.
Figure 4. Infrared images of PV modules
5.2 Electrical testing
The Electrical testing foresees sample audits on the electrical continuity between the strings of the modules and the inverter output, verification of the open-circuit voltage and strings current according to the standard IEC62446. Table 2 reports a sample of one of the electrical test carried out.
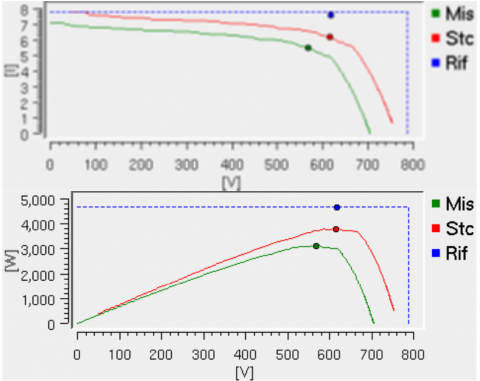
Losses in electricity production were also assessed through the detection of current and power characteristic curves for strings affected by hotspots. Measurements of module I-V characteristic determine short-circuit current ISC, open-circuit voltage VOC, and other parameters.
Field measurements were carried out with a portable I-V tracer under not standard test conditions (STC), which are 1000 W/m2, 25°C, AM 1.5G reference spectrum. Thus, the measured I-V curves are correct for comparison with datasheet values at STC. A pyranometer is used as a reference solar device for rating global irradiance.
Table 2. Electrical Tests
|
|
String |
||
|
Parameter |
Nominal |
Observed |
Observed in STC |
|
Voc [V] |
787.68 |
704.40 |
752.66 |
|
Isc [A] |
7.82 |
7.13 |
7.81 |
|
Vmpp [V] |
616.86 |
566.80 |
615.20 |
|
Impp [A] |
7.59 |
5.52 |
6.20 |
|
P [W] |
4681.97 |
3131.0 |
3814.28 |
|
FF [%] |
76.01 |
62.32 |
64.00 |
|
ηel [%] |
13.30 |
10.84 |
10.84 |
Figure 5 shows the current and power characteristic curves for strings affected by hotspots.
Figure 5. Measured current and power characteristic curves
The Sample audits on the I/V characteristics of the strings evidenced meaningful differences in comparison with the nominal values.
Moreover, a loss of system efficiency estimated at around 6-7% is due to the incorrect setting of the backtracking of the trackers.
Any modernization work of a photovoltaic system must be subjected to the preliminary assessment by the GSE, in order to verify the feasibility of interventions in accordance with the indications contained in the Technical Document for Revamping (DTR) which indicates the activities that give rise to the loss of the incentives of the "Conto Energia".
In particular, the increase in power of the photovoltaic system may not exceed 5% of the power already installed previously for all systems up to 20 kW and 1% for those over 20 kW.
The replacement of the modules must be done using newly built or regenerated elements, and in any case compliant with the requirements imposed by the fifth "Conto Energia".
Considering the enormous underperformance of the plant, the proposed revamping intervention provides the total replacement of the current CPV with PERC (Passivated Emitter Rear Cell) modules is proposed.
The transition from concentration technology to monocrystalline technology is a choice made necessary by the unavailability on the market of the CPV modules currently installed onto the plant. Although the change of the type of PV module implies the loss of the tariff for the concentration plants, it is supposed that the module chosen allow achieving a positive outcome of the constraints requested by the GSE. The main characteristics of the components of the revamped PV plant are summarized in Table 3.
Table 3. Main features of the revamping intervention
|
Component |
Description |
|
System Trackers |
Tracking horizontal axis Simplified model. unlimited 25tracker rows Axis Azimuth 0° Rotation Limitations Phi min. -45° Phi max. 45° Backtracking strategy Nb. of trackers 25 Tracker Spacing 5.00 m Collector width 2.00 m Inactive band Left 0.02 m Right 0.02 m Backtracking limit angle Phi limits +/- 65.8° Ground coverage Ratio (GCR) 40.0 % |
|
PV Array Characteristics |
PV module Si-mono Model CS3K-300MS Number of PV modules: 19 modules in series; 172 strings in parallel Total number of PV modules: 3268 Unit Nom. Power 300 Wp Array global power Nominal (STC): 980 kWp; At operating cond. 890 kWp (50°C) Array operating characteristics (50°C): Umpp 556 V; Impp 1601 A Total area Module area 5430 m²; Cell area 4792 m² |
|
Inverter |
Model PVI Central 300 TL Characteristics: Operating Voltage 465-850 V. Unit Nom. Power 336 kWac Inverter pack Nb. of inverters 3 units; Total Power 1008 kWac Pnom ratio 0.97 |
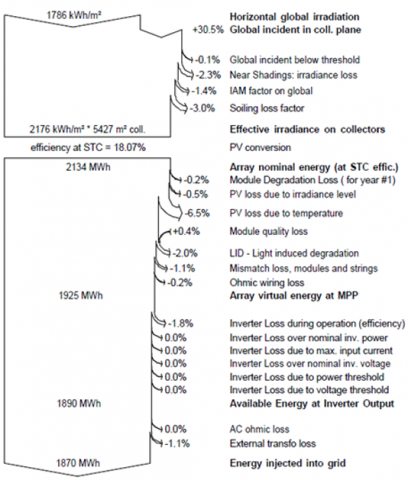
Figure 6 summarizes the main results of the energy balance for the different sections of the revamped plant.
Figure 6. Sankey diagram of the PV plant energy flow
The financial analysis must take into account both investment costs, which have to be sustained only the first year of life of the plant, and O&M (“Operation and Maintenance”) costs.
The cost of replacing was determined considering the cost of the single modules, € 0.36/Wp, the labour for assembly and disassembly of the panels, the costs of inverters and electrical materials. Disposal costs are also included. The analysis also includes costs due to loss of production, technical analysis and the fee to be paid to the GSE.
Table 4 summarizes the cost of the revamping expressed in Euro.
Table 4. Cost of the revamping
|
PV module, labour cost inverter |
Fees |
Loss of production |
Technical analysis |
Total Cost |
|
428,000 |
2,060 |
10,600 |
3,400 |
444,000 |
The basic value of the incentive on the electrical energy produced was 135 €/MWh. For PV plant with nominal power greater than 200 kW, a redefinition of incentive rates, which foresee a decrease of 8% from 1° January 2015. So the current incentives that could receive the plant are 124.2 €/MWh.
By limiting the analysis to the incentive period only, the cash inflows are calculated whereas, in the absence of revamping, the plant has an annual decline in production of 12%. Thus the differences in annual revenues ∆R(n) deriving by the plant revamping is calculated by the following equation:
∆R(n) =124.2*EPV,PR(n) -218.96* EPV,AR (n), where, EPV,PR(n) and EPV,AR (n) are the energy yield ante e post-revamping.
Table 5 shows the difference in annual revenues ∆R(n) between the revamped PV plant and that one for the PV plant if the current configuration is maintained.
Table 5. Financial analysis
|
year |
EA(n) |
EB(n) |
$\Delta R(n)$ |
$\sum_{t=1}^{n} \Delta R_{t}$ |
VAN |
|
(2020) |
795,65 |
1874,88 |
58.643 |
56.660 |
-383.340 |
|
(2021) |
786,11 |
1859,76 |
58.856 |
111.603 |
-332.397 |
|
(2022) |
776,67 |
1844,64 |
59.044 |
164.857 |
-279.143 |
|
(2023) |
767,35 |
1829,52 |
59.207 |
216.452 |
-227.548 |
|
(2024) |
758,15 |
1814,4 |
59.345 |
266.419 |
-177.581 |
|
(2025) |
749,05 |
1799,28 |
59.459 |
314.789 |
-129.211 |
|
(2026) |
740,06 |
1784,16 |
59.549 |
361.595 |
-82.405 |
|
(2027) |
731,18 |
1769,04 |
59.616 |
406.868 |
-37.132 |
|
(2028) |
722,40 |
1753,92 |
59.659 |
450.641 |
6.641 |
|
(2029) |
713,74 |
1738,8 |
59.679 |
492.949 |
48.949 |
|
2030) |
705,17 |
1723,68 |
59.677 |
533.825 |
89.825 |
|
2031 |
696,70 |
1708,56 |
59.652 |
573.301 |
129.301 |
|
2032 |
688,34 |
1693,44 |
59.605 |
611.413 |
167.413 |
The Net Present Value (NPV) trend indicates that after 8 years the costs of the revamping are recovered. The project would produce profits for almost 1/3 of the residual incentive period, despite the strong reduction in the incentive rate (42.3%) that would result from the change in the technology of the modules used.
It is worth noticing that following the total replacement of the modules, the life of the system is extended at least 10 years. Therefore, the revenues coming from the sale of electricity produced out of the “Conto Energia” incentive scheme represents further convenience of the investment.
A revamping intervention that involves the total replacement of the existing modules is proposed.
This study presents a case study of revamping of PV plant built in Sicily for which significant production losses were found is presented. Firstly, a description of the PV plant and the detection of the faults in its current configuration are described. The main reasons for replacing the PV modules were: hot spot breaks in the silicon, delamination and infiltration of humidity, malfunctions of the junction box, PID, deterioration of the back sheet. Thus a proposal of revamping which allows maintaining the incentive is proposed. Finally, the financial analysis of the revamping is presented. The Net Present Value (NPV) trend indicates that after 8 years the costs of the revamping are recovered. The project would produce profits for almost 1/3 of the residual incentive period, despite the strong reduction in the incentive rate (42.3%) that would result from the change in the technology of the modules used.
It is worth noticing that following the total replacement of the modules, the life of the system is extended at least 10 years. Therefore, the revenues coming from the sale of electricity produced out of the incentive scheme represents further convenience of the investment. This study confirms that boosting the output of existing plants with high feed-in tariffs, by replacing components at today’s prices and performance, constitutes a straightforward opportunity.
The importance of revamping is also relevant to the goal of digitalising energy assets, which is useful for the integration of energy data concerning consumption and production in a single platform to monitor performance, but also to carry out active (and remote) management of assets with a view to implementing preventative maintenance.
|
EPV |
Energy yield |
|
FF |
fill factor, % |
|
Isc |
short-circuit current, A |
|
Impp [A] |
Current at maximum power point, A |
|
Pmax |
maximum power, W |
|
STC |
Standar Test Condition |
|
Voc |
open-circuit voltage, V |
|
ηel [%] |
Elecrical efficeincy, ηel |
|
λ |
decay constant |
|
Subscripts |
|
|
PV |
photovoltaic |
|
PR |
Post revamping |
|
AR |
Ante revamping |
[1] Malvoni, M., Leggieri, A., Maggiotto, G., Congedo, P. M., De Giorgi, M.G. (2017). Long term performance, losses and efficiency analysis of a 960 kWP photovoltaic system in the Mediterranean climate. Energy Conversion and Management, 145: 169-181. https://doi.org/10.1016/j.enconman.2017.04.075
[2] Trillo-Montero, D., Santiago, I., Luna-Rodriguez, J.J., Real-Calvo, R. (2014). Development of a software application to evaluate the performance and energy losses of grid-connected photovoltaic systems. Energy Conversion and Management, 81: 144-159. http://dx.doi.org/10.1016/j.enconman.2014.02.026
[3] Reise, C., Müller, B., Moser, D., Belluardo, G., Ingenhoven, P. (2018). Uncertainties in PV system yield predictions and assessments. IEA-PVPS, Report IEA-PVPS T13-12.
[4] Okello, D., Van Dyk, E.E., Vorster, F.J. (2015). Analysis of measured and simulated performance data of a 3.2 kWp grid-connected PV system in Port Elizabeth, South Africa. Energy Conversion and Management, 100: 10-15. https://doi.org/10.1016/j.enconman.2015.04.064
[5] Thevenard, D., Driesse, A., Pelland, S., Turcotte, D., Poissant, Y. (2010). Uncertainty in long-term photovoltaic yield predictions. Natural Resources Canada.
[6] https://sam. nrel.gov/content/downloads.
[7] https://photovoltaic-software.com/solar-tools/pv-energy-forecasts.
[8] Jordan, D.C., Kurtz, S.R. (2013). Photovoltaic degradation rates—An analytical review. Progress in photovoltaics: Research and Applications, 21(1): 12-29. https://doi.org/10.1002/pip.1182
[9] Phinikarides, A., Kindyni, N., Makrides, G., Georghiou, G.E. (2014). Review of photovoltaic degradation rate methodologies. Renewable and Sustainable Energy Reviews, 40: 143-152. https://doi.org/10.1016/j.rser.2014.07.155
[10] Ventura, C., Tina, G.M. (2016). Utility scale photovoltaic plant indices and models for on-line monitoring and fault detection purposes. Electric Power Systems Research, 136: 43-56. https://doi.org/10.1016/j.epsr.2016.02.006
[11] http://www.rse-web.it/progetti/progetti.
[12] Tina, G.M., Scavo, F.B., Gagliano, A. (2020). Multilayer thermal model for evaluating the performances of monofacial and bifacial photovoltaic modules. IEEE Journal of Photovoltaics, 10(4): 1035-1043. https://doi.org/10.1109/JPHOTOV.2020.2982117
[13] Aneli, S., Arena, R., Gagliano, A. (2021). Numerical simulations of a PV module with phase change material (PV-PCM) under variable weather conditions. International Journal of Heat and Technology, 39(2): 643-652. https://doi.org/10.18280/ijht.390236
[14] Tina, G.M., Gagliano, A. (2016). An improved multi-layer thermal model for photovoltaic modules. 2016 International Multidisciplinary Conference on Computer and Energy Science (SpliTech), Split, Croatia, pp. 1-6. https://doi.org/10.1109/SpliTech.2016.7555927
[15] https://iea-pvps.org/wp-content/uploads/2020/01/IEA-PVPST13 01_2014_Review_of_Failures_of_Photovoltaic_Modules_Final.pdf.
[16] https://www.gse.it.
[17] https://iea-pvps.org/national_survey/national-survey-report-of-pv-power-applications-in-italy-2018/.
[18] https://www.enelx.com/it/it/risorse/storie/2020/05/revamping-fotovoltaico-come-funziona.
[19] Jordan, D.C., Kurtz, S.R. (2013). Photovoltaic degradation rates—an analytical review. Progress in photovoltaics: Research and Applications, 21(1): 12-29. https://doi.org/10.1002/pip.1182
[20] Makrides, G., Zinsser, B., Schubert, M., Georghiou, G.E. (2014). Performance loss rate of twelve photovoltaic technologies under field conditions using statistical techniques. Solar Energy, 103: 28-42. https://doi.org/10.1016/j.solener.2014.02.011
[21] Cronin, A., Pulver, S., Cormode, D., Jordan, D., Kurtz, S., Smith, R. (2014). Measuring degradation rates of PV systems without irradiance data. Progress in Photovoltaics: Research and Applications, 22(8): 851-862. https://doi.org/10.1002/pip.2310