Simone Pedrazzi* | Enrico Morini | Marika Nasti | Simone Pizzileo | Alberto Muscio | Paolo Tartarini
OPEN ACCESS
The future is moving towards an energy system different from the current one: highly efficient, renewable and immediate. For this reason, it is necessary to promote innovative technologies to pursue the development of a green economy connected to the environmental sustainability and the reduction of food waste. This study lays the basis of a different approach on the interaction between solar production and bio enhancement of organic residual flows of a fruit and vegetable market in Southern Italy. The proposed method consists in the installation of a photovoltaic system to cover the energy needs, including the electricity demand for the use of forklifts. This innovation is linked to the sustainable management of residual agri-food waste that, properly treated, allows the production of a soil improver usable in the early stages of the product life cycle. Therefore, the optimization of the entire agri-food chain permits the achievement of the requirements needed to obtain important environmental labels, signs of transparency and safety for the market products.
The results emerged from an economic analysis justify the investment for the realization of the system: the optimal exploitation of the renewable source allows an annual profit which drastically reduces the payback periods of the investment.
byproducts, energy policy, food waste, solar energy, sustainability
It is necessary to rely on the use of renewable energy resources (RES) and on the increasing of energy efficiency in order to achieve the objectives that the Rio Agreements and subsequent COP have set regarding the reduction of greenhouse gas emission [1].
Italy shows a strong dependence on foreign imports of fossil fuels, making it particularly vulnerable from the point of view of energy security [2, 3].
The problem of the displacement of production is added to this situation: taking into account solar and wind energy, the construction of large energy parks is strongly conditioned by their position in the territory.
The South regions are often called “Mezzogiorno” and they contribute in an important way in terms of RES power, covering about 87% of the entire wind power production and 50% of the photovoltaic power production [4]. The above numbers highlight a significant difference between the most energy-intensive northern regions and the “Mezzogiorno”, considered the country’s energy reserve.
It is therefore necessary to develop energy saving practices and renewable sources by promoting sustainable development projects aimed at reducing consumption, especially in large industrial and commercial centers, which play a primary role in terms of energy demand.
The great Italian productive activities are the engine of the country’s economy, but they are often managed in a less sustainable way. The aim of this study is to give more energy independence to a fruit and vegetable market, in Southern Italy, thanks to renewable sources (solar energy and re-utilization of food waste). The case study is located in Campania, a region capable of interfacing with a considerable contribution in the panorama of national electricity productivity from solar sources, standing among the top 10 Italian regions for more installed photovoltaic power, preceded only by wind energy for electricity generation.
A PV-plant with a nominal power of 414.8 kWp has been installed in order to cover the electricity demand of the market. This electricity consumption is due to the refrigeration of the products (Materials and methods, System I) and it is also given by 59 forklift trucks, used to transport and distribute goods (Materials and methods, System II). This work also proposes the recycling of agri-food waste produced by the fruit and vegetable market (Materials and methods, Compost) in order to meet the environmental requirements necessary to obtain environmental product labels as well as to significantly reduce the carbon footprint of products sold in the market area.
Consumers are constantly raising their awareness on the issue of sustainability, increasing the communication of environmental performance. They play a key role in the marketing of the product and in the public sector as a whole, therefore facilitating cooperation between producer and consumer through the adoption of environmental labels which highlight and resolve a social need that is growing over the years [5].
The above has been studied and designed in parallel with a life cycle assessment of organic waste from the agri-food chain, thanks to a "gate to gate" analysis, which aims to:
- exploit the organic residual flows of the fruit and vegetable market;
- produce a quality composted soil improver to be reused when the product is grown;
- biogas production by anaerobic digestion of the organic fraction;
- avoid disposing of the wet fraction outside the region at a costly cost exploiting the composting sites in the municipalities adjacent to the fruit and vegetable market.
This study therefore focuses on a double front:
- the decrease in electricity consumption linked to transport and distribution within the market area.
- the recycling of agri-food waste related to the disposal of market waste having as common denominator the increase of the environmental, energetic and economic sustainability.
In this regard, it is proposed a further analysis based on the economic sustainability of the project (2.4. Economic analysis), aimed at ascertaining its full feasibility by estimating the payback time of the investment.
The study presented in this paper is focused on the installation of a 414.8 kWh photovoltaic system at the “Mercato Ortofrutticolo Nocera-Pagani (Salerno)”.
The Market extends across 13 hectares and it represents a central point in the fruits and vegetables’ business of Southern Italy. With respect to the status quo before the investment, 59 charging station, one for each electric forklift used to manage the market products, have been considered.
A first 249.6 kWp PV system was designed to give energy for the market auxiliaries, and a second one of 165.2 kWp was designed to fulfil the electric forklifts recharge only.
To understand the feasibility of the project, it was necessary to address a study that could highlight the availability of the source at the latitudes of the market area, thanks to the use of three different software: PV-Syst, Meteonorm and S.O.L.E. In particular, PV-Syst was used to quantify the solar radiation available on a flat plate installed in this location (1577.2 kWh/m2); Meteonrom evaluated the solar path and S.O.L.E. was been used for the shade analysis on the PV-modules.
Finally, to properly study the solar plant coupled with forklift trucks, an analysis was conducted on the average monthly energy demand of each forklift, in order to understand the autonomy of the same and to appropriately size the photovoltaic system connected to charging stations. Everything is computed by assuming a daily working period from 4 a.m. to 12 a.m. The overall PV-system was slightly over-sized in order to have an annual net electrical productions higher than the annual consumption for the 25-years system lifetime. This assessment has been made to act in favor of the economic sustainability of the plant’s total investment.
In order to encourage an energy policy that can effectively contribute to the economic and environmental savings of the fruit and vegetable market, the project aims at achieving the necessary requirements for obtaining environmental labels. In this regard, to reduce the carbon footprint of the market, the benefits linked to the decrease in electricity consumption due to the installation of the photovoltaic system are combined with the benefits deriving from the recycling of waste from the agri-food chain of the market in order to produce a quality composted soil improver.
2.1 System I
System I corresponds to the coverage of the energy requirements common to all wholesalers companies of the fruit and vegetable market, such as internal consumption and refrigeration of products.
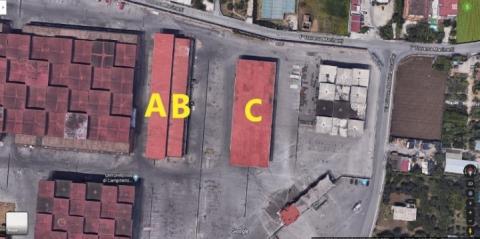
The electrical consumption in the 2019 was 316832 kWh. In order to uses the favorable position to have a better solar irradiation and therefore to have a greater power of the system, the necessary modules were placed on the flat roof of buildings A and B depicted in Figure 1, which have an orientation of approximately South 0°.
In a perspective of technological innovation, environmental, energetic and economic sustainability, the design involves the
installation of 780 monocrystalline modules Sunpower E19-320-COM 320 Wp so arranged:
- 585 modules placed on the cover A
- 195 modules placed on the cover B
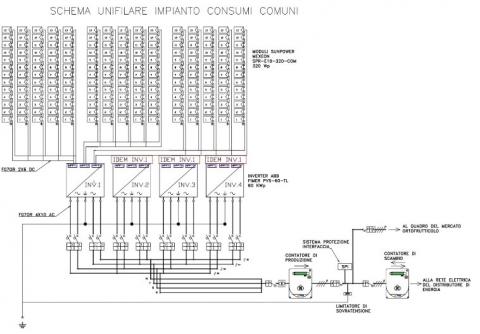
These ones, properly connected to 4 three-phases inverters ABB FIMER PVS-60-TL 60 kW, cover entirely the two facades developing 3 blocks of 195 modules on the facade A and 3 blocks of 65 modules on the facade B, in order to safely ensure a proper coupling to the MPPT of the inverters as described in the electrical scheme of the PV plant reported in Figure 2. For homogeneity of operation, the same layout has been applied for every inverter provided in System I. The nominal power of the PV system is 249.6 kWp.
Figure 1. Location, and elevation profile (Imagine of Google Maps)
Figure 2. Single-line diagram for common consumption
2.2 System II
The energy demands deriving from the use of a STILL RX 50-10C forklift for each of the 59 companies present in the market are instead satisfied by the installation of System II. The analysis of the consumption, in relation to what explained above, comes out from the study of the average monthly energy demand of each medium. This allowed us to estimate:
- the autonomy of the forklift in relation to the capacity of its battery;
- the percentage of charging in the afternoon until sunset and the end of panel productivity;
- the contributions from the national network in relation to the percentage of charge.
It was preferred to modulate the design for every forklift truck, estimating 4000 kWh of annual consumption for each of them. This assumption is justified by the study carried out in relation to the battery capacity of the selected forklift trucks: for a work shift of 8 h it is needed a battery of 460 Ah and 24 V voltage; the daily consumption of a single conveyor is 11 kWh. The annual consumption of 4000 kWh per forklift has been taken with caution, taking into account only the weekdays of the market (300).
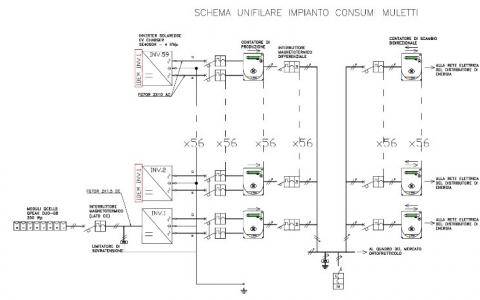
In order to limit the difficulty of the small space available for the installation of the modules, the configuration adopted for this system involves the choice of a string of 8 monocrystalline panels in series Qcells Q.Peak Duo-G8 350 Wp inclined by 30° and positioned on the flat surface of the indoor parking C. The latter, although having the same orientation as buildings A and B, has a usable surface not sufficient to fit all strings, therefore the optimized inclination of the modules allows an increase of the nominal power of the system capable of completely satisfying the energy demand coming from all the forklifts.
It was possible to upgrade the indoor parking (previously used as parking for private cars of the employees of the market) as night storage and as charging station for forklift trucks thanks to the connection of each string with a single-phase inverter Solaredge HD Wave SE4000H 4 kW (Figure 3). The power of each appropriately oversized sub plant is 2.8 kWp.
Figure 3. Single-line diagram for private consumption
2.3 Compost and biogas from food residues
To improve the advantages deriving from the design of a photovoltaic system, it is proposed a combination of the latter with the bio enhancement of the waste of the agri-food chain. In this way, the reduction in electricity consumption guaranteed by the solar system is upgraded by the possibility of optimizing the disposal of organic waste. This leads to the production of quality composted soil improver, which can be used in the early stages of the life cycle of the products subsequently sold in the market. The project expects that the energy valorization of the organic fraction will be done in the composting site of Salerno with an integrated treatment of anaerobic/ aerobic digestion. The aerobic digestion produces compost distributable to those who request it.
The energy requirements of the composting site are met by the work of two CHP engines powered partly by biogas extracted from the anaerobic phase and partly by the electricity from a photovoltaic system installed on the roof. Such a configuration allows not only to promote the environmental and energy sustainability of the design, but also to highlight a circular economy developed on the combination of solar energy and of enhancement of the bioproduct.
2.4 Economic analysis
As explained in the previous pages of this paper, the two different systems are at the service of different market’s companies and consequently the total investment will be made by each of them.
In particular, the System I that provides energy for every common market consumption will be paid in equal parts by all the 59 companies.
On the other hand, as already explained, the investment of every single part of the System II which provides the energy demand of the forklift is individually covered by each company.
A Net Present Value economic analysis has been carried out in order to understand the real feasibility and opportunities of the two systems thanks to the software “Simulare”, taking into account the subsidies for PV energy production described in the Italian law Dm. 04/07/2019.
It has also been considered the possibility of three different payment methods:
- without any financing;
- 50% of the total amount;
- with a leasing of 20% of the total investment sum.
After this economic analysis, it has been possible to understand the feasibility of project for each type of market, regardless of their economic situation.
The choice to build a photovoltaic system of 414.8 kWp at the service of a fruit and vegetable market in Southern Italy comes from the analysis of the renewable solar source.
The geographical area under study presents suitable conditions for the utilization of a photovoltaic system boasting a solar radiation of 1577.4 kWp/m2 that allows a consistent PV energy production. Therefore, this advantage has been exploited in the design to:
- obtain substantial green electricity production which could satisfy the electrical needs of the commercial center;
- significantly reduce the company’s carbon footprint, mainly affecting the life cycle of the product first cultivated and subsequently marketed;
- drastically reduce pollutant emissions from the use of forklifts previously fueled by fossil fuel.
This justifies the economic sustainability of the project, which ensures a significant profit closely linked to the availability of the source thanks to the optimal use of renewable energy.
On the other hand, it makes possible to increase the environmental and energy sustainability with the aim of achieving the requirements needed to obtain the ecolabel for marketed products.
The environmental label attests that the products of the European market show a low environmental impact during its life cycle [6], in a "cradle to grave" process.
The aim of the project is precisely to have an important impact on the extraction and disposal phase of the product, by producing a quality soil improver, and on the distribution and marketing phase by reducing electrical consumption and polluting particles emission.
3.1 Project results
For the System I, the plant has been sized “ad hoc” on the basis of the real electrical consumption common to all companies in the market (316832 kWh) bearing an average annual energy loss caused by shadowing of 0.4% of all production. For System II the study carried out translates the effectiveness of the photovoltaic design related to the use of forklift trucks: despite the fact that the actual use of energy produced by modules is assured indicatively from 12:00 PM of each working day, the consumption of forklifts is covered by 68% of the photovoltaic system only (2258.3 kWh produced against 3311 kWh required in 301 working days).
Moreover, thanks to the remarkable contribution of solar radiation in the summer months and to the greater durations of sun relative to the latitudes of the market, there is an electric production able to cover the entire requirement in May, June, July and August, giving a 100% self-consumption for 1/3 of the year.
The energy produced and not self-consumed, relating to feast days and the early hours of the morning of weekdays, is entered into the national network according to a buying and selling regimes: in this way, a self-consumption of 53% of the plant’s productiveness is ensured compared to the energy released in the network.
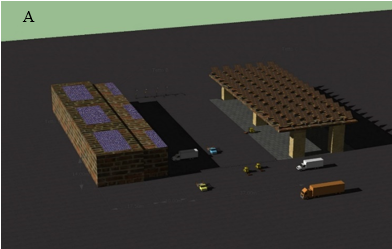
It was possible to count the actual shading that the installed modules could suffer thanks to the 3D rendering and the implementation of tools suitable for the simulation of the solar path in the different hours of the day during the year.
As can be seen in Figure 4, the distance of 47 m between the building B and the indoor car park C allows to neglect the study of shading in favor of the parking since, even during winter days shadows do not significantly affect the modules installed on the roof of the car park because the sun is particularly low and the angle of incidence of the rays is very small.
Figure 4. A) Rendering of the project and site arrangement Simulation of the solar path in B) March and C) December
3.2 Economic results
Table 1. Design calculations
|
|
System I |
System II (1 to 59) |
|
System I |
System II (1 to 59) |
|
γ (Orientation) |
0° |
0° |
Epv (kWh/m2) |
1577.4 |
|
|
β (Tilt angle) |
0° |
30° |
Hs (kWh/m2) |
1577.4 |
1751 |
|
Consumption (kWh) |
316832 |
4000 |
Heq (kWh/kWp) |
1358 |
1529 |
|
Module Power (W) |
320 |
350 |
Power rating (Wp) |
233329 |
2616 |
|
ηinverter (EU) |
0.98 |
0.99 |
N° modules (minimum) |
729 |
7 |
|
k (shading) |
0.98 |
0.98 |
N° modules (design) |
780 |
8 |
|
ηmodule |
0.9 |
0.9 |
Power plant nominal power (kWp) |
249.6 |
2.8 |
Table 2. Energy fluxes analysis
|
|
Forklift’s Charge Period |
Annual Production (kWh) |
Monthly Forklifts Consumption (kWh) |
Daily work Self-Consumption |
% Forklifts Charcge |
%Entry and Withdrawal from National Grid |
|
January |
12:00 PM/6:00 PM |
171.15 |
264 (24 days) |
55% |
36% |
-169.87 |
|
February |
12:00 PM/6:00 PM |
211.15 |
275 (25 days) |
55% |
42% |
-158.87 |
|
March |
12:00 PM/7:00 PM |
350.74 |
286 (26 days) |
54% |
66% |
-96.60 |
|
April |
12:00 PM/7:00 PM |
414.69 |
275 (25 days) |
54% |
81% |
-51.07 |
|
May |
12:00 PM/8:00 PM |
549.65 |
275 (25 days) |
53% |
100% |
+16.31 |
|
June |
12:00 PM/8:00 PM |
559.72 |
275 (25 days) |
53% |
100% |
+21.65 |
|
July |
12:00 PM/8:00 PM |
571.42 |
297 (27 days) |
53% |
100% |
+5.85 |
|
August |
12:00 PM/8:00 PM |
506.93 |
264 (24 days) |
53% |
100% |
+4.67 |
|
September |
12:00 PM/7:00 PM |
378.77 |
286 (26 days) |
54% |
72% |
-81.46 |
|
October |
12:00 PM/6:00 PM |
287.07 |
297 (27 days) |
55% |
53% |
-139.11 |
|
November |
12:00 PM/6:00 PM |
161.90 |
264 (24 days) |
55% |
34% |
-174.96 |
|
December |
12:00 PM/5:00 PM |
128.98 |
253 (23 days) |
56% |
29% |
-180.77 |
|
|
|
4292.17 kWh |
3311 kWh (for 301 days) |
Photovoltaic Coovering |
2258.30 kWh 53% |
|
As anticipated in the previous paragraph (3.1 Project results) assuming an approximately constant consumption over time, the design requires an initial greater economic outlay but with a considerably low depreciation time: as mentioned above, in the system lifetime of 25 years, the production of the photovoltaic system guarantees the total coverage of consumption despite annual losses, optimizing the economic gain from the energy produced by the system, as shown in Table 1.
It was possible to make an estimate of the costs that each company is charged to support thanks to the evolution of price in the photovoltaic industry in terms of electricity and material in the year 2020. The total amount for the 414.8 kW plant is € 472000 divided as follows:
- System I: € 274560
- System II: € 3360 (per company)
Every owner of company will be responsible of a work expense of approximately € 8000.
3.2.1 System I-economic results
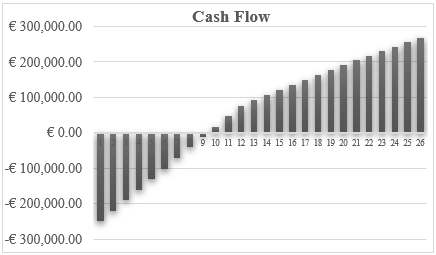
As shown in Figure 5 below, it is possible to see that the payback time of the investment is 9 years in the case the markets do not ask for any loan from the bank or other credit found. The payback time does not vary significantly even in the case the market asked for a 50% financing or a 20% leasing. The most convenient investment formula is the one without any financing.
This type of photovoltaic system seems to be a very smart solution for a more sustainability of the market itself. In fact, as shown in Table 2 and Figure 6, the most important energy consumption into the market is the one concerning food’s refrigeration and artificial lights that would be largely covered up by the energy produced by the photovoltaic system.
Figure 5. Cumulative Cash flow (System I)
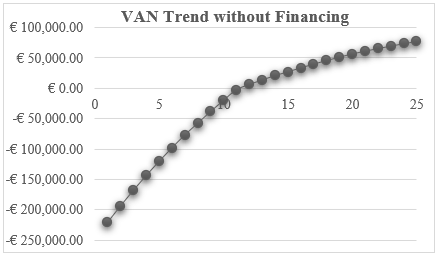
Figure 6. Evolution of the NPV without Financing
3.2.2 System II-economic results
In this case, the economic analysis has been made by considering a single system at the service of one forklift, regarding the valuation of the investment’s convenience of each company.
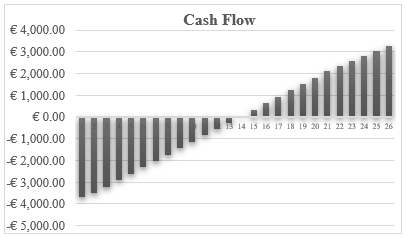
It is worth noting that the use of forklift has been assumed as concentrated in the working hour and not during the whole day. As shown in Figures 7 and 8, it is possible to see that the return period is 13 years in case the company does not ask for a loan or a leasing; while the return period grows a bit in the other case.
This second type of system is not completely sustainable, as the return period consists of too many years; anyway, it would provide an enormous increase in environmental sustainability of the market as the food’s transport in the area would be completely carbon free.
This System II would have a strong impact of environmental prestige on companies, as well as it would allow to reach important and famous global awards, such as the achievement of the necessary requirements to obtain environmental labels.
Figure 7. Cumulative cash flow (System II)
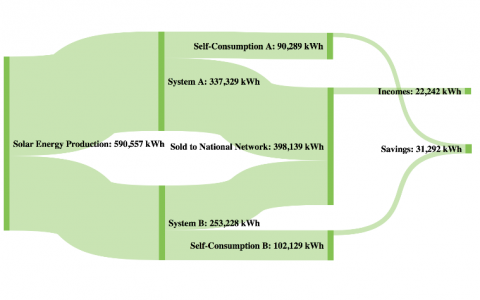
Figure 8. Sankey diagram of energy fluxes
As it has clearly emerged from this paper, the main objective of this project is to think and realize a new concept of fruit and vegetable market, where everything is thought to be sustainable from the environmental, energy and economic.
The idea is to reduce the main consumption of electricity used in the market, through solar panels which help to reduce the balance of CO2 emissions in the various processes of the market itself.
The use of solar panels gives the possibility to increase green transport within the gate of the market, thanks to the production of green energy and to the instant consumption of the latter by electric forklifts. These results must be seen from the point of view of the possibility of achieving major global environmental labels, such as the carbon footprint. This important environmental label gives companies the opportunity to reach a new ecological prestige and to show it to their customers. This will give a new green vision of the market but also the possibility to increase the environmental sustainability of the entire area involved.
The other important aspect of upgrading the site concerns the new management and destination of market waste, such as food, fruit and vegetable.
The idea is to collect them in compliance with the Italian law on waste, and then give them to an aerobic/anaerobic composting site near the market itself, about 25 km far.
With this new solution, it would be possible to completely close the circular economy of the area of interest: the final product will be a quality soil improver that can be reused by farms within the market and sold for agricultural purposes.
[1] https://www.rinnovabili.it/ambiente/cop-sui-cambiamenti-climatici-la-storia-666/.
[2] https://www.ilsole24ore.com/art/energia-crescono-consumi-fonti-fossili-emissioni-record-co2-ABBfV6hB?refresh_ce=1.
[3] Bompard, E.F., Deandreis, M., Boccardo, P., Corgnati, S., Profumo, F., Scudieri, P. (2019). ENEMED - MED & ITALIAN ENERGY REPORT - Risorse, flussi e strategie energetiche dell’Italia tra Europa e Mediterraneo. ESL@Energy Center and SRM - Studi e Ricerche per il Mezzogiorno, Torino, Italia.
[4] https://www.labelab.it/ravenna2016/atti/.
[5] Gong, M., Gao, Y., Koh, L., Sutcliffe, C., Cullen, J. (2019). The role of customer awareness in promoting firm sustainability and sustainable supply chain management. International Journal of Production Economics, 217: 88-96. https://doi.org/10.1016/j.ijpe.2019.01.033
[6] http://digitalcommons.pace.edu/lawfaculty/914/.