Tullio de Rubeis* | Giovanni Pasqualoni | Domenica Paoletti | Dario Ambrosini
OPEN ACCESS
The thermal characterization of building envelope materials is a crucial phase in understanding the building energy performance, and it is commonly evaluated through the thermal transmittance, often synthetically indicated as U-value. There are several ways to experimentally assess the U-value of insulating materials and multi-layers systems, usually defined by means of experimental in-situ heat flux measurements, where, however, a considerable variation of the boundary conditions may occur, making the measurement difficult.
In this work, the experimental thermal characterization of different insulating materials applied to an X-lam wall is presented. The analysis is carried out using a Guarded Hot Box, which allowed to reproduce real, repeatable, and controlled operating conditions. Two different insulating materials were selected: expanded polystyrene (EPS) with graphite and hemp. The experimental tests were carried out by imposing a temperature difference reproducing the common operating conditions (0°C in cold chamber and 20°C in hot chamber). Steady-state conditions (constant temperature in the chambers) have been imposed to determine the thermal properties of the multi-layer systems. The tests, lasted 72 hours each, showed U-values equal to 0.15 W/m2K ± 3.1% for EPS with graphite and 0.19 W/m2K ± 3.1% for hemp.
hot box analysis, heat flux, thermal performance, experimental analysis, polystyrene and hemp
The demand for increasingly high-performance buildings is due to the role that the building sector plays in the global energy scenario. Indeed, around 40% of global energy consumption is attributed to buildings [1] resulting in the emission of around 30% of greenhouse gases (GHGs), a value more than doubled since 1970 [2].
In this scenario and considering the expected future climate changes [3], there are increasing efforts to find innovative solutions to optimize the energy performance of buildings. In particular, the opaque envelope, the main cause of heat losses in the energy balance, requires compliance with minimum requirements imposed through thermal transmittance limit values.
The choice of suitable materials becomes a crucial design phase. Particular attention must be paid to insulating materials, the choice of which depends on many factors, including thermal performance (thermal conductivity), environmental impact throughout the life cycle, installation methods, costs, etc.
So, the challenge is to find materials with high thermal performance but low environmental impact, easy to install and low cost. The scientific research in this field is very active. Seng et al. [4] analyzed the behavior of a hemp-based concrete wall under dynamic thermal and hygric solicitations, both via experimental and numerical approach. Dlimi et al. [5] presented the study of thickness optimization of hemp wool insulation in Moroccan building walls by means of Life Cycle Cost Analysis (LCCA) and realized a finite difference model in Matlab by considering a 1D heat equation. An experimental analysis for the thermohygrometric characterization of the performance of wood fiber, mineral wool and hemp-lime applied to wall panels is presented by Latif et al. [6]. The study was carried out in an environmental chamber under steady-state and dynamic conditions. A comparison between empty and filled with hemp fibers prototype walls is discussed by Aversa et al. [7]. The analysis of the thermal behavior under dynamic conditions is carried out by means of an innovative procedure based on stimulated infrared thermography.
In this paper, two different insulating materials are compared: expanded polystyrene (EPS) with graphite, which is widely used due to its thermophysical properties, and hemp, an emerging bio-based material. The comparative analysis was carried out experimentally, under steady-state conditions, using the Guarded Hot Box (GHB).
The paper is divided into 4 sections as follows: the experimental setup and the method employed are presented in Section 2, the results are analyzed and discussed in Section 3, while the main findings of the work are summarized in Section 4.
In this section, the methodology used is explained, starting from the description of the experimental setup, and then describing the approach used to determine the thermal transmittance of the multi-layer plane wall with the insulating materials analyzed.
2.1 Experimental setup
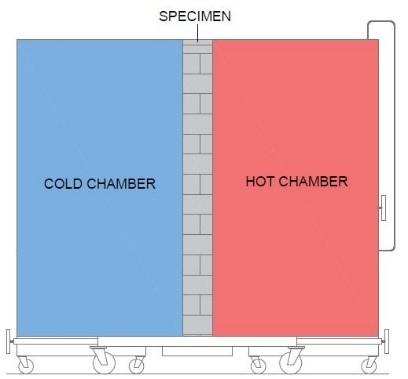
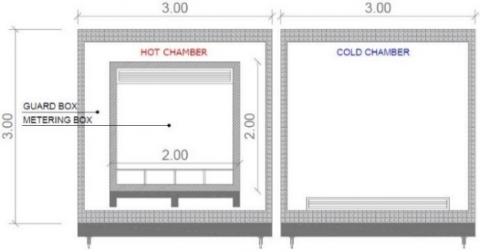
The thermal performance of the selected materials was carried out using the Guarded Hot Box, an apparatus that allows the analysis of full-size samples [8, 9]. The GHB consists of two chambers, hot and cold, between which a temperature difference is set to recreate real operating conditions. The hot chamber is in turn made up of two chambers: a metering box in which the measurements are carried out and a guard box which allows the thermal conditions to be stabilized. The sample to be analyzed is placed between the two chambers and, thanks to the temperature difference, is crossed by a heat flux from which to determine the thermal conductance. The use of the GHB makes it possible to have real, controlled, and repeatable operating conditions, thanks to the presence of electric resistances and chillers installed in the chambers. Figures 1 and 2 show the schematics of the GHB used.
Figure 1. Schematic of the GHB
Figure 2. Inside view of the GHB (dimensions in meters)
2.2 Specimen walls
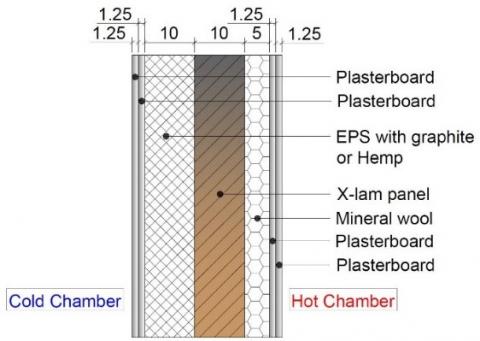
Figure 3. Cross-section of specimen wall (dimensions in centimeters)
The two selected insulating materials (EPS with graphite and hemp) were installed externally to an X-lam wall, internally insulated with mineral wool. Figure 3 shows the cross-section of the wall used for the experimental campaign.
The thermophysical characteristics of the materials are summarized in Table 1 [8-10].
Table 1. Thermophysical properties of the materials
|
Layer |
$\lambda$ [W.m-1. K-1] |
$\rho$ [kg.m-3] |
$C$ [J.kg-1. K-1] |
|
Plasterboard |
0.210 |
900 |
1000 |
|
EPS and graphite |
0.031 |
32 |
1350 |
|
Hemp |
0.040 |
50 |
1700 |
|
X-lam panel |
0.130 |
470 |
1600 |
|
Mineral wool |
0.039 |
135 |
850 |
The theoretical calculation of the thermal transmittance of multi-layer plane wall is carried out using the usual electrical analogy and thermal resistance concept (Eqns. (1) and (2)).
$U=\frac{1}{R_{\text {tot }}}$ (1)
$R_{\text {tot }}=R_{s, \text { out }}+\sum_{j=1}^{n} R_{\text {cond }, j}+R_{s, i n}$ (2)
where $R_{\text {s,out }}$ and $R_{\text {s,in }}$ are equal to 0.04 m2.K.W-1 and 0.13 m2.K.W-1, respectively, as indicated in the standard EN ISO 6946 [11] with horizontal heat flux.
Therefore, the theoretical calculation of multi-layer systems with the materials shown in Table 1 leads to the following results: $\quad \mathrm{U}_{\mathrm{EPS}}=0.17 \mathrm{~W} \cdot \mathrm{m}^{-2} \cdot \mathrm{K}^{-1} \quad \mathrm{e} \quad \mathrm{U}_{\text {Hemp }}=0.19 \mathrm{~W} \cdot \mathrm{m}^{-2} \cdot \mathrm{K}^{-1} .$
2.3 Heat flow meter method
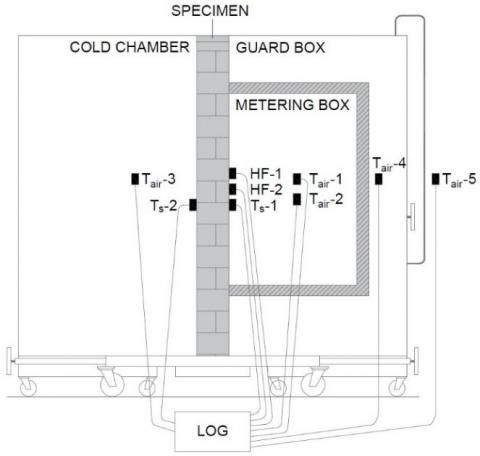
Figure 4. Experimental setup
The experimental campaign was conducted using the Heat Flow Meter (HFM) method. The GHB was equipped with the necessary instrumentation to evaluate the thermal conductance of the multi-layer plane wall in the two considered cases: EPS with graphite (case 1) and hemp (case 2). As shown in Figure 4, the hot side of the sample’s surface was equipped with two heat flux sensors (HF-1 and HF-2) placed at the center of the wall; two surface temperature probes (Ts-1 and Ts-2) were placed on hot and cold sides of the sample’s surfaces. The heat flux sensors were installed using a specific thermal compound to mitigate the effect of contact resistances. Five temperature probes (Tair-1 - Tair-5) were located in the metering box, guard box, cold chamber, and laboratory, to measure the air temperature.
The technical specification of the measuring instruments employed in this work are shown in Table 2.
Table 2. Technical specifications of the measuring instruments
|
Instrument |
Type |
Measuring range |
|
Heat flux sensor |
Hukseflux HFP01 |
-2000 to 2000 W.m-2 |
|
Temperature probes (Surface) |
LSI Lastem EST124-Pt100 |
-50 to +70° |
|
Temperature probes (Air) |
Maxim Integrated DS18B20 |
-55 to +125°C |
|
Hot-wire anemometer |
LSI Lastem ESV107 |
0.01 to 20 m.s-1 |
|
Datalogger |
LSI Lastem M-Log ELO008 |
-300 to +1200 mV |
The measured data have been analyzed following the “Average Method” proposed by the standard ISO 9869 [12], according to which an estimate of the thermal resistance is obtained by Eq. (3).
$R=\frac{\sum_{j=1}^{n}\quad\left(T_{s, i n, j}-T_{s, o u t, j\quad}\right)}{\sum_{j=1\quad}^{n} q_{j}}$ (3)
The conductance is obtained by dividing the mean density of heat flow rate by the mean temperature difference, as shown in Eq. (4).
$\Lambda=\frac{\sum_{j=1\quad}^{n} q_{j}}{\sum_{j=1\quad}^{n}\left(T_{s, i n, j\quad}-T_{s, o u t, j\quad}\right)}$ (4)
Therefore, the U-value can be obtained by Eq. (5).
$U=\frac{\sum_{j=1\quad}^{n} q_{j}}{\sum_{j=1\quad}^{n}\left(T_{i n, j\quad}-T_{\text {out }, j\quad}\right)}$ (5)
2.4 Uncertainty analysis
The uncertainty analysis was performed by using the Holman’s method [13] that allows to determine the combined standard uncertainty for the conductance. According to the Holman’s method, if a set of measures is acquired, the result uncertainty is estimated based on the uncertainties of the primary measurements. If (z) is a given function of the independent variables (x1, x2, .., xn), and (w1, w2, .., wn) are the uncertainties in the independent variables, the result’s uncertainty (wz) is given by Eq. (6).
$w_{z}=\left[\left(\left(\frac{\delta z}{\delta x_{1}} \cdot w_{1}\right)^{2}+\left(\frac{\delta z}{\delta x_{2}} \cdot w_{2}\right)^{2}+. .+\left(\frac{\delta z}{\delta x_{n}} \cdot w_{n}\right)^{2}\right)\right]^{1 / 2}$ (6)
Therefore, the uncertainty on the conductance resulted equal to $w_{\Lambda}$ = 3.1%.
The experimental tests lasted 72 hours each, namely a sufficient period for the heat flux values to converge to asymptotic values close to the real values, with a sampling time of 10 minutes. The first test was carried out on the sample in Figure 3 considering EPS with graphite, while for the second test hemp was installed. The temperature difference between the hot and cold chambers was always set at about 20°C, with 20°C in the hot chamber and 0°C in the cold chamber.
3.1 EPS with graphite
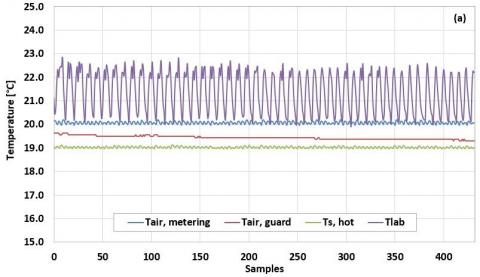
During the first test, the average temperatures shown in Table 3 were measured.
Table 3. Average temperatures during the first test
|
Description |
Value [°C] |
|
Tair,metering |
20.1 ± 0.5 |
|
Tair,guard |
19.4 ± 0.5 |
|
Tair,cold |
-1.2 ± 0.5 |
|
Tlab |
21.4 ± 0.5 |
|
Ts,hot |
19.0 ± 0.1 |
|
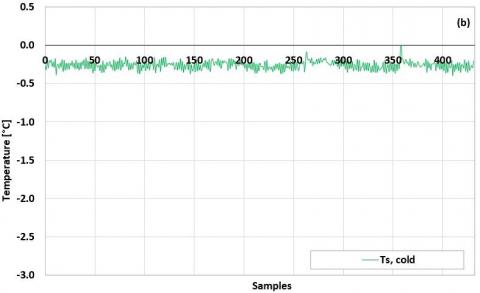
Ts,cold |
-0.3 ± 0.1 |
The measured temperature trends are shown in Figure 5.
Figure 5. Temperature trends: (a) hot chamber; (b) cold chamber
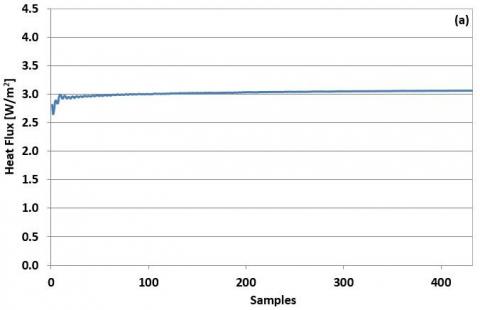
The heat flux was found to be close to 3.0 W.m-2 ± 3.0 %, while the average conductance resulted equal to 0.16 W.m-2.K-1 ± 3.1%. Figure 6 shows the measured heat flux and conductance values.
Figure 6. Heat flux and conductance values during the first test
Considering the surface thermal resistances given in EN ISO 6946 with horizontal heat flux, the thermal transmittance of the wall with EPS with graphite resulted equal to 0.15 W.m-2.K-1 ± 3.1%.
3.2 Hemp
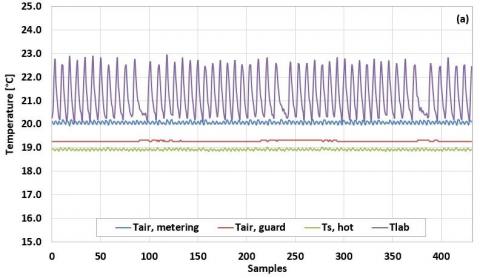
The average temperatures obtained during the second test highlighted slight differences compared to the first test, especially on surface temperatures. Table 4 summarized the results achieved.
Table 4. Average temperatures during the second test
|
Description |
Value [°C] |
|
Tair,metering |
20.1 ± 0.5 |
|
Tair,guard |
19.3 ± 0.5 |
|
Tair,cold |
-0.2 ± 0.5 |
|
Tlab |
21.2 ± 0.5 |
|
Ts,hot |
18.9 ± 0.1 |
|
Ts,cold |
-0.2 ± 0.1 |
Figure 7 shows the temperature trends during the experimental test with hemp.
Figure 7. Temperature trends: (a) hot chamber; (b) cold chamber
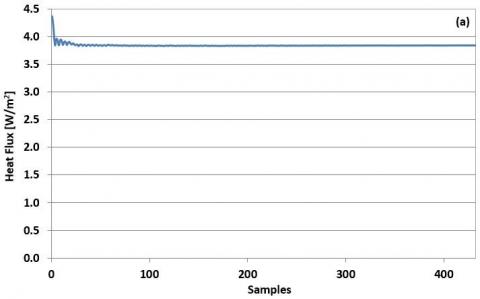
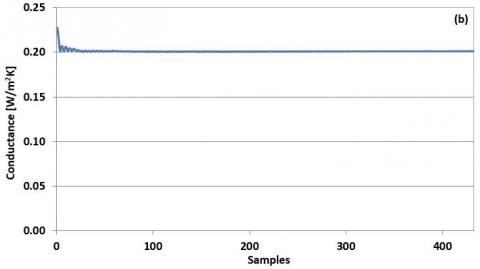
Compared to the first experimental campaign (EPS with graphite), the installation of hemp resulted in a slight increase in the heat flux of the wall, which was found to be approximately 3.8 W.m-2 ± 3.0%, with a thermal conductance equal to 0.20 W.m-2.K-1 ± 3.1%. Figure 8 shows the measured heat flux and conductance values when the hemp is installed.
Figure 8. Heat flux and conductance values during the second test
Therefore, considering the surface thermal resistance values given in the standard EN ISO 6946 with horizontal heat flux, a thermal transmittance value of 0.19 W.m-2.K-1 ± 3.1% is obtained.
3.3 Results comparison
Comparing the results obtained with the two insulating materials, a better thermal performance is observed in the case of EPS with graphite, with which a lower exchanged heat flux (3.0 W.m-2 ± 3.0%) and U-value (0.15 W.m-2.K-1 ± 3.1%) are obtained. The installation of hemp leads to an increase in heat flux (3.8 W.m-2 ± 3.0 %) and thermal transmittance (0.19 W.m-2.K-1 ± 3.1%), which is 27.5% higher than the U-value found in the case of EPS with graphite. Table 5 summarizes the comparison of the main results obtained.
Table 5. Results comparison
|
Description |
EPS with graphite |
Hemp |
|
Ts,hot [°C] |
19.0 ± 0.1 |
18.9 ± 0.1 |
|
Ts,cold [°C] |
-0.3 ± 0.1 |
-0.2 ± 0.1 |
|
Heat flux [W.m-2] |
3.0 ± 3.0 % |
3.8 ± 3.0 % |
|
$\Lambda$ [W.m-2.K-1] |
0.16 ± 3.1 % |
0.20 ± 3.1 % |
|
U [W.m-2.K-1] |
0.15 ± 3.1 % |
0.19 ± 3.1 % |
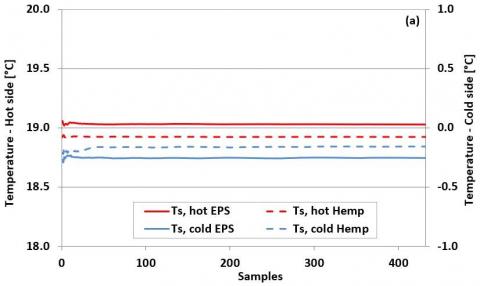
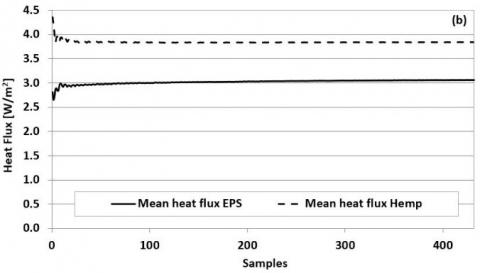
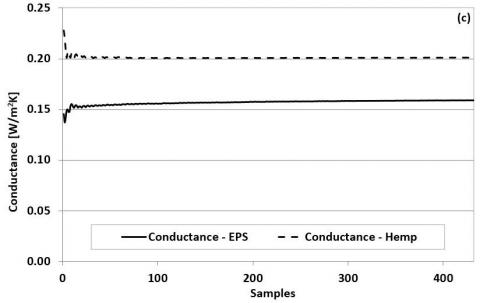
Graphically (Figure 9), the comparison between the two cases shows the better thermal performance of the wall with EPS with graphite.
Figure 9. Results comparison: (a) surface temperatures; (b) heat fluxes; (c) conductances
In this work, the comparison between the thermal performance of an X-lam wall with two different insulating materials (EPS with graphite and hemp) was presented. The experimental campaigns permitted the evaluation of the insulating capacities of the two materials, thanks to the use of a Guarded Hot Box that allowed the comparative analysis under the same boundary conditions. The performance analysis was carried out using the HFM method, the results of which showed that, with the same thickness, the use of EPS with graphite determines better thermal performance with transmittance values of 0.15 W.m-2.K-1 ± 3.1% compared to 0.19 W.m-2.K-1 ± 3.1% obtained with hemp. Therefore, in purely energy terms, EPS with graphite would be the most convenient choice; however, the bio-based nature of hemp together with its good thermal performance could lead to the choice of this increasingly popular material.
Future developments of this work include a performance comparison with other innovative insulating material.
|
c |
specific heat capacity, J. kg-1. K-1 |
|
GHB |
guarded hot box |
|
GHG |
greenhouse gas |
|
EPS |
expanded polystyrene |
|
HF |
heat flux |
|
HFM |
heat flow meter |
|
LCCA |
life cycle cost analysis |
|
q |
heat flux, W. m-2 |
|
R |
thermal resistance, m2. K. W-1 |
|
T |
temperature, K. |
|
U |
thermal transmittance, W. m-2. K-1 |
|
Greek symbols |
|
|
$\lambda$ |
thermal conductivity, W. m-1. K-1 |
|
$\rho$ |
density, kg. m-3 |
|
$\Lambda$ |
conductance, W. m-2. K-1 |
|
Subscripts |
|
|
cond |
conduction |
|
in |
inside |
|
j |
j-th |
|
out |
outside |
|
s, in |
surface, inside |
|
s, out |
surface, outside |
|
tot |
total |
[1] International Energy Agency (IEA). (2016). World Energy Outlook. IEA, Paris, France.
[2] International Energy Agency (IEA). (2012). CO2 Emissions from Fuel Combustion. Beyond 2020 Online Database. IEA, Paris, 135.
[3] de Rubeis, T., Falasca, S., Curci, G., Paoletti, D., Ambrosini, D. (2020). Sensitivity of heating performance of an energy self-sufficient building to climate zone, climate change and HVAC system solutions. Sustainable Cities and Society, 61: 102300. https://doi.org/10.1016/j.scs.2020.102300
[4] Seng, B., Magniont, C., Gallego, S., Lorente, S. (2021). Behavior of a hemp-based concrete wall under dynamic thermal and hygric solicitations. Energy and Buildings, 232: 110669. https://doi.org/10.1016/j.enbuild.2020.110669
[5] Dlimi, M., Iken, O., Agounoun, R., Zoubir, A., Kadiri, I., Sbai, K. (2019). Energy performance and thickness optimization of hemp wool insulation and air cavity layers integrated in Moroccan building walls. Sustainable Production and Consumption, 20: 273-288. https://doi.org/10.1016/j.spc.2019.07.008
[6] Latif, E., Lawrence, R.M.H., Shea, A.D., Walker, P. (2018). An experimental investigation into the comparative hygrothermal performance of wall panels incorporating wood fibre, mineral wool and hemp-lime. Energy and Buildings, 165: 76-91. https://doi.org/10.1016/j.enbuild.2018.01.028
[7] Aversa, P., Palumbo, D., Donatelli, A., Tamborrino, R., Ancona, F., Galietti, U., Luprano, V.A.M. (2017). Infrared thermography for the investigation of dynamic thermal behaviour of opaque building elements: Comparison between empty and filled with hemp fibres prototype walls. Energy and Buildings, 152: 264-272. http://dx.doi.org/10.1016/j.enbuild.2017.07.055
[8] de Rubeis, T., Muttillo, M., Nardi, I., Pantoli, L., Stornelli, V., Ambrosini, D. (2019). Integrated measuring and control system for thermal analysis of buildings components in hot box experiments. Energies, 12(11): 2053. http://dx.doi.org/10.3390/en12112053
[9] De Rubeis, T., Nardi, I., & Muttillo, M. (2017). Development of a low-cost temperature data monitoring. An upgrade for hot box apparatus. In Journal of Physics: Conference Series, 923(1): 012039. http://dx.doi.org/10.1088/1742-6596/923/1/012039
[10] Nardi, I., de Rubeis, T., Taddei, M., Ambrosini, D., Sfarra, S. (2017). The energy efficiency challenge for a historical building undergone to seismic and energy refurbishment. Energy Procedia, 133: 231-242. http://dx.doi.org/10.1016/j.egypro.2017.09.357
[11] Iso, E. (2007). Building components and building elements–thermal resistance and thermal transmittance–calculation method.
[12] EN ISO 9869-1. (2014). Thermal Insulation—Building Elements—In-Situ Measurement of Thermal Resistance and Thermal Transmittance, Part 1: Heat Flow Meter Method.
[13] Holman, J.P. (1966). Experimental Methods for Engineers. 8th ed. McGraw-Hill Series in Mechanical Engineering. McGraw-Hill: New York, USA. ISBN: 13 978-0-07-352930-1