Guglielmina Mutani* | Valeria Todeschi
OPEN ACCESS
The use of smart green technologies such as solar panels or green roofs on the top of buildings are identified as low-carbon infrastructure strategies. This work examines the roofs’ potential in a densely built-up context, analyzing the effects of smart green technologies on energy savings and thermal comfort conditions at district scale. The methodology presented can be used to accurately estimate solar energy potential and green roof potential on existing building stock at national, municipal, district and building level, with direct application in energy efficiency policy design. With the support of a place-based approach, the methodology was applied to a district in the city of Turin (Italy). A 3D model was created, some scenarios have been investigated, and priorities of interventions have been established mapping the spatial distribution of different parameters. From the results, it is emerged that there is a significant potential in Turin, and the use of green technologies especially in critical areas with solar technologies can promote a more sustainable development of the city. Solar modules and green roofs have been used alternatively to maximize the benefits. The applicability of these technologies can be integrated in the Municipal Energy-Environmental annex of the Building Regulations of the city of Turin.
energy savings, green technologies, solar renewable source, buildings regulation, resilient city, place-based approach
The “Clean Energy for all Europeans Package” encourages all member states to achieve energy efficiency, to improve the use of renewables, and to promote a sustainable development of their countries. These objectives were implemented in Italy in December 2019 with the publication of the “Integrated National Plan for Energy and Climate”. This plan considers a new energy model that combines economic development and environmental sustainability through the energetic, environmental, and economic impacts of the construction sector for each territory.
The decrease of energy consumptions in buildings is one of the measures to improve the livability and quality of cities reducing greenhouse gas emissions (GHG) and mitigating the urban heat island (UHI) effect [1, 2]. These emissions are in most part from non-renewable energy sources and the use of smart green technologies has become a viable cleaner alternative [3]. Therefore, the role of renewable energy sources (RES) such as the solar energy for sustainable energy production in cities is of the utmost importance [4]. These technologies are able to promote the livability of cities, to improve the quality of life reducing the energy consumption and GHGs in buildings, exploiting the RES, and mitigating the UHI effect [5, 6]. In addition, green-roof technologies, which have high thermal inertia technology, guarantee an excellent thermal behavior in both heating and cooling seasons with consequent good thermal comfort conditions [7-10]. Moreover, the combination of green roof and green walls improves buildings performance with a significant reduction in thermal consumptions [11].
In this work, the use of photovoltaic (PV) panels, solar thermal (ST) collectors and green-roofs technologies that provide environmental benefits [12, 13] have been investigated for different districts (‘mesh’ with a dimension of 1 km x 1 km). The paper illustrates a place-based approach for assessing thermal and electrical monthly energy consumptions, usable solar energy potential of residential and non-residential buildings in order to promote the use of RES and the self-consumption, green roofs potential to improve the indoor and outdoor thermal conditions reducing thermal energy consumption.
The use of Geographic Information Systems (GIS) is fundamental for a place-based approach to analyse and design green technologies in sustainable-smart cities [14]. In several researches [4, 15-19] a GIS software has been used to determine the available rooftop area of a territory, identify obstructions or assess shadow effects on buildings, evaluate and map solar irradiation in urban areas, assessing energy consumption in buildings. In this work, a territorial database (DBT) using ArcGIS 10.7 has been organized in three main stages: (i) creation of 3D-building model for roofs analysis and classification, (ii) solar energy potential assessment, (iii) green roof potential assessment. Summing up, the aim of this research has attempted to address the following issues:
In this study, the concept of territorial energy resilience is developed considering: a territory environmentally, economically, and socially healthy; with energy efficient systems and energy saving technologies; exploiting the available renewable energy sources with low greenhouse gas emissions; and with an optimization model for demand-supply management [20, 21].
The methodology presented should help policy makers and local authorities for implementing energy management strategies in their urban areas, but also citizens in the reduction of consumption in dwellings participating in the energy market. To achieve a sustainable and resilient development of cities there is no one solution, but different strategies and technologies. In future research, other smart-green measures will be considered on the evaluation of energy savings and thermal comfort conditions, such as white roofs and vertical green walls.
In this section, the input data and methodology used to examine roofs’ potential in a densely built-up context have been presented. A place-based model has been developed to improve energy management of buildings using smart green technologies – solar panels, collectors and green roofs – on the top of buildings in order to identify low-carbon infrastructure strategies. The described approach has been applied to a case study of the city of Turin, in Italy. Energy consumptions of buildings sector with monthly detail have been assessed at districts scale, and roofs suitability has been investigated to evaluate usable solar energy and potential green roofs.
This methodology has been proven to be flexible and easily applicable in different districts and neighborhoods. On one hand, some neighborhoods and/or buildings are better suited for solar active technologies, where energy that can be produced using PV panels and ST collectors. On the other hand, some areas are more suited for installing green technologies like intensive and extensive green roofs.
2.1 Input data collection and processing
A georeferenced territorial database (DBT) was organized using ArcGIS 10.7, and a 3D-roof model for buildings has been created. The DBT includes:
2.2 Methodology for roofs analysis
With the presented approach is possible to classify roofs according to material, height, area, slope, orientation, and hours of sunlight. According to Zheng et al. [28], a 3D-roof model for each building was reconstructed according to the input data of the entire city. After this first analysis, the roofs’ potential in a densely built-up context has been assessed analyzing also the effects of smart green technologies on energy savings and thermal comfort conditions in the buildings’ sector. In the following sub-sections, the methodology used to create a 3D-roof model, and to assess solar energy and green roofs potential has been investigated.
2.2.1 Roofs analysis and classification
The potential of roof retrofitting depends on: the structural static capacity of the buildings, the cover material and the physical aspects of the roof, such as the available surface and inclination [28]. In addition, the local built environment plays a significant role in urban areas, due to the shadowing effects of the surrounding buildings [29].
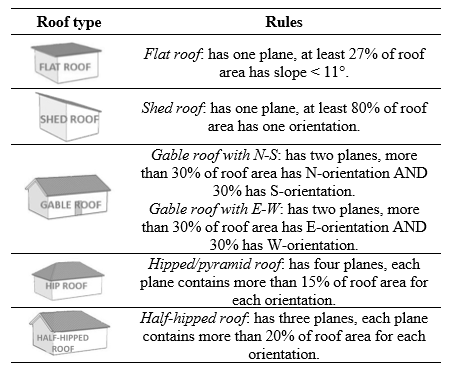
Starting from previous research [7], a simple approach was developed to rapidly quantify the roof areas with a 3D-model. This method allows to classify the geometry of roofs for large amount of areas, according to solar energy and green-roof design criteria, as input for the planning process. Figure 1 shows the main steps for roofs classification, and in Table 1 the rules for roof type determination have been indicated.
Figure 1. GIS-based methodology for roofs classification
Table 1. Roof type classification [28]
In particular, a 3D analysis was carried out according to the following steps:
Taking into account slope values, pitched roofs were classified into five categories: gable roofs with north-south orientation, gable roofs with east-west orientation, hipped/pyramid roofs, shed roof, half-hipped roof [28].
2.2.2 Solar energy potential assessment
The solar energy potential has been investigated identifying the available rooftop areas and quantifying the total solar radiation on the rooftop (Figure 2). Therefore, the solar energy that can be produced from the monthly solar radiation has been estimated at urban scale for each building according to its technical potential. The hypothesized panels’ area was assessed considering the area of the roofs with better solar exposition. According to the literature review [15, 31-33] the criteria used to identify suitable rooftops for solar panels and collectors are:
Therefore, the annual and monthly solar radiation have been calculated using the ‘Area solar radiation’ tool in ArcGIS in order to identify available roofs areas. From ‘Photovoltaic Geographical Information System PVGIS’ portal of JRC, the monthly data of atmosphere transparency (τ) and ratio of diffuse radiation to global radiation (ω) have been identified for the specific territory. The solar potential assessment considers the monthly shadows of all obstructions. The quota of annual and monthly incident global solar radiation was quantified with a precision of 0.5 meters using the DSM of the entire city.
Regarding PV productivity, the efficiency of converting solar energy into electricity varies mainly according to the photovoltaic module technology chosen. In this work, the efficiency value is equal to 15% (standard efficiency polycrystalline silicon module), and the system performance, that consider the energy losses of all system components, is estimated to be around 75%.
Regarding ST productivity, the ST collectors used had a variable monthly efficiency of 43-75% and a system performance ratio of 75%.
The hypothesized PV and ST areas have been dimensioned in order to not have an overproduction of thermal and electrical energy during summer months.
2.2.3 Green roofs potential assessment
This section presents a flexible approach that allows to evaluate the presence of existing and potentially future green roofs [7]. Various tools were integrated in ArcGIS to produce accurate land cover and vegetation maps. The first step was an analysis of the green areas and vegetation of outdoor urban spaces, the second one was a 3D evaluation of built-up environment and finally the green roofs potential assessment. The following criteria were used to select the potential green roofs (Figure 2):
Figure 2. GIS-based methodology for roofs potential assessment
The building roofs were thus classified into three typologies: existing green roofs, potential green roofs, and non-potential green roofs. According to the slope, two typologies of potential roofs were identified: intensive green roofs (flat roofs) that not require special structure measures, and extensive green roofs (pitched roofs).
2.3 Monthly engineering energy model application
The energy consumption of buildings has been simulated using a monthly engineering model [35, 36] in order to identify the most critical areas and evaluate the energy savings after the installation of the green technologies analyzed in this work.
The following subsections present urban-scale energy models used to estimate thermal (both for heating and domestic hot water) and electrical consumptions in order to size PV panels and ST collectors. Solar energy potential was compared to energy demand per district (mesh of 1 km2). The decrease of non-renewable thermal and electricity needs has been estimated considering both possible installations of PV and ST systems (self-consumption).
2.3.1 Energy consumptions assessment
Energy consumptions for space heating and domestic hot water of residential buildings with monthly detail have been simulated at district level (‘mesh’ with a dimension of 1 km2) for three consecutive heating seasons (2012-13, 2013-14 and 2014-15). This analysis was made using a monthly engineering energy model [35, 36] able to predict thermal consumptions at urban area (case study dimension: 38 km2, 30% of the city area with 545,696 inhabitants).
Thermal consumptions for space heating and domestic hot water of non-residential buildings have been assessed according to Mutani and Todeschi [37], using a hybrid approach matching bottom-up, top-down and engineering models. In this case, annual thermal consumptions have been distributed during months according to the number of days and the temperatures variation between the internal building air temperature and the external air temperature (climate data refer to the nearest weather station).
Electrical consumptions for residential and non-residential sectors have been quantified considering a typical family with a certain number of components and: (i) the average consumption of an Italian family of about 2,700 kWhel/year and the number of families available from ISTAT database (2011); (ii) the annual consumption of 2,049 kWh/year from Regional Database for the reference year 2014 [38]. The annual electrical consumptions have been distributed during months according to the number of workdays and holidays.
2.3.2 Energy savings and thermal comfort assessment
The impact of PV panels, ST collectors and green-roofs technologies on energy savings and on indoor and outdoor thermal comfort has been assessed. Regarding solar technologies, the electrical and thermal consumptions were compared with the PV and ST potential production. Regarding green-roofs technologies, thermal comfort conditions and energy savings have been quantified before and after the installation of these technologies. In addition, some parameters have been used to describe the UHI mitigation –the ‘Normalized Difference Vegetation Index’ NDVI, the albedo, and ‘Land Surface Temperature’ LST– thermal conditions of buildings and urban environments.
Three scenarios have been investigated:
The effects of smart green technologies on energy savings and thermal comfort conditions in the buildings’ sector have been analyzed at territorial level for the city of Turin. From the results, it is emerged that the use of green technologies in critical areas can promote a more sustainable development of the city.
Accordingly, considering the shape, the slope, the orientation of roofs, the presence of obstacles and the shadings due to the built environment, results show that: (i) some neighborhoods are better suited for solar power deployment, in which the energy that can be produced using photovoltaic panels and solar collectors was assessed; (ii) while other areas are more suited for installing green roof technologies: intensive and extensive green roofs.
3.1 Model application
The methodology presented in this work has been applied to ‘Pozzo Strada’ district in the city of Turin, and the results have been calculated for a mesh with a dimension of 1 km2 with 21,520 inhabitants.
3.1.1 Roofs analysis and classification
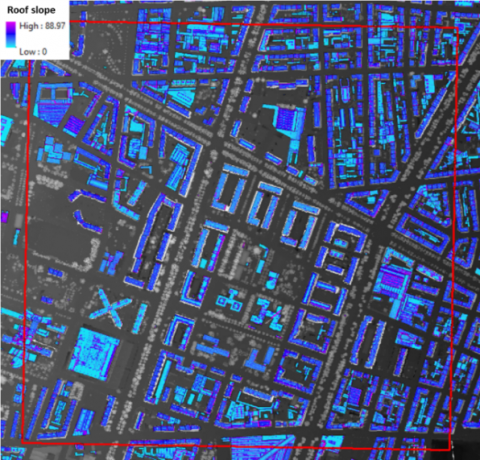
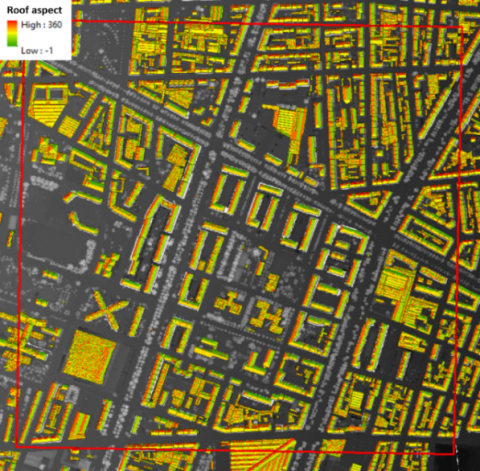
The roofs of over 700 buildings in the city of Turin have been analyzed and classified according to their geometric characteristics. Figures below show the main steps necessary for the building’s categorization: evaluation of the roof slope (Figure 3); evaluation of roof surfaces considering eight orientations (Figure 4); classification of roofs into six categories (Figure 5).
Figure 3. Roof slope analysis (slope, degree)
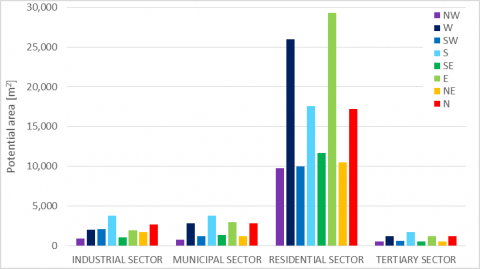
The 16% of buildings have flat roofs, only the 2% have shed roof, half-hipped and hipped/pyramid are respectively the 3% and the 8%, the gable roofs represents as much as 70% of the roofs, typical for residential buildings in Turin. In the analyzed district the 79% of buildings are residential. According to four building sectors – industrial, municipal, residential and tertiary – the main results of roof orientation analysis were indicated in Table 2 and Figure 6. It is possible to observe that a large quota of residential buildings has an optimal orientation for solar energy production (E-W).
Figure 4. Roof aspect analysis (orientation, degree)
Figure 5. Roof classification (type of roof)
Table 2. Roof analysis for a district in Turin (IT) with a dimension of 1 km2 and values for the entire city are indicated in brackets
|
Sector |
No build. |
Flat roof [103 m2] |
Pitched roof [m2] |
Slope pitch. roof [°] |
Main orientation |
Suitable roof areas [m2] |
|
Ind. |
70 (4950) |
17 (2,138) |
17 (3,574) |
17 (20) |
N-S (N-S) |
19,533 |
|
Mun. |
53 (5561) |
8 (748) |
18 (1,292) |
21 (24) |
S-E (N-S) |
15,672 |
|
Res. |
572 (44224) |
20 (870) |
139 (8,670) |
25 (25) |
E-W (N-S) |
93,172 |
|
Ter. |
33 (4109) |
20 (1,160) |
8 (710) |
13 (24) |
S-E (N-S) |
15,949 |
Figure 6. Areas of pitched roof distinguishing eight orientations and four building sectors
3.1.2 Solar energy potential assessment
In this analysis, the sun and sky models were elaborated with the support of GIS tool ‘Area solar radiation’ considering the monthly data of atmosphere transparency (τ) and ratio of diffuse radiation to global radiation (ω) identified from the ‘Photovoltaic Geographical Information System PVGIS’ of JRC [20] (in Table 3).
Table 3. Monthly sun and atmosphere characteristics
|
Month |
01 |
02 |
03 |
04 |
05 |
06 |
|
ω [-] |
0.46 |
0.40 |
0.35 |
0.38 |
0.41 |
0.40 |
|
τ [-] |
0.46 |
0.58 |
0.64 |
0.66 |
0.71 |
0.74 |
|
Month |
07 |
08 |
09 |
10 |
11 |
12 |
|
ω [-] |
0.41 |
0.45 |
0.38 |
0.46 |
0.49 |
0.40 |
|
τ [-] |
0.73 |
0.69 |
0.66 |
0.56 |
0.46 |
0.42 |
Figure 7. Monthly solar radiation (Wh/m2/month)
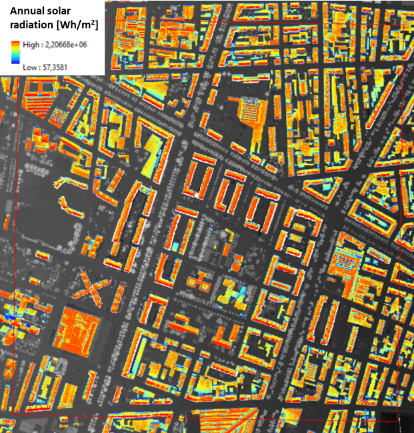
Figure 8. Annual solar radiation (Wh/m2/year)
In Figure 7 monthly results have been indicated for some months, where the solar radiation values are obviously higher in summer, compared to winter, and the Figure 8 shows the values of annual solar radiation (Wh/m2/y) calculated for a district.
3.1.3 Green roofs potential assessment
Potential green roofs have been identified according to roof typology (Figure 9). In particular, on 109 buildings, the quota of flat roofs identified as potential is equal to 64,458 m2, while the potential pitched roofs with a slope less than 20° represent a small potential of 2,629 m2.
Figure 9. Potential green roofs
3.2 Energy savings and thermal comfort assessment
The results of the three scenarios analyzed are presented below (Figures 10, 11, 12, 13).
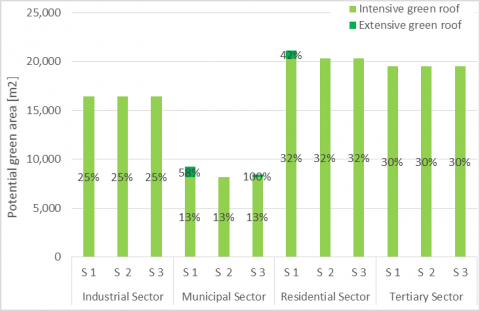
In the first scenario, the maximum green potential roofs have been exploited and the 28% of the total roof areas (237,461 m2) have been identified as potential of green roofs. The ST collectors and PV modules have been dimensioned according to the consumption of residential and non-residential users (domestic hot water and electrical consumptions).
In scenarios 2 and 3 the roofs identified as potential green roofs decreased in favor of the use of PV and ST technologies, and the percentage of green roofs compared to the total roof areas is 27%. The ST production have been dimensioned (as scenario 1), and there is an overproduction from PV modules from June to August, with a surplus of 9% in the scenarios 2 and 3.
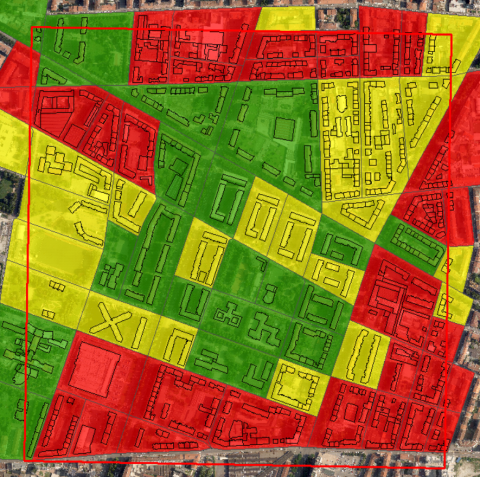
In the third scenario, critical areas have been identified (Figure 10) and, in these zones, green roof technologies have been assessed; in the other areas ST collectors and PV panels have been dimensioned considering residential and non-residential demand.
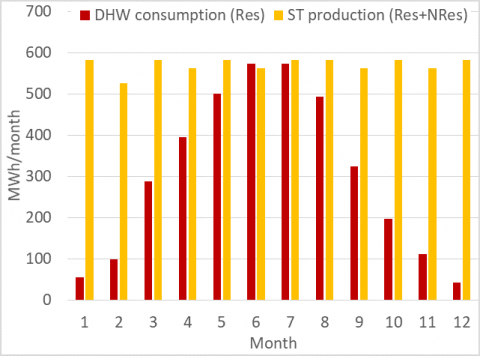
According to literature review [7, 39], in scenario 1, the energy saving after the installation of green roofs is equal to 1,669 MWh/year, which corresponds to 2% of thermal consumptions of residential and non-residential buildings for space heating and domestic hot water production. In the other two scenarios (2 and 3), energy savings are 1.5%. Regarding ST collectors, the domestic hot water consumptions cover on average 53% of consumption, the percentage reaches 100% during the summer months (in June and July), while in the winter months (December and January) ST production is able to cover about 10% of the residential consumptions (in Figure 12).
Figure 10. Scenario 3: Building block classification according to three classes of thermal comfort conditions (green: Good, yellow: Acceptable, red: Bad)
Figure 11. Scenarios 1-2-3: Analysis results of the potential intensive (flat roof) and extensive (pitched roof) green roofs
Figure 12. Scenarios 1-2-3: Analysis results of the rooftop ST collectors (monthly solar productivity)
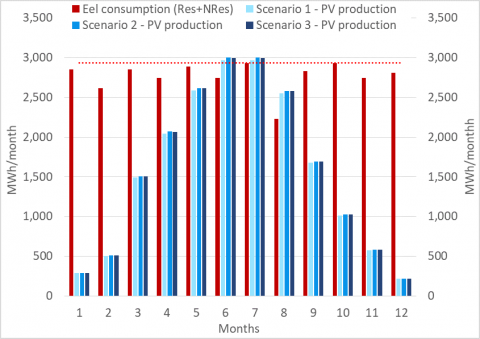
Figure 13. Scenarios 1-2-3: Analysis results of the rooftop PV panels (monthly solar productivity)
As regards electricity consumptions, in scenario 1, PV production covers on average 57% of residential and non-residential electricity consumption (in the summer months it covers 100%, in the winter months 9%). In scenarios 2 and 3 there is an overproduction of 9% in the months from June to August, on average the 58% of the annual electricity demand are covered.
As previously mentioned, in addition to the reduction in consumption and GHG emissions, green roofs contribute to an improvement of indoor and outdoor thermal comfort conditions, improving the livability of outdoor urban areas. There are some parameters which allow to describe the UHI effect and the climate/local-climate characteristics of urban environment. According to other studies [40, 41], LST and the air temperature tend to decrease more or less rapidly as the green areas increase, depending also on the type of urban morphology.
According to previous researches [7, 41] the local climate conditions can been investigated using the LST. From the first scenario, where the green roofs areas is 66,302 m2, compared to the other two scenarios (with on average 64,500 m2 of green roofs) the difference in LST temperature could be 0.5°C [7].
3.3 Energy and environmental regulations
The feasibility of energy efficiency interventions has been assessed considering energy and environmental regulations for the city of Turin:
Three conditions were investigated for the installation of smart green technologies (according to National Decree 28/2011 and Ministerial Decree 2015/06/26).
The roofs albedo in the district analyzed varies between 0.15 and 0.26 (for few buildings, mainly industrial, the albedo is 0.33) [42]. After retrofit measures with green roofs, the roof albedo criterion is respected due to the installation of passive summer air conditioning technology (i).
Regarding ST collectors’ installation, the following criterion has been verified (ii): at least the 50% of the annual domestic hot water consumption must be covered by the ST production; in this analysis the 53% have been covered for the three scenarios.
The third criterion, that has been verified, concerns the production of electricity from PV panels (iii). The installed electric power (in kW) must be greater than or equal to P, where P is (1/50)·S and S is the footprint area of the building (m2). The criterion was verified for the three scenarios. According to the installed power and the annual utilization hours of use, which for the Piedmont region are 1,130 hours [43], the electricity produced from PV panels was assessed. Therefore, knowing that a typical Turin family needs 2,049 kWh/year for electricity supply and, in the district analysed, the number of families is equal to 10,638 (ISTAT data), in the first scenario 91% of the annual residential electrical consumption have be covered, and the 100% for the other two scenarios has been reached.
The energy efficiency policies and low-carbon strategies on new buildings are not enough to significantly decrease the energy consumptions of a district or neighborhood, and it is necessary include the renovation of existing building stocks that have a significant impact on the energy savings and UHI mitigation of a city. There is no one solution, but different low-carbon strategies and smart green technologies should be used depending on the constraints, regulations, buildings and urban morphology.
The place-based assessment presented in this work can evaluate the available solar irradiation on the building’s roofs, existing and potential green roofs with the relative energy savings, and the relationship between the climate and the new vegetated areas in the urban environment. In addition, the monthly engineering model –used to estimate the thermal energy consumption of buildings– have been implemented considering the attics inhabited and therefore heated; this upgrade consented to correct the heated volumes and the dispersing surfaces of the buildings according to the presence of disturbing elements of the rooftop.
Further developments on this topic will be investigated, and other effective green and renewable technologies will be identified. The goal is to provide a platform, such as an energy atlas, to help stakeholders, citizens, urban planners and policy makers to plan sustainable cities and smart energy systems, and to obtain information, at different scales, about energy consumptions, production, emissions and thermal comfort conditions.
The authors are grateful to: Piedmont Region and Municipality of Turin for having shared their technical cartography and databases; district heating Iren Company for having provided the energy consumption of Turin; R3C and FULL centers for having supported this research project.
[1] Li, X., Zhou, Y., Yu, S., Jia, G., Li, H., Li, W. (2019). Urban heat island impacts on building energy consumption: A review of approaches and findings. Energy, 174: 407-419. https://doi.org/10.1016/J.ENERGY.2019.02.183
[2] Faroughi, M., Karimimoshaver, M., Aram, F., Solgi, E., Mosavi, A., Nabipour, N., Chau, K.W. (2020). Computational modeling of land surface temperature using remote sensing data to investigate the spatial arrangement of buildings and energy consumption relationship. Engineering Applications of Computational Fluid Mechanics, 14(1): 254-270. https://doi.org/10.1080/19942060.2019.1707711
[3] Lukač, N., Seme, S., Dežan, K., Žalik, B., Štumberger, G. (2016). Economic and environmental assessment of rooftops regarding suitability for photovoltaic systems installation based on remote sensing data. Energy, 107: 854-865. https://doi.org/10.1016/J.ENERGY.2016.04.089
[4] Khan, J., Arsalan, M.H. (2016). Estimation of rooftop solar photovoltaic potential using geo-spatial techniques: A perspective from planned neighborhood of Karachi–Pakistan. Renewable energy, 90: 188-203. https://doi.org/10.1016/J.RENENE.2015.12.058
[5] Santamouris, M., Ban-Weiss, G., Osmond, P., Paolini, R., Synnefa, A., Cartalis, C., Tan, Z. (2018). Progress in urban greenery mitigation science–assessment methodologies advanced technologies and impact on cities. Journal of Civil Engineering and Management, 24(8): 638-671. https://doi.org/10.3846/jcem.2018.6604
[6] Aram, F., Solgi, E., Higueras García, E., Mosavi, A., Várkonyi-Kóczy, A.R. (2019). The cooling effect of large-scale urban parks on surrounding area thermal comfort. Energies, 12(20): 3904. https://doi.org/10.3390/en12203904
[7] Mutani, G., Todeschi, V. (2020). The Effects of Green Roofs on Outdoor Thermal Comfort, Urban Heat Island Mitigation and Energy Savings. Atmosphere, 11(2): 123. https://doi.org/10.3390/atmos11020123
[8] Ng, E., Chen, L., Wang, Y., Yuan, C. (2012). A study on the cooling effects of greening in a high-density city: An experience from Hong Kong. Building and environment, 47: 256-271. https://doi.org/10.1016/J.BUILDENV.2011.07.014
[9] Cascone, S., Catania, F., Gagliano, A., Sciuto, G. (2018). A comprehensive study on green roof performance for retrofitting existing buildings. Building and Environment, 136: 227-239. https://doi.org/10.1016/J.BUILDENV.2018.03.052
[10] Mutani, G., Casalengo, M., Ramassotto, M.A. (2018). The effect of roof-integrated solar technologies on the energy performance of public buildings: The case study of the City of Turin (IT). In 2018 IEEE International Telecommunications Energy Conference (INTELEC), 1-8. https://doi.org/10.1109/INTLEC.2018.8612398
[11] Wilkinson, S., Feitosa, R.C., Kaga, I.T., De Franceschi, I.H. (2017). Evaluating the thermal performance of retrofitted lightweight green roofs and walls in Sydney and Rio de Janeiro. Procedia Engineering, 180: 231-240. https://doi.org/10.1016/J.PROENG.2017.04.182
[12] Schindler, B.Y., Blaustein, L., Lotan, R., Shalom, H., Kadas, G.J., Seifan, M. (2018). Green roof and photovoltaic panel integration: Effects on plant and arthropod diversity and electricity production. Journal of environmental management, 225: 288-299. https://doi.org/10.1016/J.JENVMAN.2018.08.017
[13] Shafique, M., Kim, R., Rafiq, M. (2018). Green roof benefits, opportunities and challenges–a review. Renewable and Sustainable Energy Reviews, 90: 757-773. https://doi.org/10.1016/J.RSER.2018.04.006
[14] Crnčević, T., Tubić, L., Bakić, O. (2017). Green infrastructure planning for climate smart and "green" cities. Spatium, 38: 35-41. https://doi.org/10.2298/SPAT1738035C
[15] Suomalainen, K., Wang, V., Sharp, B. (2017). Rooftop solar potential based on LiDAR data: Bottom-up assessment at neighbourhood level. Renewable Energy, 111: 463-475. https://doi.org/10.1016/J.RENENE.2017.04.025
[16] Erdélyi, R., Wang, Y., Guo, W., Hanna, E., Colantuono, G. (2014). Three-dimensional SOlar RAdiation Model (SORAM) and its application to 3-D urban planning. Solar Energy, 101: 63-73. https://doi.org/10.1016/J.SOLENER.2013.12.023
[17] Groppi, D., de Santoli, L., Cumo, F., Garcia, D.A. (2018). A GIS-based model to assess buildings energy consumption and usable solar energy potential in urban areas. Sustainable Cities and Society, 40: 546-558. https://doi.org/10.1016/J.SCS.2018.05.005
[18] Basso, G.L., Rosa, F., Garcia, D.A., Cumo, F. (2018). Hybrid systems adoption for lowering historic buildings PFEC (primary fossil energy consumption)-a comparative energy analysis. Renewable Energy, 117: 414-433. https://doi.org/10.1016/j.renene.2017.10.099
[19] Sun, S., Xu, X., Lao, Z., Liu, W., Li, Z., García, E.H., Zhu, J. (2017). Evaluating the impact of urban green space and landscape design parameters on thermal comfort in hot summer by numerical simulation. Building and Environment, 123: 277-288. https://doi.org/10.1016/j.buildenv.2017.07.010
[20] Mutani, G., Todeschi, V. (2018). Energy resilience, vulnerability and risk in urban spaces. Journal of Sustainable Development of Energy, Water and Environment Systems, 6(4): 694-709. https://doi.org/10.13044/J.SDEWES.D6.0211
[21] Mutani, G., Todeschi, V., Beltramino, S. (2020). Energy consumption models at urban scale to measure energy resilience. Sustainability, 12, 5678. https://doi.org/10.3390/su12145678
[22] Mutani, G., Todeschi, V., Matsuo, K. (2019). Urban heat island mitigation: A GIS-based Model for Hiroshima. Instrum. Mes. Metrol, 18(4): 323-335. https://doi.org/10.18280/i2m.180401
[23] Mutani, G., Todeschi, V., Grisolia, G., Lucia, U. (2019). Introduction to constructal law analysis for a simplified hourly energy balance model of residential buildings at district scale. TI-Italian Journal of Engineering Science, 63(1): 13-20. https://doi.org/10.18280/ti-ijes.630102
[24] Mutani, G., Todeschi, V., Kämpf, J., Coors, V., Fitzky, M. (2018). Building energy consumption modeling at urban scale: three case studies in Europe for residential buildings. In 2018 IEEE International Telecommunications Energy Conference (INTELEC), pp. 1-8. https://doi.org/10.1109/INTLEC.2018.8612382
[25] Guelpa, E., Mutani, G., Todeschi, V., Verda, V. (2018). Reduction of CO2 emissions in urban areas through optimal expansion of existing district heating networks. Journal of Cleaner Production, 204: 117-129. https://doi.org/10.1016/j.jclepro.2018.08.272
[26] Mutani, G., Gabrielli, C., Nuvoli, G. (2020). Energy performance certificates analysis in piedmont region (IT). A new oil field never exploited has been discovered. TI-Italian Journal of Engineering Science, 64(1): 71-82. https://doi.org/10.18280/ti-ijes.640112
[27] Boghetti, R., Fantozzi, F., Kämpf, J., Mutani, G., Salvadori, G., Todeschi, V. (2019). Building energy models with Morphological urban-scale parameters: A case study in Turin. In: Proceedings of 4th Building Simulation Applications Conference – BSA, pp. 1-8.
[28] Zheng, Y., Weng, Q., Zheng, Y. (2017). A hybrid approach for three-dimensional building reconstruction in Indianapolis from LiDAR data. Remote Sensing, 9(4): 310. https://doi.org/10.3390/rs9040310
[29] Sturiale, L., Scuderi, A. (2019). The role of green infrastructures in urban planning for climate change adaptation. Climate, 7(10): 119. https://doi.org/10.3390/cli7100119
[30] Overwatch Systems L. Feature Analyst 5.2 Reference Guide, 2007.
[31] Chatzipoulka, C., Compagnon, R., Nikolopoulou, M. (2016). Urban geometry and solar availability on façades and ground of real urban forms: Using London as a case study. Solar Energy, 138: 53-66. https://doi.org/10.1016/J.SOLENER.2016.09.005
[32] Hong, T., Lee, M., Koo, C., Jeong, K., Kim, J. (2017). Development of a method for estimating the rooftop solar photovoltaic (PV) potential by analyzing the available rooftop area using Hillshade analysis. Applied Energy, 194: 320-332. https://doi.org/10.1016/J.APENERGY.2016.07.001
[33] Miguel, A.F. (2008). Constructal design of solar energy-based systems for buildings. Energy and Building, 40: 1020-1030. https://doi.org/10.1016/J.ENBUILD.2007.08.005
[34] Santos, T., Tenedório, J.A., Gonçalves, J.A. (2016). Quantifying the city’s green area potential gain using remote sensing data. Sustainability, 8(12): 1-16. https://doi.org/10.3390/su8121247
[35] Mutani, G., Todeschi, V. (2020). Building energy modeling at neighborhood scale. Energy Efficiency. https://doi.org/10.1007/s12053-020-09882-4
[36] Mutani, G., Todeschi, V. (2019). An urban energy atlas and engineering model for resilient cities. International Journal of Heat and Technology, 37(4): 936-947. https://doi.org/10.18280/ijht.370402
[37] Mutani, G., Todeschi, V. (2017). Space heating models at urban scale for buildings in the city of Turin (Italy). Energy Procedia, 122: 841-846. https://doi.org/10.1016/j.egypro.2017.07.445
[38] Forte, A. (2019). Strumenti e Metodi per la Pianificazione Energetica a Scala Territoriale, il caso studio della Regione Piemonte (in italian). Thesis in Territorial, Urban, Environmental and Landscape Planning, Politecnico di Torino (IT).
[39] Peng, L.L., Jiang, Z., Yang, X., He, Y., Xu, T., Chen, S.S. (2020). Cooling effects of block-scale facade greening and their relationship with urban form. Building and Environment, 169: 106552. https://doi.org/10.1016/J.BUILDENV.2019.106552
[40] Yang, J., Bou-Zeid, E. (2019). Scale dependence of the benefits and efficiency of green and cool roofs. Landscape and Urban Planning, 185: 127-140. https://doi.org/10.1016/J.LANDURBPLAN.2019.02.004
[41] Dong, J., Lin, M., Zuo, J., Lin, T., Liu, J., Sun, C., Luo, J. (2020). Quantitative study on the cooling effect of green roofs in a high-density urban area—a case study of Xiamen, China. Journal of Cleaner Production, 255: 120152. https://doi.org/10.1016/J.JCLEPRO.2020.120152
[42] Taha, H., Sailor, D., Municipal, S. (1992). High-albedo materials for reducing building cooling energy use. Energy, https://doi.org/10.2172/7000986
[43] Mutani, G., Todeschi, V. (2019). Energy at urban scale modeling: A tool for energy transition, urban regeneration and the reuse of existing buildings and empty spaces (in Italian). ATTI E Rass Tec, LXXIII: 168-176.