Alessandra De Angelis* | Michele Libralato | Giovanni Corazza | Onorio Saro
OPEN ACCESS
This paper investigates the solar energy systems potential in a Nearly Zero Energy Building (NZEB) in order to reduce the use of non-renewable energy. The Hooke-Jeeves optimization scheme (implemented in the software GenOpt) is employed to find the best configurations of the solar thermal panels (ST-panels), photovoltaic panels (PV-panels) and hot water storage tank that reduces the overall cost, including the energy demand from other supplies. Various locations with different climatic conditions (temperate, continental, and oceanic climate) were analyzed. Solar collectors’ area, solar collectors’ scope and volume of hot water storage tank are set as the optimization variables, while the overall cost, consisting of investment costs and operating cost, is the objective function to minimize. The optimization results show that it is preferable to dedicate a larger roof area to photovoltaic collectors in the locations where the cooling loads are higher and that a larger roof area should be reserved to thermal solar panels in the locations where the heating loads are higher.
Trnsys, optimization, solar panels, PV panels, NZEB
In order to design a NZEB building two ways have to be followed: to reduce the energy requirements of building and to provide renewable energy systems that meet these reduced energy needs. The reduction of energy consumptions can be obtained designing an energy-efficient building envelope and considering low consumptions appliances. With reference to renewable energy systems, solar thermal, photovoltaic and geothermal installations are the more common solutions; the effectiveness of these systems depends on climate conditions of the building site and on the capacity of the HVAC plant to use the on-site produced energy.
In literature, several research papers have been written about the use of solar energy.
Christodoulos and Georgios [1] investigated the performance of a building integrated solar thermal system in order to optimize the sizing of a seasonal thermal energy storage. They carried out a parametric analysis on the effect of various parameters: solar collectors’ area, solar collector types, volume of seasonal storage thermal tank. The proposed system could cover in all cases at least 39% of the total heating load requirement.
By means the TRNSYS software, Li et al. [2] simulated a combined solar thermal heat pump system with seasonal energy storage in cold climate area; the proposed system feeds both heating and domestic hot water and was compared with a conventional space heating system. The influence of the tank storage characteristics, the solar collector area and the dead-band temperature of the air-to-water heat pump on system performance was analyzed. With the optimal value of the above-mentioned parameters, the system performance can be increased by 12.8% compared with a conventional system.
Energy saving potential of a solar-assisted heat pump system, for three buildings with different envelope insulation levels has been evaluated by Pinamonti and Baggio [3]. The aim of the study was the identification of the configuration of a solar aided heat pump that minimizes the energy demand and the installation cost and their results showed that the installation of both photovoltaic and thermal solar panels is advantageous for high insulation building with energy saving up to 30% and 24% respectively; for the medium insulated buildings, the photovoltaic system only is more effective respect to the thermal solar system while, for the low insulation buildings, the installation of solar thermal panels only is the most profitable solution.
The study of Mateus et al. [4], carried out by means of the TRNSYS software tool, evaluated the potential of integrated solar absorption cooling and heating systems for building applications; authors took into account different weather data (Berlin, Lisbon and Rome) and different building types (residential, office and hotel). The results of the study showed that a reduction of total costs and CO2 emissions is more relevant for South-European locations and when natural gas is used as system backup energy. Moreover, minimum costs depend on building type and location, but usually happen with annual solar fractions between 20 and 60%.
Three different configurations of solar-assisted heating and cooling systems were considered in the research of Calise et al. [5]. In the first and second layouts, the absorption chiller and solar collectors were sized basing on maximum and intermediate cooling load respectively and as auxiliary cooling system an electric chiller was installed; in the third layout an auxiliary boiler was used to feed the absorption chiller when the solar irradiation is low. Simulations were carried out with the TRNSYS software, an economic model was developed, in order to assess the operating and capital costs of the investigated systems, a mixed heuristic-deterministic optimization algorithm was implemented, in order to maximize the energy efficiency of each configuration. The results of the study showed that a suitable choice of the pump nominal flows and of the storage tank volume are fundamental to reach the best economic and energetic performance of the solar-assisted heating and cooling system.
In the present work, authors investigate on potential contribution of photovoltaic and solar thermal to reduce the costs regarding heating and cooling energy consumptions in a NZEB building. The optimization process takes into account also the storage tank volume and the panels slope.
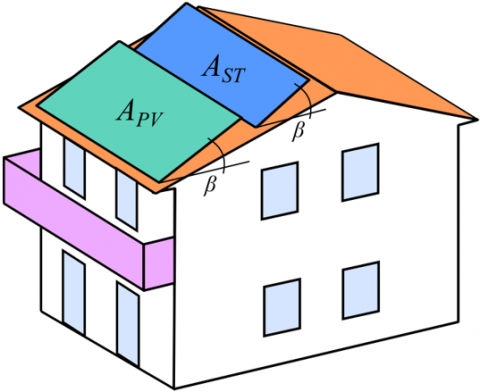
The reference NZEB building (Figure 1), is a residential building with zero emissions. A north-south oriented two floor detached house, is simulated with the software DesignBuilder based on EnergyPlus dynamic thermal simulation engine; the building has a rectangular shape, 6 m wide and 10 m long and an internal height of 2,7 m. A scheme of the building and of the panels disposition is presented in Figure 1.
Figure 1. Layout of building model
The geometric optimization parameters are indicated: APV is the area occupied by the PV-panels, ATS is the area occupied by the ST-panels, and β is the inclination angle of the panels.
The first floor includes the kitchen, living room, bathroom, stairwell, and aisle, whereas the second floor includes three bedrooms and one bathroom. The partition of internal spaces is chosen in according to energy consumptions reduction arranging heated rooms, as living room and bedroom, southbound while the kitchen, the bathrooms and the aisle are northbound, so that these can be thermal buffers.
The overall heat transfer coefficient U of each envelope element of the building, as well as the internal thermal capacity Cm are presented in Table 1.
Table 1. Thermal characteristics of building envelope components
|
Construction component |
U (Wm-2K-1) |
Cm (kJm-2K-1) |
|
Slab on ground floor |
0.21 |
62.7 |
|
Slab on first floor |
0.34 |
142.8 |
|
External wall |
0.11 |
112.1 |
|
Internal wall |
2.04 |
9.0 |
|
Roof |
0.11 |
45.5 |
|
Window (4-12-4) |
1.25 |
- |
The type uses a simple lumped capacitance model to simulate a single zone structure. subject to internal gains and assumes an overall U value for the entire structure, without modelling solar gains. The solar gains are calculated by the Design Builder simulation and then added as a thermal load in the TRNSYS simulation.
The HVAC system consists of a cooling system and a heating system, which will be examined in detail below.
3.1 Heating system
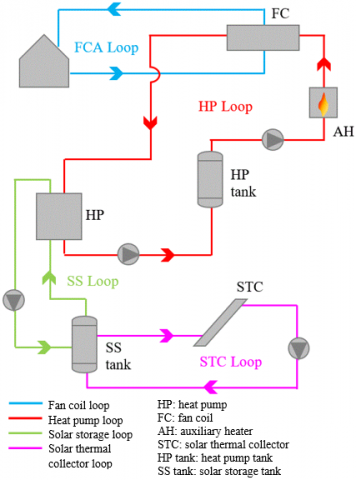
Three different system loops can be identified in the heating system, and they are schematically shown in Figure 2: the fan-coil air (FCA) loop, the heat pump (HP) loop, the solar storage tank (SS) loop and the solar thermal collectors (STC) loop.
The FCA-loop includes a fan coil unit (modelled with Type-137) and the building (using Type-88). A thermostat (Type-106) measures the building air temperature and outputs a control signal for the heating, which turns on and/or off the fan of the fan-coil unit. The heating setpoint temperature is set at 20°C with a dead band temperature difference of 2°C.
Figure 2. Layout scheme of the heating system
Only one thermal zone is modelled inside the building, therefore only one fan-coil unit is required. Type-137 models a fan coil where the air is heated when it goes across the coil by means of a hot water coming from HP-loop. Fan-coil performances as a function of entering air and water conditions are evaluated linking a user-provided external data file.
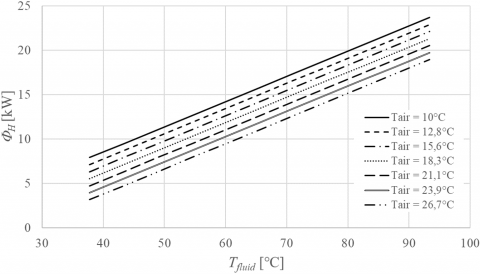
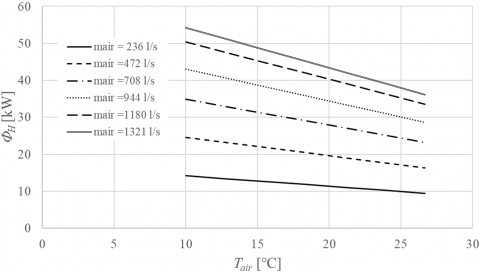
The following figures summarize the fan coil heating performances: the plots of Figure 3 show the heating power as a function of inlet fluid temperature for different inlet air temperatures, while Figure 4 shows the dependence of heating power on air flow rate.
Figure 3. Heating power supplied by fan coil depending on inlet fluid temperature for different inlet air temperature at the minimum air flow rate
Figure 4. Heating power supplied by fan coil depending on inlet fluid temperature for different air flow rate with an inlet air temperature of 60°C
The HP-loop includes a water-to-water heat pump (Type-927), a single speed circulation pump (Type-114), a cylindrical storage tank (Type-158) and an auxiliary heater (Type-659).
By means of a thermostat inside the storage tank (HP tank), the heat pump is activated as long as the water temperature into the tank is lower than 50°C. The heat pump uses a water storage tank as source of heat, which receives heat from solar thermal collectors thanks to the S-loop, therefore, this tank is identified as solar tank (S-tank). A thermostat monitors the water temperature inside the S-tank and if it decreases under -10°C, the heat pump turns off and an auxiliary heater is activated.
Storage tanks are modeled as constant volume storage tanks with a vertical thermal stratification; there are up to two flow streams that pass into and out of the tank and the fluid in the tank exchanges heat with the environment; a heat loss coefficient equal to 1 W/m2K has been set for both.
In order to model the thermal stratification observed in storage tanks, they are divided into isothermal temperature nodes and each constant-volume node is assumed to be isothermal and interacts thermally with other nodes.
The COP values of the water-to-water heat pump are based on catalog data of commercial products.
The STC-loop includes solar thermal panels (Type-1b), a storage tank (Type-158) and a single speed circulation pump (Type-114). The solar panels are modelled as flat-plate solar collector model described by Type-1b. The following widely used equation for solar thermal panel efficiency is considered [6]:
$\eta=\frac{\dot{m} c_{p}\left(T_{\text {out }}-T_{\text {in }}\right)}{A l_{\text {tilt }}}=F_{R}(\tau \alpha)_{\perp}-F_{R} U_{L} \frac{\left(T_{\text {in }}-T_{\text {amb }}\right)}{I_{\text {tilt }}}$
The heat loss coefficient UL depends on the temperature difference between inlet temperature of the fluid in the collector and the external air temperature and therefore the efficiency expression could be expressed as a quadratic equation:
$\eta=F_{R}(\tau \alpha)_{\perp}-F_{R} U_{L} \frac{\left(T_{i n}-T_{a m b}\right)}{I_{t i l t}}-F_{R} U_{L} \frac{\left(T_{i n}-T_{a m b}\right)^{2}}{I_{t i l t}}$
The above expression is usually written as:
$\eta=a_{0}-a_{1} \frac{\Delta T}{I_{t i l t}}-a_{2} \frac{\Delta T^{2}}{I_{t i l t}}$
In order to set the parameters a0, a1 and a2 in the Type-1b, technical data of commercial collectors available in the European market were used.
Several parameters obtained from an hourly meteorological data file (Type-15) are used by the Type-1b model. The Type-15 reads weather data in EnergyPlus format.
During the winter season, the contribution of photovoltaic solar panels is to reduce the purchase of electricity from the grid and the evaluation of the electrical energy produced by PV is obtained with a PV-loop, which includes only a photovoltaic panel array linked to climate data.
The photovoltaic collector is modeled using Type-190, which simulates the behavior of a PV-array consisting of silicon cells; Type-190 allows also to take into account the dependence of the collector efficiency on the surface temperature of PV-collector by means of a thermal model.
The thermal energy due to the heating of the cells is dissipated according to convection, conduction, and radiation mechanisms. The thermal model implemented into Type-190 is based on the energy balance presented in [4], where the internal energy variation of the PV module equals the heat gains due to the absorbed solar radiation, to the produced electrical energy and to the heat losses to the external environment:
$c_{p} \frac{d T}{d t}=\dot{Q}_{s}-\dot{Q}_{e l}-\dot{Q}_{L}$
$c_{p} \frac{d T}{d t}=(\tau \alpha) I-\eta_{e l} I-U_{L, c e l l}\left(T_{c e l l}-T_{a m b}\right)$
where, the heat loss coefficient α depends on difference between temperature of cells surface and temperature of external air.
3.2 Cooling system
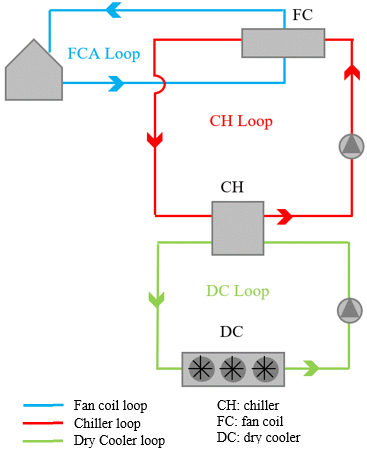
Cooling system, schematically shown in Figure 5, can be divided in three different system loops: fan-coil (FCA) loop, chiller (CH) loop, and dry-cooler (DC) loop. Building cooling requirements are satisfied by means of fan-coil units fed by a vapor compression chiller, which connects the CH-loop with the DC-loop.
Chiller performances are taking into account by means of a user-provided external data file, which reports supplied cooling power as function of cooling and chilled water temperature. Moreover, a link between the Dry Cooler Type and the weather data file allows to take into account the dry cooler operation efficiency in different climatic conditions.
Figure 5. Layout scheme of the cooling system
In summer season, the contribution of photovoltaic solar panels is to reduce the purchase of electricity from the grid, while that one of solar thermal panels is to cover, partially or totally, the domestic hot water requirements. In both cases, the evaluation of the electrical or thermal energy produced by PV or thermal panels respectively, is unconnected to the evaluation of electrical energy requirements to cool the building. For that reason, PV solar panels are modeled with a separate loop; the building and the climate are the only data that the two systems have in common.
4.1 Optimization variables
In this study four types of decision variables are defined:
• thermal solar panels (ST-panels) area, ATS
• photovoltaic solar panels (PV-panels) area, APV
• solar collectors’ slope, b
• volume of the hot water storage tank, VS
The variables are assumed to have discrete values within a range; the Command File of GenOpt [7, 8] contains the extremes values of the range and the variation step of each variable. Since it was decided to use the whole roof surface, there is a constraint between two of the decision variables:
$A_{T S}+A_{P V}=A_{\text {roof}}$
Therefore, the thermal solar panels area is constrained in this way:
$0 \leq A_{T S} \leq A_{\text {roof}}$
and the PV solar panels area is therefore equal to:
$A_{P V}=A_{\text {roof}}-A_{T S}$
The tilt of the panels was included in the optimization variables to adapt the system to different locations, obtaining different optimal panels inclinations. Panels tilt is a variable that affects the of thermal or electric energy production but not the costs, moreover, to take into account an aesthetic factor the same tilt was considered for both ST- and PV-solar panels.
The solar storage tank is usually sized starting from a daily domestic hot water requirement, but in the HVAC plant modeled two different storage tank were considered: a storage that is the cold source of a water-water heat pump and the other that is the domestic hot water storage tank.
4.2 Objective function
The objective function to minimize is the overall costs, composed of investment costs Cinv and operating costs Cop . The investment costs are calculated from the costs of the solar panels and the storage tank costs, evaluated in €/m2 and €/m3, respectively. Those costs can be expressed as:
$C_{i n, n}=C_{T S} \cdot A_{S T}+C_{P V} \cdot A_{P V}+C_{S} \cdot V_{S}$
AST: thermal solar surface area [m2];
CST: cost in [€/m2] for thermal solar panels;
APV: PV solar surface area [m2];
CPV: cost in [€/m2] for PV solar panels;
VS: storage tank volume [m3];
CS: cost in [€/m3] for storage tank volume.
ST- and PV-panels costs are evaluated following a survey on several commercial products.
The operating costs are those related to electrical energy consumptions and can be expressed as:
$C_{o p}=\left(Q_{E n d}-Q_{E p r}\right) \cdot C_{E l t}$
QE_nd: needed annual electrical energy [kWh/year];
QE_pr: produced annual electrical energy [kWh/year];
CElt: cost of electrical energy [€/kWh].
The annual energy demand of the building, calculated by TRNSYS [9], consists in energy demand for space heating, space cooling and domestic hot water (DHW) systems. In the present study a value of 0.25 €/kWh has been chosen; this value obviously cannot be representative of the electrical energy cost of the different countries, but the aim of the work was a comparison between the optimal solutions obtained in different climates.
A discount rate has been also considered to include the time value of money, in fact, if a scenario needs a certain investment at the construction time and generates future returns, by means of discounted rate, it is possible to calculate the current value of those returns.
5.1 Geographical locations and weather data
In order to cover quite different climate zones, different cities referring to each ASHRAE climate class were chosen. Locations and respective zone are summarized in Table 2.
Table 2. Locations
|
Location |
ASHRAE zone |
|
New Dehli |
1 |
|
Cairo |
2 |
|
Tunis |
3 |
|
Seoul, Roma |
4 |
|
Milano, Hamburg, Birmingham |
5 |
|
Moscow |
6 |
|
Ostersund |
7 |
5.2 Optimization results
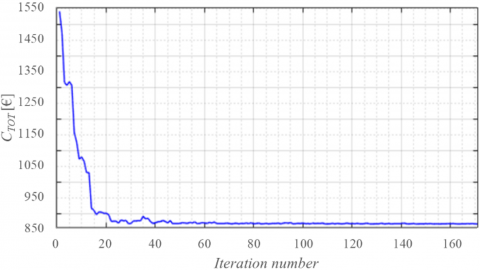
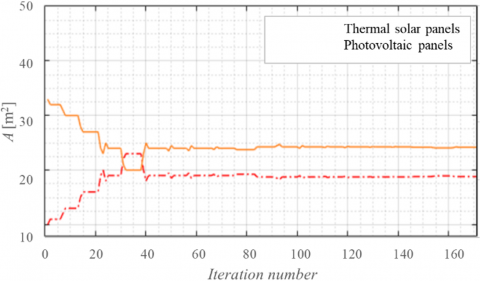
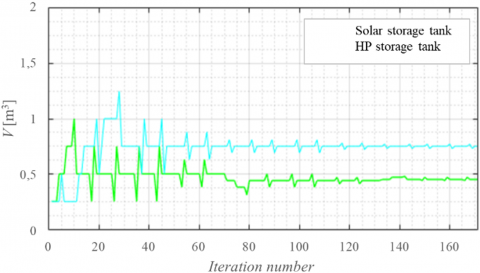
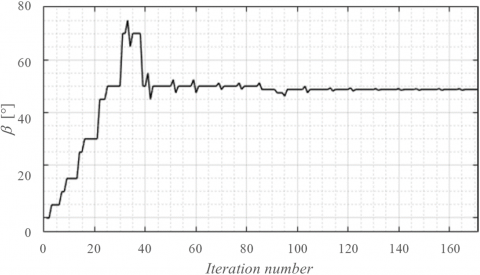
As example, the results of the optimization process relating to one of the considered locations, Milan, are reported. In Figures 6a-6b-6c-6d the results of the optimization process are shown; all the graphs have on the x axis the number of iterations to reach the optimal value of total cost (Figure 6a), solar collectors area (Figure 6b), storage tank volume (Figure 6c) and panels tilt (Figure 6d).
Figure 6a. Total cost as a function of the iterations number
Figure 6b. Area of thermal solar and photovoltaic panels as a function of the iterations number
Figure 6c. Volume of solar storage tank and heat pump tank as a function of the iterations number
Figure 6d. Panels tilt as a function of the iterations number
Optimization results are summarized in Table 3.
Table 3. Locations
|
Location |
ATS (m2) |
APV (m2) |
b (°) |
VSS (m3) |
VHP (m3) |
CTOT (€) |
|
New Delhi |
8 |
35 |
11 |
0.25 |
0.25 |
1027 |
|
Cairo |
13 |
30 |
28 |
0.25 |
0.25 |
1310 |
|
Tunis |
14 |
29 |
33 |
0.25 |
0.25 |
1051 |
|
Seoul |
21 |
22 |
36 |
1.5 |
0.75 |
1049 |
|
Rome |
19 |
24 |
49 |
0.5 |
0.75 |
867 |
|
Milan |
32 |
11 |
65 |
1.5 |
0.25 |
1534 |
|
Hamburg |
28 |
15 |
65 |
1.5 |
0.5 |
1469 |
|
Birmingham |
35 |
8 |
65 |
1.5 |
0.62 |
1077 |
|
Moscow |
16 |
27 |
66 |
1.5 |
0.5 |
2272 |
|
Ostersund |
14 |
29 |
68 |
1.5 |
0.25 |
2490 |
For the cities of New Dehli, Cairo, and Tunis the minimum value of the total cost corresponds to a configuration with a larger roof area dedicated to the photovoltaic collectors; those results are due to higher cooling loads respect to heating loads, taking into account that cooling loads are satisfied by means of a vapor compression chiller fed by electrical energy.
Rome and Seoul have cooling loads comparable with heating loads and therefore the results of the optimization resulted in ST-panels and PV-panels with the same areas.
For the locations that are characterized by heating loads larger than cooling loads, as Milan, Hamburg, and Birmingham, the optimal configuration is that one with a T-panels area larger than PV-panels area.
Finally, Moscow and Ostersund are locations with extreme weather conditions, characterized by a low solar radiation, where solar employment is not convenient.
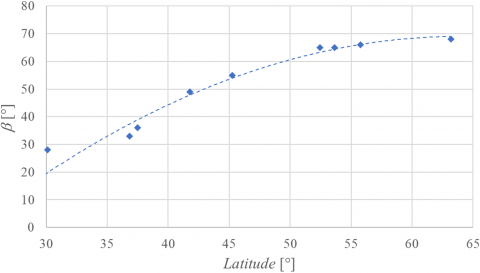
5.2.2 Panels’ tilt
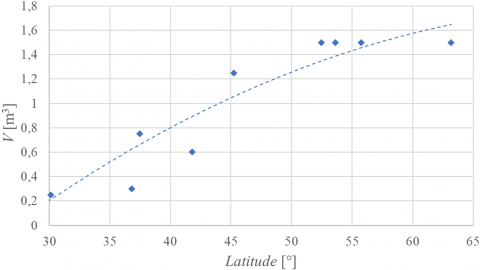
The tilt angle of the collectors increases moving from zone 1 to zone 7 following the tatitudine of the location. These results agree with the already mentioned results from the literature regarding the more suitable inclination of the panels. This correlation is presented in Figure 7.
5.2.3 Storage tank volume
The observation of the results shows that, for locations with higher heating loads (Milan, Hamburg, and Birmingham), a bigger volume of the storage of solar energy should be recommended.
5.2.4 Influence of the climate
It is interesting to correlate the optimization results with the climate of the considered locations. As before noted, a good correlation between the locations latitude and panels tilt can be observed in Figure 7.
Figure 7. Panels tilt as a function of the latitude
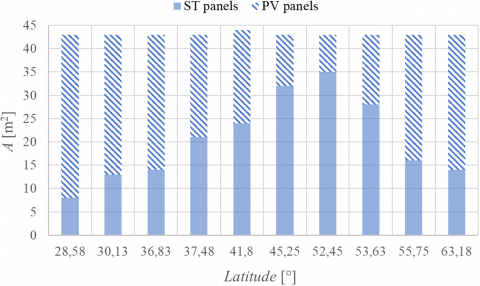
Alsto the partition of the roof between T- and PV-panels has a variation that could be correlated with latitude. This result is presented in Figure 8.
Figure 8. Area of thermal solar and photovoltaic panels as a function of the latitude
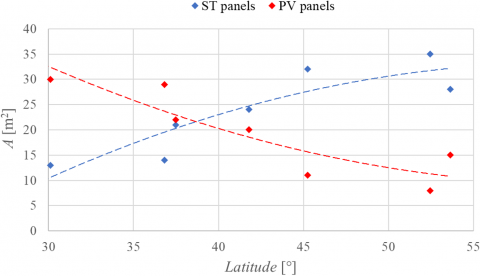
Excluding Mosca and Ostersund, that are locations with extreme weather conditions (where the solar employment is not convenient), for the remaining locations, a correlation between the roof area splitting up and the latitude can be observed (Figure 9). It may seem counterintuitive that the PV-panels tilt decreases with increasing the latitude, but this trend is due to the constraint imposed on all the collectors area that fixes the same tilt angle for both PV- and ST-panels. Others simulations should be carried out without the constraint.
Figure 9. Area of thermal solar and photovoltaic panels as a function of the latitude (only for the ASHRAE climatic zones 1,2,3,4,5)
As Figure 10 shows, the solar storage tank volume increases as the latitude increases. This effect is explained by the heating demands increasing with the latitude and, at the same time, the reduced availability of solar irradiation for the direct energy consumption.
Figure 10. Volume of the solar storage tank as a function of the latitude
The aim of the present work is to optimize the exploitation of the solar energy source for a Nearly Zero Energy Building (NZEB). Heating and cooling loads of the considered reference NZEB building have been evaluated by means of simulations carried out with the software DesignBuilder, whereas the behavior of the HVAC systems, the thermal solar plant, and the photovoltaic plant have been modeled with the software TRNSYS. The optimization process was carried out using the Hooke-Jeeves optimization scheme, implemented in the software GenOpt, and linked to TRNSYS software.
The building was modeled with a fixed roof area, which could be used to install thermal solar panels or photovoltaic collectors, therefore the main constraint of the optimization process was the roof area available for the two solar collectors systems.
Fan coil units as heating and cooling terminals in the building have been considered; they are fed by an electrical heat pump equipped with a storage water tank.
The optimization was carried out considering the same building in different locations (one for each of seven zones identified by the ASHRAE classification) and, for each location, the optimum values of four variables are calculated: thermal solar panels area, photovoltaic solar panels area, solar collectors slope and volume of the storage tanks.
The results can be summarized as follow:
• on one hand, in locations where the cooling loads are higher than the heating loads, the configuration corresponding to a minimum cost is had larger roof area dedicated to the photovoltaic collectors; this result depends on the utilization of an electrical chiller during summer period. On the other hand, in locations characterized by high heating loads, the optimal solution is provided by a ST-panels area larger than PV-panels area;
• the optimal slope of the collectors increases, going from 30° to 70°, with the latitude, from 30° to 60°;
• the optimal volume of the energy solar storage tank depends on the heating demand of the building.
Future research is required to understand if the optimization procedure could be applied with benefit on different building typologies (offices, schools, shopping mall, etc.) and with different HVAC-plant configurations, where solar energy could be exploited to the best, using non-traditional cooling plant solutions, as evaporative cooling combined with dry coolers [10-12]. More realistic optimization results could be obtained also modeling in detail the building, taking in account aspects such as effects of more accurate ground heat loss calculation procedures [13]. Another relevant aspect that will be investigated is the influence of the weather file generation method form the weather record [14] on the optimization results.
|
A |
Surface, [m2] |
|
cp |
Specific heat[J·kg-1·K-1] |
|
FR |
Heat removal efficiency factor [-] |
|
I |
Global radiation, [W·m-2] |
|
$\dot{Q}$ |
Heat flux, [W] |
|
T |
Temperature, [K]. |
|
U |
Thermal coefficient, [W·m-2·K-1] |
|
V |
Volume, [m3] |
|
Greek symbols
|
|
|
a |
Short-wave absorptance [-] |
|
b |
Panels tilt, [°] |
|
t |
Short-wave transmittance [-] |
|
h |
Efficency [-] |
|
Subscripts
|
|
|
amb |
Ambient |
|
cell |
PV cells |
|
el |
Electrical |
|
in |
Inlet |
|
L |
Loss |
|
out |
Outlet |
|
PV |
Photovoltaic |
|
s |
Solar |
|
tilt |
Tilted surface |
|
ST |
Solar thermal |
[1] Christodoulos, N.A., Georgios, M. (2019). Optimization of a building integrated solar thermal system with seasonal storage using TRNSYS. Renewable Energy, 137: 56-66. https://doi.org/10.1016/j.renene.2018.03.074
[2] Li, H., Sun, L., Zhang, Y. (2014). Performance investigation of a combined solar thermal heat pump heating system. Applied Thermal Engineering, 71(1): 460-468. https://doi.org/10.1016/j.applthermaleng.2014.07.012
[3] Pinamonti, M., Baggio, P. (2020). Energy and economic optimization of solar-assisted heat pump systems with storage technologies for heating and cooling in residential buildings. Renewable Energy, 157: 90-99. https://doi.org/10.1016/j.renene.2020.04.121
[4] Mateus, T., Oliveira, A.C. (2009). Energy and economic analysis of an integrated solar absorption cooling and heating system in different building types and climates. Applied Energy, 86(6): 949-957. https://doi.org/10.1016/j.apenergy.2008.09.005
[5] Calise, F., d’Accadia, M.D., Palombo, A. (2010). Transient analysis and energy optimization of solar heating and cooling systems in various configurations. Solar Energy, 84(3): 432-449. https://doi.org/10.1016/j.solener.2010.01.001
[6] Duffie, J.A., Beckman, W.A. (1991). Solar Engineering of Thermal Processes. 2nd ed. Wiley Interscience, New York.
[7] Genopt – Generic Optimization Program – user manual – Version 3.1.1 Michael Wetter, 2015.
[8] Using GenOpt with TRNSYS 16 and type 56Genopt, Michael Kummert.
[9] TRNSYS 18 – A transient Simulation Program – User manual, S. A. Klein et al.
[10] De Angelis, A., Chinese, D., Saro, O. (2017). Free-cooling potential in shopping mall buildings with plants equipped by dry-coolers boosted with evaporative pads. International Journal of Heat and Technology, 35(4): 853-862. https://doi.org/10.18280/ijht.350422
[11] De Angelis, A., Ceccotti, L., Saro, O. (2016). Cooling energy savings with dry cooler equipped plants in office buildings. International Journal of Heat and Technology, 34(S2): S205-S211. https://doi.org/10.18280/ijht.34S203
[12] De Angelis, A., Ceccotti, L., Saro, O. (2017). Energy savings evaluation for dry-cooler equipped plants in shopping mall buildings. International Journal of Heat and Technology, 35(S1): S361-S366. https://doi.org/10.18280/ijht.35Sp0149
[13] Libralato, M., De Angelis, A., Saro, O. (2019). Evaluation of the ground-coupled quasi-stationary heat transfer in buildings by means of an accurate and computationally efficient numerical approach and comparison with the ISO 13370 procedure. Journal of Building Performance Simulation, 12(5): 719-727. https://doi.org/10.1080/19401493.2019.1628304
[14] Libralato, M., Murano, G., De Angelis, A., Saro, O., Corrado, V. (2020). Influence of the meteorological record length on the generation of representative weather files. Energies, 13(8): 2103. https://doi.org/10.3390/en13082103