Corradino Sposato | Enrico Catizzone* | Assunta Romanelli | Luigi Marsico | Donatella Barisano | Massimo Migliori | Giacinto Cornacchia
OPEN ACCESS
The aim of this work is to assess the performances of several carbons towards phenol removal from wastewater. Two commercial activated carbons, with BET surface area of 800 (SP800) and 1000 m2/g (SP1000) and two bio-char samples produced via both pyrolysis (SPBCP) and gasification (SPBCG) of biomass, respectively, were used for this purpose. A phenol aqueous solution with initial concentration of 5 g/l was adopted as model solution. Adsorption tests were carried out at different time (up to 4 hours) and different solid amount (0.5-4 g of carbon) with the scope to study both kinetics and thermodynamics of the process. Obtained data were fitted with literature adsorption models (e.g. Langmiur, Tempkin, and Freundlich) aiming to estimate the adsorption capacities of the investigated materials. The adsorption capacity follows the order SP1000>SP800>>SPBCP>SPBCG.
phenol, wastewater, activated carbons, bio-char, adsorption
Phenols are relevant environmental pollutants and its interest is due to their diffusion in many industrial activities. Phenols cause unpleasant taste and odour of drinking water and can exert negative effects on different biological processes. Most of these compounds are recognized as toxic carcinogens.
Phenols can be found in side streams from several production sectors. Water effluent of oil refineries, coal gasification sites, petrochemical units, paper and pulp industry generate large quantities of phenols [1, 2]. According to the legislative decree 152/06 (updated in 2019), the pollutants are cataloged by chemical species. The limit of phenol proposed for groundwater is 0.5 µg/l and the great part of its derivatives cannot exceed the limit of 0.2 mg/l in according to the World Health Organization regulation [3]. For these reasons, it is considered necessary to remove the phenols from industrial effluents before discharging into the water stream.
Conventional treatment methods to remove phenols from water include solvent extraction, chemical oxidation, ozonation and biological methods. Activated carbon are good sorbent for use in gas and water purification [4] and are efficiently used in several pollution control processes due to their high adsorption capacity. The passage of a stream through an activated carbon bed reactor permit the removal of a large number of contaminants. High surface area and pore volumes as well as large percentage of micropores are typical characteristics of activated carbons that provide a physical and chemical structure useful for absorption application [5]. The two most common physical forms of activated carbon are powder-like and granular one. Other forms are attracting increasing attention such as fibers, obtained from isotropic coal and petroleum pitch, cloths and felts [6].
Adsorption of aromatic compounds from solution, particularly phenols, has been studied extensively [7-13].
Tessmer et al demonstrated that the presence of functional groups prevents activated carbons from adsorbing phenol when the adsorption takes place under toxic conditions, with oxygen in the solution [7]. Activated carbon surface possesses a charge density that depends on the pH of the solution. This aspect is important for the adsorption of phenol, the electrolyte composition can attract, or not, the molecules to the activated carbon surface. It was found that at low pH, i.e. in acidic solution, the amount adsorbed increases slightly with increasing pH and with a further increase in the pH, the phenol uptake decreases [8].
Özkaya studied phenol adsorption/desorption from aqueous solution with activated carbons and three-parameter isotherm models and two-parameter models were found to be applicable for the adsorption equilibrium data by non-linear regression. The results showed that the first-order kinetic model represented the data for NaOH desorption more suitable fitting than the pore diffusion model. The results also demonstrated that the Langmiur model fitted the experimental data a little better than the three-parameter models such as Redlich–Peterson and Toth [11].
Tancredi and co-workers [12] worked on phenol adsorption using powdered and granular activated carbon, prepared from Eucalyptus wood. A good reproducibility with proposed granule preparation method is showed. Phenol is adsorbed faster in powdered carbons than in granular ones and is preferentially physisorbed on the pores of the activated carbon present in the granules and chemisorbed in a lower extension; moreover granular active carbon regeneration could easily be achieved through solubilisation of the 80% of organic compound physically adsorbed.
Rodrigues et al. [13] worked on activated carbon produced from avocado kernel (AAC) seeds for phenol removal application. Kinetic of the adsorption, solution pH, dosing and regeneration of adsorbent was studied. Maximum uptake was obtained at pH values between 4 and 8.5, adsorption isotherms showed that the interaction of phenol with AAC surface was good described by a localized monolayer adsorption and kinetic of the adsorption process was described by a pseudo-second-order rate model.
In this work the performances of two commercial activated carbons and two types of bio-char, produced via both pyrolysis and gasification, respectively, for phenol removal from aqueous solution are presented. The obtained data were modelled in order to obtain insights on the phenol removal capacity of the investigated carbons.
Two activated carbons with specific surface area of 800 m2/g (SP800) and 1000 m2/g (SP1000) were gently provided by Sicav S.p.A in powder form with size <75 µm, and were used as-received with no additional treatments. Two biomass-derived carbons (biochar) were prepared by pyrolysis (SPBCP) or gasification (SPBCG). SPBCP sample was prepared by slow pyrolysis at 550 °C of wood chips while SPBCG was prepared by air gasification at 800 °C of biomass residues. Both the biochar samples were dried for three days at 70 °C in order to remove moisture, ground in a blade mill and then sieved and the powder fraction with size <75 µm was used for the adsorption tests. All the investigated carbons were analyzed by thermogravimetric analysis in the range 30-850 °C, in air flow, and with a heating rate of 10 °C/min.
The phenol adsorption tests were carried out in a glass batch tank using 50 ml of an aqueous solution containing 5 g/l of phenol (PhOH). The mass of adsorbent (activated carbons or biochar) was varied between 0.5 g and 4 g. The adsorption tests were carried out under vigorous stirring at room temperature and the effect of contact time was investigated in the range 0-24 h. After adsorption test, the solid was separated from liquid by centrifugation at 4000 rpm for 10 minutes. Any carbon residues suspended in the liquid were carefully eliminated by vacuum filtration followed by a filtration step through a 0,45 PTFE filter before the HPLC-UV-Vis analysis. UV-Vis analysis were performed by an Agilent 1100 HPLC system coupled with a DAD detector (Eluent: isocratic H20/ACN 80/20; flow: 1 ml/min; column: C18; λ: 254 nm). The amount of adsorbed phenol as a function of time was fitted with two adsorption kinetic models, i.e. the pseudo-first and –second order models. The pseudo-first order model is described by the following equation:
$q_{t}=q_{e}\left(1-e^{k_{1} t}\right)$ (1)
where, qt and qe(expressed in mgPhOH/gcarbon) are the adsorption capacities at the contact time t (expressed in h) and at the equilibrium (assumed to be achieved after 24 h). The parameter k1 is the pseudo-first order kinetic constant and it is expressed as (h-1).
The pseudo-second order model is described by the following equation:
$q_{t}=\frac{k_{2} \cdot q_{e}^{2} \cdot t}{1+k_{2} \cdot q_{e} \cdot t}$ (2)
The parameter k2 is the pseudo-first order kinetic constant and it is expressed as mgPhOH /(gcarbon·h).
For each carbon the equilibrium capacity, as a function of carbon amount, was measured and the equilibrium graph was then derived. Three equilibrium adsorption models were used to fit the experimental results.
Langmiur adsorption isotherm model can be described by the following equation:
$q_{e}=\frac{q_{\max } \cdot K \cdot C_{e}}{1+K \cdot C_{e}}$ (3)
where, qe is the equilibrium concentration of the phenol on the carbon (mg/g), Ce is the concentration of phenol in the solution (mg/l) and K is the equilibrium constant of Langmiur model (l/mg).
Freundlich adsorption isotherm is an empirical model described by the following equation [14]:
$q_{e}=K_{F} C_{e}^{n}$ (4)
where, qe is the equilibrium concentration of the phenol on the carbon (mg/g), Ce is the concentration of phenol in the solution (mg/l) and K is the equilibrium constant of Freundlich model (ln/mg1-n/g). According to the mathematical form, the Freundlich model does not allow to fit a concentration plateau in the adsorbed solute when increasing the solute concentration C.
Temkin model is based on the experimental evidence that heat of adsorption linearly decreases when increasing the surface coverage and it can be described by the following equation:
$q_{e}=B_{T} \ln \left(A_{T} C_{e}\right)$ (5)
where, AT (l/mg) is an equilibrium/fitting parameter [14] and BT (mg/g) is a constant related to heat of sorption.
To discriminate among different adsorption isotherm models, a statistical criterion has been adopted, based on F-test. Since the three models have same number of parameters P, the same degree of freedom (DOF) holds DOF=N-P, where N is the number of experimental observations yi,exp (i=1..N). For any model, if the predicted yi,calc is calculated in the experimental conditions of the measured yiexp, the sum of the least squares SS can be calculated as:
$S S=\sum_{i=1}^{n}\left(y_{i, c a l c}-y_{i, \exp }\right)^{2}$ (6)
and according to the hypothesis that the population follows the Fisher distribution F:
$F=\frac{\sum \frac{y_{i, c a l c}^{2}}{P}}{\frac{S S}{N-P}}$ (7)
The best-fit model is assumed as the model with the highest F value.
3.1 Carbon thermogravimetric behavior
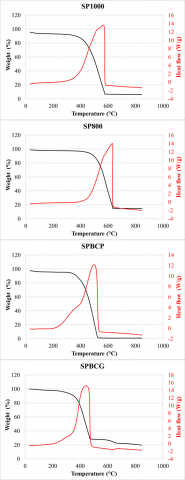
The thermogravimetric profiles of the investigated samples are reported in Figure 1.
Figure 1. Thermogravimetric analysis of the investigated samples
The thermogravimetric profiles of commercial activated carbons are very similar. In fact, the combustion step starts at above 400 °C with a maximum heat flow at about 600 °C.
The investigated bio-chars exhibit a similar thermal profile, with a combustion starting point at 250 °C and maximum heat flow at about 500 °C, suggesting that biochars are less stable than commercial activated carbons. This aspect is of paramount importance in the case of thermal regeneration of the used carbons. Furthermore, the combustion pattern of SPBCG seems to be more homogenous than SPBCP. A higher content of volatile compounds may be indeed expected for biochar produced via pyrolysis. The heat flow band in the temperature range 250-400 °C may be indeed related to desorption and combustion of unstable molecules.
The uncombusted matter was about 5 % for SP1000, about 18% for SP800 and about 20% for SPBCG, while was below 1% for SPBCP. Such differences may be related to both the thermal preparation process and the carbon sources that affect the carbon content in the produced solid.
3.2 Kinetics
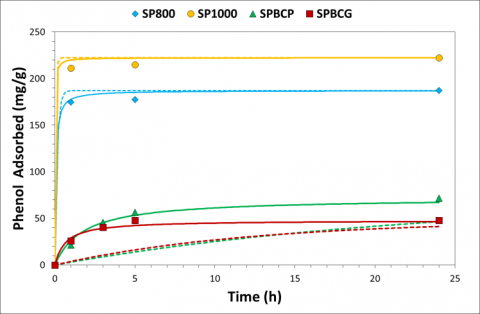
The trend of phenol amount adsorbed over the different investigated carbon samples as a function of time is reported in Figure 2.
Figure 2. Effect of time on phenol adsorption over the investigated samples. Initial concentration: 5000 ppm (wt), solution volume: 50 ml, carbon amount: 1 g
Commercial activated carbons exhibit a very high adsorption kinetic. After 1 h, a plateau of adsorption load is observed, indicating a fast achievement of equilibrium conditions. On the contrary, for both the investigated biochars the plateau is observed after 5 h. Furthermore the superiority of activated carbons, in terms of adsorption capacity, is clearly observed.
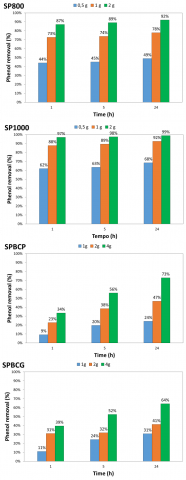
The effect of carbon amount of phenol removal capacity at different treatment time is reported in Figure 3. The high adsorption rate of commercial activated carbons is confirmed also for different carbon amount. In fact, in the time range 1-24 h, a light increase of phenol removal is observed indicating a fast achievement of equilibrium. Phenol removal strongly increases by increasing the carbon amount. For SP800 phenol removal increases from 44-49% to 87-92% by increasing the carbon amount from 0.5 to 2 g, respectively, while for SP1000 phenol removal increase from 62-68% up to 99%.
Figure 3. Effect of time and carbon amount on phenol removal. Initial phenol concentration: 5000 ppm (wt). Solution volume: 50 ml
The obtained data also clearly indicates the beneficial effect of specific surface area on phenol removal. In fact, for all the tests, SP1000 exhibits a phenol removal capacity higher than SP800. Both the investigated biochars seem to be very similar in terms of phenol removal, as also observed from Fig. 2, with much lower removal performances than activated carbons. For instance, after 1 h and with the lowest carbon amount, the phenol removal was 62% for SP1000, 44% for SP800, and 9-11% only for the investigated biochars. The experimental data reported in Figure 2 also confirm the low adsorption rate of biochars, as a significant effect of treatment time on phenol removal can be observed. For instance, with 4 g of SPBCP or SPBCG the removal level increases from 34% to 73% and from 39% to 64%, respectively, by increasing the time from 1 to 24 h. It is possible to note that the biochar produced from pyrolysis seems to exhibit a slightly higher removal grade than biochar produced from gasification. Such difference may be related to the higher carbon content of SPBCP as observed from thermogravimetric analysis.
As described in the experimental part, both pseudo-first order and pseudo-second order kinetic models were used to fit the experimental data. The results of model fitting are reported in Figure 4.
Figure 4. Model fitting with pseudo-first order model (dashed line) and pseudo-second order model (continuous line). Initial phenol concentration: 5000 ppm (wt). Solution volume: 50 ml
The estimated parameters of investigated models with the F value are reported in Table 1.
Table 1. Parametrs of kinetic models
|
Sample |
Pseudo-1st order constant |
Pseudo-2st order constant |
||
|
|
k1(1/h) |
R2 |
k2(mg/g/h) |
R2 |
|
SP1000 |
19.5 |
0.989 |
0.40 |
0.999 |
|
SP800 |
7.1 |
0.999 |
0.10 |
0.996 |
|
SPBCP |
0.04 |
0.828 |
0.01 |
0.995 |
|
SPBCG |
0.08 |
0.722 |
0.03 |
0.999 |
|
|
F-value |
|||
|
SP1000 |
1117 |
4230 |
||
|
SP800 |
4323 |
10692 |
||
|
SPBCP |
68 |
714 |
||
|
SPBCG |
39 |
591 |
||
The F-values reported in the Table 1 clearly indicates that the experimental data are well described by a pseudo-second order model, especially for bio-chars samples. The calculated k2 constant follows the order: SP1000>SP800>>SPBCG>SPBCP. Confirming the superiority of commercial activated carbons in terms of phenol adsorption kinetics. In particular, the model also indicates that SP1000 sample shows an adsorption rate 4-times higher than SP800 sample, which displays a kinetic constant one order of magnitude higher than biochars. Concerning biochars, a higher kinetic constant is calculated for SPBCG sample, despite a lower equilibrium capacity.
3.3 Adsorption isotherms
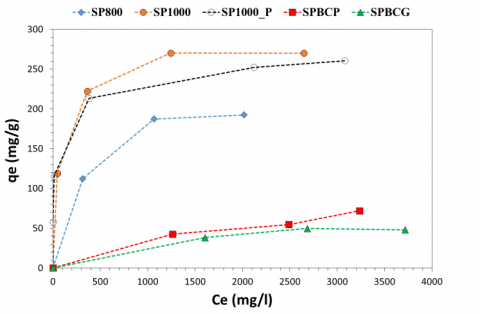
Experimental data of adsorption isotherm tests are reported in Figure 5, where the phenol equilibrium concentration in the solid (qe) and phenol equilibrium concentration in the solution (Ce) are calculated from batch tests after 24 h of contact time. Previous kinetic study revealed that no change of concentration is observed for time higher than 5 h, therefore, at 24 h of contact time equilibrium conditions may be assumed.
Figure 5. Adsorption isotherms at room temperature of the investigated carbons
Equilibrium curves indicate the following order in terms of adsorption capacity: SP1000>SP800>>SPBCP>SPBCG. Confirming, as expected, the superiority of commercial activated carbons over the investigated biochars and a slightly better performance of the biochar from pyrolysis respect to the material obtained from gasification.
Moreover, SP1000 sample in grain form (SP1000_P) with size in the range 1-1.5 mm was also tested. As can be observed, the phenol uptake of grain sample is slightly lower than powder sample. This behavior may be associated to a lower available surface for adsorption as well as a high mass transfer limitation in the grains respect to the powder.
The obtained curves were fitted with the adsorption models of Langmuir, Freundlich and Temkin, as discussed in the experimental part. A comparison between experimental data and models is reported in Figure 6.
From a qualitative point of view, Langmuir seems to be the best fitting model, especially for commercial activated carbons. For all samples, as the solution concentration increases an adsorbed amount plateau was observed, indicating that the adsorption occurs by a saturation mechanism, as proposed by Langmuir model. For instance, Freundlich model does not provides a plateau value, as may be easily intuited from the equation; therefore, it cannot be considered a good model for the investigated activated carbons.
The estimation of model parameters was carried out by linear regression and the obtained results are reported in Table 2.
Figure 6. Equilibrium data fitted with adsorption isotherms models. Langmuir (continuous line), Freundlich (dashed line) and Temkin (dashed-dotted line)
Table 2. Parameters of adsorption isotherms models
|
Sample |
Lagmiur |
Freundlich |
Temkin |
|||
|
|
QMAX |
KL |
KF |
n |
AT |
BT |
|
SP1000 |
270 |
1.7e-2 |
45.6 |
0.26 |
4.1e-2 |
47 |
|
SP800 |
233 |
3e-3 |
19.9 |
0.31 |
2.9e-1 |
46 |
|
SPBCP |
104 |
5.4e-4 |
1.1 |
0.52 |
1.5e- |
29 |
|
SPBCG |
65 |
9.4e-4 |
4.8 |
0.29 |
1.5e-2 |
12 |
|
|
F-value |
|||||
|
SP1000 |
562 |
18 |
72 |
|||
|
SP800 |
400 |
76 |
130 |
|||
|
SPBCP |
123 |
129 |
93 |
|||
|
SPBCG |
265 |
120 |
140 |
|||
F-test values confirms Langmuir as the best fitting model. The adsorption maximum capacity follows the order SP1000>SP800>SPBCP>SPBCG. Also the equilibrium constant follows this order, suggesting that the adsorption is most favorable over samples with higher KL value.
In this work, the phenol removal from water by carbons was studied. The adsorption performances of both commercial activated carbons and bio-chars produced from gasification or pyrolysis were assessed. The batch adsorption tests allowed to obtain information about both kinetics and thermodynamics behavior of selected carbons. Commercial activated carbons exhibit superior performances in terms of efficiency of phenol removal, adsorption rate and adsorption capacity respect to biochars. On the whole, activated carbons with the highest surface showed the best performances with a maximum adsorption capacity of 270 mg/g. While, biochar produced from pyrolysis and gasification exhibits a maximum phenol adsorption capacity of 104 and 65 mg/g, respectively.
It is important to underline that the biochar samples studied in this work were neither chemically nor thermally treated, therefore they can be considered as a very low cost material respect to commercial activated carbons. Hence, the viability of utilization of biochars for phenol removal should be also assessed from an economic point of view.
[1] Haghseresht, F., Lu, G.Q. (1998). Adsorption characteristics of phenolic compounds onto coal-reject-derived adsorbents. Energy & Fuels, 12(6): 1100-1107. https://doi.org/10.1021/ef9801165
[2] Lacorte, S., Barcelo, D. (1994). Rapid degradation of fenitrothion in estuarine waters. Environmental Science & Technology, 28(6): 1159-1163. https://doi.org/10.1021/es00055a029
[3] Guidelines for Drinking-water Quality. (2008). World Health Organization. https://www.who.int/water_sanitation_health/dwq/fulltext.pdf.
[4] Bansal, R.C., Donnet, J.B., Stoeckli, F. (1988). Active Carbon. Dekker, New York.
[5] Roop Chand Bansal and Meenakshi Goyal. (2005). Activated Carbon Adsorption, CRC Press, ISBN: 9781420028812.
[6] Rodriguez-Reinoso, F. (1997). Activated carbon: Structure characterization preparation and applications, Introduction to Carbon Technologies. Chapter 2, 35.
[7] Tessmer, C.H., Vidic, R. D., Uranowski, L.J. (1997). Impact of oxygen-containing surface functional groups on activated carbon adsorption of phenols. Environmental Science & Technology, 31(7): 1872-1878. https://doi.org/10.1021/es960474r
[8] Moreno-Castilla, C., Rivera-Utrilla, J., Joly, J.P., López-Ramón, M.V., Ferro-García, M.A., Carrasco-Marín, F. (1995). Thermal regeneration of an activated carbon exhausted with different substituted phenols. Carbon, 33(10): 1417-1423. https://doi.org/10.1016/0008-6223(95)00090-Z
[9] Dąbrowski, A., Podkościelny, P., Hubicki, Z., Barczak, M. (2005). Adsorption of phenolic compounds by activated carbon - a critical review. Chemosphere, 58(8): 1049-1070. https://doi.org/10.1016/j.chemosphere.2004.09.067
[10] Villacañas, F., Pereira, M.F.R., Órfão, J.J., Figueiredo, J.L. (2006). Adsorption of simple aromatic compounds on activated carbons. Journal of Colloid and Interface Science, 293(1): 128-136. https://doi.org/10.1016/j.jcis.2005.06.032
[11] Özkaya, B. (2006). Adsorption and desorption of phenol on activated carbon and a comparison of isotherm models. Journal of Hazardous Materials, 129(1-3): 158-163. https://doi.org/10.1016/j.jhazmat.2005.08.025
[12] Tancredi, N., Medero, N., Möller, F., Píriz, J., Plada, C., Cordero, T. (2004). Phenol adsorption onto powdered and granular activated carbon, prepared from Eucalyptus wood. Journal of Colloid and Interface Science, 279(2): 357-363. https://doi.org/10.1016/j.jcis.2004.06.067
[13] Rodrigues, L.A., da Silva, M.L.C.P., Alvarez-Mendes, M. O., dos Reis Coutinho, A., Thim, G.P. (2011). Phenol removal from aqueous solution by activated carbon produced from avocado kernel seeds. Chemical Engineering Journal, 174(1): 49-57. https://doi.org/10.1016/j.cej.2011.08.027
[14] Limousin, G., Gaudet, J.P., Charlet, L., Szenknect, S., Barthes, V., Krimissa, M. (2007). Sorption isotherms: A review on physical bases, modeling and measurement. Applied Geochemistry, 22(2): 249-275. https://doi.org/10.1016/j.apgeochem.2006.09.010