OPEN ACCESS
Design of biorefineries has been often addressed by process flowsheet optimization tools without adequately considering the local biomass availability. In particular, the optimal plant size does not depend simply on the economies of scale, but also on the biomass feedstock availability and the topology of the territory affecting logistics costs. On the other hand, works aiming at the supply chain optimization consider literature data or approximate correlations to estimate biorefinery technical performance, capital and operating expenditure. The analysis of the biomass availability was developed in the framework of the Basilicata region where residual straw appears to be the most abundant product with an overall production of 400 kton/y. The paper also describes the current value chains and provides some potential scenarios for the conversion to biobased products. In particular, two biobased biorefineries were considered: case 1) production of fuel grade ethanol through the sugar platform; case 2) co-digestion of biomass feedstocks to produce biomethane. The analysis indicated that in the Basilicata region the fuel grade ethanol production offers concrete advantages in terms of CO2 reduction. On the other side, mixed feeding of biogas plants produces a biofuel with a higher energy density thanks to the increased plant production, but lower CO2-equivalent savings.
lignocellulosic biomass, environmental savings, bioethanol, biomethane
Renewable fuels and especially biofuels are key to achieve the reduction of the carbon footprint in the transports sector that will continue to rely on internal combustion engines in the transition step toward the new mobility modes.
Advanced biofuels are strongly supported by the recent European regulation Renewable Energy Directive II (RED II). They include bioethanol, biomethane, biodiesel, aviation biofuels, and they have to be produced by a sustainable feedstock [1].
Biomass feedstock represents one key issue in determining the final biofuels cost and overall sustainability. In fact, one of the main challenges of a bio-based economy is the high transportation and handling costs resulting from the biomass heavy bulk load and low energy density and the high processing costs as compared to conventional fuels. To compete with fossil fuels, biomass should be available directly where it is transformed to fuels and where fuels are used. Biomass that does not compete directly with the food industry should be used, like agricultural and forest residues [2]. Several works aim to assess a techno-economic analysis of biorefineries producing liquid fuels (i.e., ethanol) [3], solid fuels (i.e., pellet) [5], chemicals (i.e., levulinic acid, succinic acid) [6]. Other works aim to assess supply chain optimization [7] for the biomass-biorefineries. Bioethanol is the most used biofuel. Few biorefineries capable of transforming residual lignocellulosic biomass into ethanol are currently running throughout the world [8]. These second-generation biorefineries are limited due to the high investments they need in the case of small sizes (below 400,000 t/y of feedstock). On the contrary, however, large biorefineries require high quantities of biomass that cannot be obtained within a short supply chain. Use of locally available feedstocks is expected to reduce the CO2-emissions.
Alternatively, biomethane is a gaseous biofuel, that can be produced by anaerobic digestion of organic wastes that represent an attractive renewable carbon source from both economic and environmental point of view [9]. Biomethane is obtained through the upgrading of biogas, namely a mixture of methane and carbon dioxide with minor quantities of nitrogen, hydrogen sulfide and volatile organic compounds.
Depending on the process conditions, the CH4/CO2 molar ratio ranging from 1.1 to about 2.5. Biogas may be used as fuel in internal combustion engines although it rises several technical/environmental concerns.
Many studies use the LCA methodology to evaluate the environmental performance of the biofuels processes [10-13]. In this context, Martinez-Hernandez et al. [14] proposed a simplified environmental impact analysis tailored to aid on the design and decision-making process for biorefineries system to achieve environmental objectives. The methodology can provide process insights by making use of linear relationships between mass/energy flowrates and environmental parameters. The effectiveness of the method and its straightforward incorporation into the process synthesis steps makes it an interesting choice for process evaluation tool.
In this work, a methodology to estimate the environmental impact (or savings) of biofuels is proposed for the use of local straws to produce biofuels in the Basilicata region. Two reference scenarios are considered 1) Conversion of straw in a novel biorefinery producing second generation bioethanol;
2) delivery of straw to the existing anaerobic digestion plants to increase the biomethane production. The CO2 equivalent reduction in 2 cases has been estimated.
estimating
Table 1. Straw composition [3]
|
Solid fraction (%DRY) |
82 |
Ash (% solid fraction) |
5.2 |
|
Soluble fraction (%DRY) |
18 |
Acetate (% solid fraction) |
2.9 |
|
Cellulose (% solid fraction) |
42.7 |
Sucrose (% soluble fraction) |
19.6 |
|
Hemicellulose (% solid fraction) |
31.4 |
Extractives (% soluble fraction) |
80.4 |
|
Lignin (% solid fraction) |
17.8 |
Moisture (%) |
25 |
Table 2. Biogas plants in the Basilicata Region by Atlaimpianti
|
Location |
Feedstock flowrate ( tDRY/y) |
Location |
Feedstock flowrate (tDRY/y) |
|
Matera |
1,500 |
Baragiano |
1,050 |
|
Pisticci |
9,000 |
Baragiano |
1,500 |
|
Tricarico |
75 |
Lavello |
510 |
|
Atella |
750 |
Lavello |
510 |
|
Banzi |
7,492 |
Lavello |
3,735 |
|
Grumento Nova |
1,500 |
Melfi |
7,492 |
|
Lauria |
825 |
Potenza |
3,712 |
|
Brindisi Montagna |
1,500 |
Tramutola |
1,500 |
|
Filiano |
555 |
Viggiano |
1,500 |
|
Forenza |
742 |
Viggiano |
1,500 |
This section reports the process configurations investigated in this study and the methodology used to assess and analyze each case. The commercial software Aspen PlusTM V.10 was used for process simulation. Straw was considered in the analysis because this biomass is the most abundant in the Basilicata Region (about 400 kt/y). Table 1 shows the biomass composition considered in this work. For the case of bioethanol production available straw was obtained through the ENEA’s national Atlas of biomass. The biomass availability referred to 2017 and was calculated from the annuals grains productivity in the ISTAT census. The overall biomass potential was then multiplied by 0.4 accounting for the need to leave roughly 60 % of biomass on the fields [15]. For the case of biomethane production, 20 biogas plants already existing in Basilicata were considered (Table 2). In this case, available straw was fed to the plants after a chemical-physical pretreatment facilitating the microbial conversion to biomethane the second-generation biogas is produced from lignocellulosic biomass derived from agricultural waste, forest waste, municipal and industrial waste, and non-edible plants such as grass and aquatic plants. Moreover, all these resources share the characteristic that they are formed from non-food resources [16].
Several lignocellulosic biomass pretreatments can improve the methane yield by anaerobic fermentation [16]. Steam Explosion of corn stover or straw was studied by Lizasoain et al. [17] and Siddhu et al. [18]. The steam explosion technology was selected based on some previous publications [19-20].
2.1 Process simulation description for bioethanol production
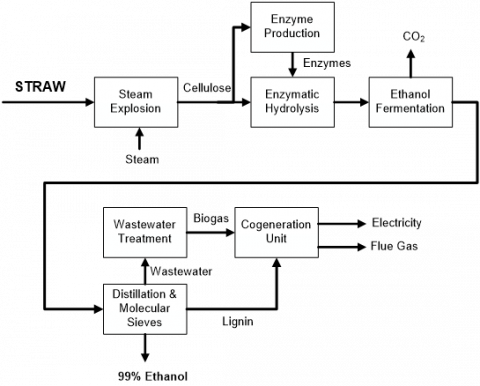
Process simulation suites can be successfully used to perform the process design of lignocellulosic biorefineries [21]. In the present study, Aspen PlusTM v10 was used to simulate a biorefinery producing bioethanol from lignocellulosic biomass using. Plant capacity of 158,000 t/y of dry feedstock, corresponding to a total of 7200 h per year, was assumed based on common figures reported in the literature [22-24]. Components from Aspen PlusTM databank were used whenever possible with NREL components and properties being added to complement the missing data from Aspen. Non-random two liquid (NRTL) property method was selected for the simulations. Straw is fed to the pretreatment section based on the Steam Explosion (SE) technology. The steam explosion route was modeled assuming a steam explosion unit using medium pressure steam at 200°C with a residence time of 3 min [25]. After the steam explosion reactor, a flash operation is performed in which the volatile fraction is removed from the product stream, also containing water and biomass degradation products that can act as fermentation inhibitors. A filter separates the solid and liquid fractions from the bottom product of the flash and the stream is then sent to the fermentation section. Figure 1 shows the block diagram of the lignocellulosic biorefinery considered in this work. Separate Hydrolysis and Fermentation (SHF) were employed to convert the biomass into sugar monomers and latter to ethanol. Cellulase enzymes were produced in an in situ plant using a small amount of cellulose as substrate [26]. Hydrolysis was carried at 48°C and the reactions rate was obtained from the published articles referenced in each pretreatment section. The hydrolysis reactor residence time was defined as 84h and afterward, the slurry was cooled to 35°C and sent to the fermentors. Zymomonas mobilis was responsible for the fermentation reactions with a total conversion rate of 95 % for the glucose and 85 % of the xylose. The fermentation process required a total of 36 h of residence time and the fermentation gases were sent to the vent scrubber in the product purification section. The fermentation broth was initially sent to a beer well and from there it was sent to the beer column. The beer column separates the fermentation broth in three streams. The overhead product is mainly composed of carbon dioxide and a diluted ethanol beer (around 3 % w/w). The overhead stream is mixed with the carbon dioxide produced in the fermentation tanks and sent to a vent scrubber where water in a countercurrent flow recovers most of the ethanol carried in the gas stream. The carbon dioxide from the scrubber is vented whereas the water-ethanol stream is sent back to the beer well. The bottom product of the beer column contains unconverted biomass, inorganic impurities and water. The bottom stream is filtered, and the solids are sent for combustion and co-generation of heat and power, whereas the water is sent for wastewater treatment and recycled back to the process. From the beer column, a side stream is drawn with an ethanol concentration of 40 % (w/w). This stream is sent to the rectifying column where ethanol is concentrated near to its azeotropic point. The overhead from the rectifying column containing ethanol is fed to the molecular sieves where it is further dehydrated to reach the fuel grade category. The bottom stream from the rectifying column contains water pure enough to be used in the process without further purification. The unconverted biomass and lignin can be burned to produce high-pressure steam and electricity. The lignin stream, coming from the separation section, is sent to the lignin combustion coupled with a Rankine cycle. High-pressure steam is produced in the boiler and is sent to the steam turbine train at three pressure levels [14]. A heat exchanger transfers the heat of the flue-gas produced into the equilibrium reactor to the water, in such quantities to produce steam at 500 °C and 96 bar. At the end of the expansion (5 bar), the steam is still overheated, avoiding problems caused by the presence of water droplets in the latest expansion stages.
Figure 1. Ethanol biorefinery block diagram
A backpressure configuration of the co-generation section was chosen considering the high vapor requirement of the process. The heart of the system is the multistage turbine, connected to an alternator to generate electricity. During the steam explosion, two extractions are performed. The first one at 40 bar and the second one at 16 bar available for any utilities, from which the various steam users in the plant (distillation columns, etc.) are fed. The turbine discharges directly into the low-pressure steam line of the plant (about 5 bar). Since there is no vapor condensation section, the corresponding high cooling water requirements and the high costs and consumptions associated with an air cooling system (towers, fans, etc.) are avoided. The expected expansion rates are those that are usually obtainable in steam turbines, between 82 and 85 % (higher for intermediate stages, where the expansion curve is less elongated). Finally, there is a make-up stream for the fluid that performs the thermodynamic cycle. In the water treatment section, the residues of ethanol, glucose, xylose and lignin are transformed into biogas and sent to the cogeneration section and the water is purified or treated for process recycling use (Martinez-Hernandez et al., 2014). The liquid stream from the beer column containing suspended cellulose is initially hydrolyzed and the resulting stream is sent to an anaerobic digester, where biogas is obtained. The product from the digestor is directed to the combustion area, whereas the water is recycled back to the process.
Biorefinery processes contain several streams with different temperature targets spread along with the plant. A heat integration together with a heat exchanger network can be employed to reduce the utility consumption and the environmental impacts associated with them, and at the same time increase the profitability of the setups. In all the setups, a minimum temperature difference of 10°C was used to calculate the final utility target. The process heat integration also allows the identification of the quality and the amount of steam necessary to supply the process and attune the co-generation stage for the process requirements.
Table 3. Process simulation parameters
|
Parameter |
Value |
Parameter |
Value |
|
Straw available (kt/y) |
158 |
OFMSW (kt/y) |
47 |
|
Cellulose to C6 conv. (%) |
81 |
Steam to biomass in SE (t/t) |
1 |
|
Hemicellulose to C5 conv. (%) |
29 |
Hemicellulose to C5 conv. (SE, %) |
78 |
|
C6 to ethanol conv.n (%) |
95 |
Straw/OFMSW feeding ratio |
0.5 |
|
C5 to ethanol conv. (%) |
85 |
Biogas yield (Nm3/tDRY) |
378 |
|
Enzyme need (kg/tCELL) |
100 |
Membrane biomethane recovery (%) |
99 |
|
Ethanol yield in the molecular sieves (%) |
99 |
Biomethane purity (%) |
99 |
2.2 Process simulation description for biomethane production
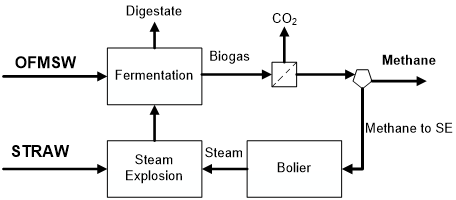
The anaerobic digestion (AD) system considered in this work was based on the works of Migliori et al. [27] and Li et al. [28] and it was not included in the process simulation but was considered for environmental aspects. The base of calculation was 20 biogas plants operative in Basilicata. Biogas plants can use as feedstock the organic fraction of the municipal solid waste (OFMSW) or other traditional fermentable material. Feedstock flowrates are summarized in Table 2. OFMSW (about 27 wt % of solid content) that are continuously pumped in a horizontal reactor keeping a residence time of about one month under mesophilic conditions.
Figure 2. Biomethane plant block diagram
The produced gas containing methane, carbon dioxide and contaminants such as hydrogen sulfide and volatile organic compounds is assumed to be treated with an upgrading system consisting of chemical scrubbers and active carbon filters able to obtain highly purified biogas with a CH4/CO2 molar ratio equals to 1.5 [28]. Finally, commercial membranes are used for CH4/CO2 separation obtaining methane with purity higher than 99.5 % [29]. Digestate is assumed to be disposed of in landfills.
2.3 Process simulation was used to obtain the performance of biomethane digester plants.
Figure 2 shows the block diagram for the biomethane production plants. Steam Explosion pretreatment was simulated like in the biorefinery case. SE-pretreated straw was fed to the anaerobic digester together OFMSW with a ratio 50/100 respectively. Biogas produced was compress by an isoentropic compressor to 12 bar. Biogas was sent to the membrane unit where biomethane was purified. A small fraction of biomethane was used to produce the medium pressure steam for the Steam Explosion.
Table 4. CO2-equivalent emission parameters
|
Parameter |
Value |
Parameter |
Value |
|
Electricity (kgCO2eq/MWhe) [3] |
600 |
Biomass transport (kgCO2eq/(t km) [7] |
0.1 |
|
Straw (kgCO2eq/t) [29] |
-1,449 |
Process water (kgCO2eq/t) [3] |
6.5 |
|
OFMSW (kgCO2eq/t) [30] |
1,597 |
Digestate (kgCO2eq/t) [30] |
1,597 |
|
Gasoline (kgCO2eq/t) [31] |
3,765 |
Fossil methane (kgCO2eq/t) [32] |
3,110 |
2.4 Environmental impact analysis
Table 5. Main process results
|
Case |
Bioethanol |
Biomethane |
|
Straw utilization (kt/y) |
158 |
23 |
|
OFMSW utilization (ktDRY/y) |
- |
47 |
|
Ethanol yield (t/h) |
4.1 |
- |
|
Electricity production (MWe) |
10.2 |
0 |
|
CO2 from fermentation (t/h) |
3.4 |
8.1 |
|
Biomethane to sell (t/h) |
- |
2.8 |
|
Biomethane to boiler (%) |
- |
5 |
|
Electricity consumption (MWe) |
0.6 |
1.1 |
|
Process water consumption (t/h) |
29 |
4 |
|
Cooling water make-up (t/h) |
81 |
0 |
|
Flue gas (t/h) |
27 |
- |
|
Biobased TJ/y produced |
785 |
1,003 |
In order to assess the environmental impact of the two different study cases, the total CO2-equivalent emissions for both cases were calculated. Table 4 shows the CO2-equivalent parameters used. Environmental savings for the straw feedstock is the net value related to the carbon dioxide binding from the straw production (1.606 kg of CO2/kg of straw) minus the carbon dioxide emitted in the production process (0.1496 kg of CO2/kg of straw), resulting in a total absorption of 1.456 kg of CO2/kg of straw [33]. The CO2 avoid using OFMSW material (no landfill) was estimated by Perez et al. [30]. Biomass transport was considered by the ArcGis 10 Network Analyst extension. In particular, in order to find best location for new biomass plants, the location-allocation analysis was performed using the p-median problem solver included in the ArcGis 10 Network Analyst extension [34]. Single biorefinery scenario was applied in this work
Simulation results for the ethanol production case are summarized in Table 5. Ethanol yield was equal to 19 % (t/tDRY) using 158 kt/y of straw. Thanks to cogeneration unit burning residual lignin and biogas from wastewater treatment unit, more than 10 MWeGROSS are produced (9.6 MWeNET).
Table 5. Main environmental results (tCO2eq/h)
|
Case |
Bioethanol |
Biomethane |
|
OFMSW |
- |
-11.6 |
|
Digestate |
- |
5.6 |
|
Flue gas |
26.5 |
0.4 |
|
Wastewater |
0 |
- |
|
CO2 from fermentation |
3.4 |
8.0 |
|
Electricity |
-5.8 |
0.7 |
|
Process water |
0.2 |
0 |
|
Cooling water |
0.5 |
0 |
|
Straw |
-32 |
-5.9 |
|
Bioethanol |
-1.4 |
- |
|
Biomethane |
- |
-1.0 |
|
Transportation |
0.4 |
0 |
|
Total |
-8.1 |
-4.1 |
Process water consumption is related to the steam consumption for the steam explosion. The plant is self-sustaining from the energy point of view both in terms of electricity consumption (0.6 MWe) and steam consumption for distillation columns and steam explosion, thanks to the thermal integration. However, an enormous amount of flue gas is produced in the cogeneration unit. From the environmental point of view, the production of electricity from the biorefinery provides a strong contribution to the equivalent CO2 savings (about 5.8 tCO2eq/h avoided). The end-life ethanol emissions (1.9 kgCO2/kgEtOH) involve a low CO2 saving of - 1.4 tCO2eq/h. Thanks to the short supply chain of biomass the transportation accounts for 0.4 tCO2eq/h, less than the make-up cooling water consumption. Globally, CO2-equivalent reduction is equal to 8.1 tCO2eq/h. As shown in Table 6, the final CO2-equivalent saving for each GJ of fuel is equal to 75 kgCO2eq/GJ.
3.2 Biomethane production
For the biomethane production case, only 23 kt/y of straw is fed to the existing anaerobic digesters. This limit is due to the number and size of the existing biogas plants in Basilicata and the optimal ratio of organic wastes to lignocellulosic wastes. Electricity is not produced in this case. The amount of water is due to the medium pressure steam consumed in the steam explosion. The total GJ of fuel is higher than that of bioethanol thanks to the high LHV of methane compared to LHV of ethanol. However, a large quantity of CO2 is released into the atmosphere due to the CO2 separated into the membrane separation process. Only a small amount of the methane produced is necessary to produce the medium pressure steam for the steam explosion. Total electricity consumption is very high due to the need to compress the biogas before the membrane separation. A large amount of CO2 has avoided thanks to the use of OFMSW (11.6 t/h), while only 5.9 t/h of saving is obtained from lignocellulosic biomass. Transportation emissions are negligible because waste and biomass are produced near 20 plants considered. The end-of-life emissions of biomethane are very similar to those of fossil methane, hence a low saving value from the replacement of fossil fuel. Globally, CO2-equivalent reduction is equal to 4.1 tCO2eq/h. Consequently, the saving of CO2 is equal to 29 kgCO2/GJ, a value lower than that obtained in the case of bioethanol. This is due to the lack of co-production of electricity in the case of biomethane production.
Table 6. Comparison between the environmental impact of the biofuels
|
Case |
kgCO2eq/GJ |
|
Bioethanol |
-75 |
|
Biomethane |
-29 |
In this work, a novel approach to the more sustainable approach to the use of locally available biomass was presented. In particular, the environmental savings for two advanced biofuels production cases were considered: bioethanol production by a novel lignocellulosic biorefinery and biomethane production by co-feeding anaerobic digestion. Available straws in the Basilicata region territory was considered to feed the biorefineries, also considering the transportation environmental costs. The bioethanol production leads to high CO2 emission savings thanks to higher CO2 absorption by lignocellulosic biomass and the green electricity coproduction. The co-digestion of pretreated lignocellulosic biomass feedstocks leads to high-density fuels production, but globally to lower CO2-equivalent savings per GJ produced. This because of the lack of green electricity coproduction. On the whole, bioethanol appears a more sustainable option especially if also the consumption of ethanol takes place in the same production region. This would require a huge investment in novel and complex infrastructures. On the other hand, biomethane production technologies are more mature in the near future.
[1] European Commission, European Renewable Energy Directive II (RED II) - Part A of Annex IX. 2018.
[2] Joelsson E, Wallberg O, Börjesson P. (2015). Integration potential, resource efficiency and cost of forest-fuel-based biorefineries. Computers & Chemical Engineering 82: 240–258. 2015. https://doi.org/10.1016/j.compchemeng.2015.07.011
[3] Silva ARG, Giuliano A, Errico M, Rong BG, Barletta D. (2019). Economic value and environmental impact analysis of lignocellulosic ethanol production: Assessment of different pretreatment processes. Clean Technologies and Environmental Policy. https://doi.org/10.1007/s1009 8-018-01663 -z
[4] Silva ARG, Torres Ortega CE, Rong BG. (2016). Techno-economic analysis of different pretreatment processes for lignocellulosic-based bioethanol production. Bioresource Technology 218: 561–570. https://doi.org/10.1016/j.biortech.2016.07.007
[5] Clauser NM, Area MC, Felissia FE, Vallejos ME, Gutiérrez S. (2018). Techno-economic assessment of carboxylic acids, furfural, and pellet production in a pine sawdust biorefinery. Biofuels, Biop. Bioref 1–16. https://doi.org/10.1002/bbb.1915
[6] Giuliano A, Cerulli R, Poletto M, Raiconi G, Barletta D. (2016). Process pathways optimization for a lignocellulosic biorefinery producing levulinic acid, succinic acid, and ethanol. Ind. Eng. Chem. Res 55(40): 10699–10717. https://doi.org/10.1021/acs.iecr.6b01454
[7] Galanopoulos C, Barletta D, Zondervan E. (2018). A decision support platform for a bio-based supply chain: Application to the region of Lower Saxony and Bremen (Germany). Computers & Chemical Engineering 115: 233–242. https://doi.org/10.1016/j.compchemeng.2018.03.024
[8] Hassan SS, Williams GA, Jaiswal AK. (2019). Lignocellulosic Biorefineries in Europe: Current State and Prospects. Trends Biotechnol https://doi.org/10.1016/j.tibtech.2019.03.001
[9] Mao C, Feng Y, Wang X, Ren G. (2015). Review on research achievements of biogas from anaerobic digestion. Renew. Sust. Energ. Rev. 45: 540–555. https://doi.org/10.1016/j.rser.2015.02.032
[10] Cherubini F, Ulgiati S. (2010). Crop residues as raw materials for biorefinery systems - A LCA case study. Applied Energy 87(1): 47–57. https://doi.org/10.1016/j.apenergy.2009.08.024
[11] Karlsson H, Barjesson P, Hansson P, Ahlgren S. (2014). Ethanol production in biorefineries using lignocellulosic feedstock-GHG performance, energy balance and implications of life cycle calculation methodology. J. Clean. Prod 83(0): 420–427. https://doi.org/10.1016/j.jclepro.2014.07.029
[12] Moreno J, Dufour J. (2015). Life cycle assessment of lignocellusosic bioethanol: environmental impacts and energy balance. Renew. Sustain. Energy Rev 42: 1349–61. https://doi.org/10.1016/j.rser.2014.10.097
[13] Pourbafrani M, McKechnie J, Shen T, Saville BA, Maclean HL. (2014). Impacts of pre-treatment technologies and co-products on greenhouse gas emissions and energy use of lignocellulosic ethanol production. J. Clean. Prod 78: 104–111. https://doi.org/10.1016/j.jclepro.2014.04.050
[14] Martinez-Hernandez E, Campbell GM, Sadhukhan J. (2014). Economic and environmental impact marginal analysis of biorefinery products for policy targets. https://doi.org/10.1016/j.jclepro.2014.03.051
[15] Mancini AM, Berton CM, Apote CLD, Pari CL, Sandro E, Andrea SD. (2013) Biomasse and energia. Sandit ISBN: 000-8-89-599051-4
[16] Martínez-Gutiérrez E. (2018). Biogas production from different lignocellulosic biomass sources: advances and perspectives. 3 Biotech 8(5): 233-233. https://doi.org/10.1007/s13205-018-1257-4
[17] Lizasoain J, Trulea A, Gittinger J, (2017). Corn stover for biogas production effect of steam explosion pretreatment on the gas yields and on the biodegradation kinetics of the primary structural compounds. Bioresource Technology 244(8): 949–956. https://doi.org/10.1016/j.biortech.2017.08.042
[18] Hanan SMA, Li J, Zhang J, Huang Y, Wang W, Chen C, Liu G. (2016) Improve the anaerobic biodegradability by copretreatment of thermal alkali and steam explosion of lignocellulosic waste. BioMed Research International 2016: 1-10. https://doi.org/10.1155/2016/2786598
[19] Verardi A, Blasi A, Bari ID, Calabrò V. (2016). Steam pretreatment of Saccharum officinarum L. bagasse by adding of impregnating agents for advanced bioethanol production. Ecotoxicology and Environmental Safety 134(1): 293-300. https://doi.org/10.1016/j.biortech.2017.08.042
[20] Bari ID, Cuna D, Matteo VD, Liuzzi F. (2014). Bioethanol production from steam-pretreated corn stover through an isomerase mediated process. New Biotechnol 31(2): 185-195. https://doi.org/10.1016/j.nbt.2013.12.003
[21] Giuliano A, Poletto M, Barletta D. (2015). Process design of a multi-product lignocellulosic biorefinery. Computer Aided Chemical Engineering 27: 1313–1318. https://doi.org/10.1016/B978-0-444-63577-8.50064-4
[22] Aden A, Foust T. (2009). Technoeconomic analysis of the dilute sulfuric acid and enzymatic hydrolysis process for the conversion of corn stover to ethanol. Cellulose. 16(4): 535–545. https://doi.org/10.1007/s10570-009-9327-8
[23] Humbird D, Davis R, Tao L, Kinchin C, Hsu D, Aden A. (2011). Process design and economics for biochemical conversion of lignocellulosic biomass to ethanol tech. Rep. NREL/TP-5100-47764
[24] Tao L, Aden A, Elander RT, Pallapolu VR, Lee YY, Garlock RJ, Balan V, Dale BE, Kim Y, Mosier NS, Ladisch MR, Falls M, Holtzapple MT, Sierra R, Shi J, Ebrik MA, Redmond T, Yang B, Wyman CE, Thomas BHS, Warnerj RE. (2011). Process and technoeconomic analysis of leading pretreatment technologies for lignocellulosic ethanol production using switchgrass. Bioresource Technology 102(24): 11105-11114. https://doi.org/10.1016/j.biortech.2011.07.051
[25] Zimbardi F, Ricci E, Braccio G. (2002). Technoeconomic study on steam explosion application in biomass processing. Applied Biochemistry and Biotechnology 98(100): 89–99. https://doi.org/10.1385/ABAB:98-100:1-9:89
[26] Giuliano A, Barletta D, Bari ID, Poletto M. (2018). Techno-economic assessment of a lignocellulosic biorefinery co-producing ethanol and xylitol or furfural. Computer Aided Chemical Engineering 585–590. https://doi.org/10.1016/B978-0-444-64235-6.50105-4
[27] Migliori M, Catizzone E, Giordano G, Pera AL, Sellaro M, Lista A, Zanardi G, Zoia L. (2019). Pilot plant data assessment in anaerobic digestion of organic fraction of municipal waste solids. Processes 7(1): 54. https://doi.org/10.3390/pr7010054
[28] Li Y, Park SY, Zhu J. (2011). Solid-state anaerobic digestion for methane production from organic waste. Renewable and Sustainable Energy Reviews 15(1): 821–826. https://doi.org/10.1016/j.rser.2010.07.042
[29] Galanopoulos C, Odierna A, Barletta D, Zondervan E. (2017). Design of a wheat straw supply chain network in Lower Saxony, Germany through optimization. Computer Aided Chemical Engineering 40: 871–876. https://doi.org/10.1016/B978-0-444-63965-3.50147-1
[30] Pérez J, de Andrés JM, Lumbreras J, Rodríguez, E. (2018). Evaluating carbon footprint of municipal solid waste treatment: Methodological proposal and application to a case study. Journal of Cleaner Production 205: 419-431. https://doi.org/10.1016/j.jclepro.2018.09.103
[31] Sadhukhan J, Ng KS, Hernandez EM. (2014). Combined economic value and environmental impact (EVEI) analysis. Biorefineries and Chemical Processes 189–205. https://doi.org/10.1002/9781118698129.ch7
[32] Lerner A, Brear MJ, Lacey JS, Gordon RL, Webley PA. (2018). Life cycle analysis (LCA) of low emission methanol and di-methyl ether (DME) derived from natural gas. Fuel 220: 871–878. https://doi.org/10.1016/j.fuel.2018.02.066
[33] Elsgaard L. (2010). Greenhouse gas emissions from cultivation of winter wheat and winter rapeseed for biofuels. according to the Directive 2009/28/EC of the European Parliament on the promotion of the use of energy from renewable sources
[34] Sultana A, Kumar A. (2012). Optimal siting and size of bioenergy facilities using geographic information system. Applied Energy 94: 192–201. https://doi.org/10.1016/j.apenergy.2012.01.052