Md. Ahsan Ullah![]() | Sk. Humayra Afrin
| Sk. Humayra Afrin![]() | Kazi Mohammad Nazib
| Kazi Mohammad Nazib![]() | Raju Roy
| Raju Roy![]() | Lasker Ershad Ali*
| Lasker Ershad Ali*![]()
© 2023 IIETA. This article is published by IIETA and is licensed under the CC BY 4.0 license (http://creativecommons.org/licenses/by/4.0/).
OPEN ACCESS
Parkinson’s disease is a brain condition that causes involuntary or uncontrolled movements, including tremors, rigidity, and problems with balance and coordination. People of various racial and cultural backgrounds are affected by Parkinson’s disease. Early diagnosis of Parkinson’s disease is essential to slow neurodegeneration, making the disease’s prognosis even more important. This paper explores the prediction of Parkinson’s disease utilizing various feature selection techniques and combinations of classifiers. Four distinct feature selection techniques: variance threshold, information gain, chi-square, and principal component analysis (PCA) are utilized in this research. We have adopted Support Vector Machine (SVM), K-Nearest Neighbors (KNN), Decision Tree, Random Forest, Gaussian Naive Bayes, XGBoost, and AdaBoost classification techniques to predict Parkinson’s disease. For the experimental evaluation, we have used the UCI machine learning Parkinson’s speech recording signal dataset. The combination of PCA and KNN for correlation distance function provides 92.10% accuracy which is superior performance compared to other combinations of feature selection techniques and machine learning classifiers. In the future, if AI-based predictive models of Parkinson’s disease can be developed, healthcare professionals will benefit from reducing neurodegeneration.
Parkinson’s disease, machine learning algorithms, feature selection, PCA, KNN, distance functions
Parkinson’s disease is a neurological disorder. It affects millions of people worldwide and is chronic and progressive. According to the World Health Organization, Parkinson's disease is a degenerative condition of the brain that causes several non-motor symptoms in addition to motor ones [1]. In the substantia nigra region of the brain dopaminergic neurons degenerate in this disease, causing several motor and non-motor symptoms [2]. Less than 1% of the world’s population, or around 10 million people, have been affected by this disease. The majority of those who develop Parkinson’s disease are over 60 years old, while one in 10 are under 50. Moreover, men are impacted slightly more than women [3]. In 1990, there were an estimated 2.5 million persons with Parkinson’s disease; by 2015, that figure had more than doubled to 6.2 million [4]. Parkinson’s disease is expected to affect more than 12 million individuals globally by the year 2040 [5]. There is currently no known treatment for this disease]. Even though there are several pharmaceutical treatments available, the disease still causes complications [6-8]. As a result, it is more challenging to identify and care for people who suffer as a result of Parkinson’s disease.
In recent years, machine learning approaches have received increased focus as a possible tool for Parkinson's disease detection and diagnosis. Machine learning algorithms are capable of large-scale data analysis and identification of patterns that may be difficult for human therapists to see.
Magnetic resonance imaging (MRI) and single-photon emission computed tomography (SPECT) data may be used to diagnose Parkinson’s disease using machine learning [9, 10]. Researchers and medical experts want to create trustworthy and effective methods for the early detection and monitoring of Parkinson’s disease by utilizing the power of machine learning. Machine learning is used to identify Parkinson’s disease by analyzing a variety of data types, including clinical evaluations, neuroimaging data, and MRI data [11]. These data sources allow for the development of prediction models that may precisely identify individuals at risk of developing Parkinson’s disease or those who have already been diagnosed, as well as important insights into the underlying causes of the disease.
Since the number of Parkinson’s disease sufferers has been steadily growing. As a result, it is essential to diagnose it early. Nowadays, speech signals are usually used to identify Parkinson’s disease. However, the vast number of speech signal features is responsible for the long execution time. So, taking this into account, we proposed an approach that will assist us in minimizing this execution time by reducing the number of features. We anticipate that our findings may help to diagnose Parkinson’s disease early, increasing patients’ life expectancy.
However, in this study, we have employed a dataset that includes high-dimensional features from a speech-recording signal. Using this dataset, our main objective is to predict Parkinson’s disease utilizing four distinct feature selection strategies and various fine-tuned machine-learning classification techniques. We have adopted PCA, variance threshold, information gain, and Chi-square as the feature selection techniques. PCA is a feature selection technique that reduces the dimensionality of the data matrix and extracts significant features to improve classification performance. Variance thresholding is a simple feature selection algorithm that eliminates all low-variance features from unbalanced data for unsupervised learning. As the dataset contains categorical variables, we use information gain and Chi-square for feature selection to extract the features based on entropy and Chi-square scores. Information gain minimizes entropy by transforming a dataset. Also, we calculate the Chi-square value for each variable in terms of the target variable and select the features with the best Chi-square scores. In the classification stage, we observe the performance of the KNN classifier. Generally, KNN is used with Euclidean distance metric for classification problems. Mukherjee et al. observed the performance of KNN with various distance functions for iris image classification where they found that the Euclidean distance did not perform well compared to other distance functions [12, 13]. Therefore, we have tried to evaluate the performance of KNN with several distance metrics to obtain optimized performance.
The following parts reflect the remainder of the paper: related work is presented in Section II, and research methodology including data preprocessing, feature extraction techniques, classification models, classifier parameter settings, and accuracy measures- is presented in Section III. Experimental findings are described in section IV. Section V concludes with conclusions and future studies.
There have been many recent advancements in machine learning algorithms for the prediction of Parkinson’s disease. An overview of Parkinson’s disease prediction with relevant machine-learning techniques is reviewed in this section.
In 2013, Chen et al. [14] developed a fuzzy-based KNN model to improve its detection of Parkinson’s disease. Their investigation demonstrated that the approach with 10-fold cross-validation achieved the highest accuracy. They have only used PCA as a feature selection method; additional methods for feature selection might be employed for improved outcomes. In 2014, Sharma and Giri [15] developed three different classifiers for Parkinson’s disease diagnosis based on KNN, SVM, and multilayer perceptron (MLP). The SVM classification with radial basis function (RBF) provided better results in their work. For the classification, they utilized three classification models; however, a few more classifiers might be added to get more accurate results. In 2019, Sakar et al. [16] employed SVM with RBF, SVM (linear) logistic regression, KNN, and Naive Bayes to distinguish between Parkinson’s disease patients and healthy patients. They employed two SVM kernels in their investigation. Other kernels, such as the Gaussian, Polynomial, and Sigmoid kernels, might be added to improve performance.
On the dataset for voice classification of Parkinson’s disease patients, Khamparia et al. [17] employed a convolution neural network (CNN) classifier in 2019. For classification in their investigation, they constructed a custom neural network. However, several pre-trained CNN models, like GoogleNet, Resnet50, and VGG16, might be utilized to obtain more accurate results. Since they have previously been trained on a huge number of images. Gunduz [18] developed two CNN-based approaches for Parkinson's disease classification employing sets of acoustic voice data in the same year. F1-Score and Matthews Correlation Coefficient measures, together with accuracy, are employed in their study for evaluation. Precision, recall, and area under the curve (AUC) can also be incorporated to assess the performance and increase the reliability of the suggested technique. Wang et al. [19] used 12 machine learning models in a dataset of 401 speech biomarkers to classify individuals as having Parkinson’s disease or not in 2020. They created a specialized Deep learning model with higher classification accuracy. However, the model was costly since it needed a lot of memory.
Quantitative gait data and machine learning algorithms were used to distinguish between PD patients with and without Mild Cognitive Impairment (MCI) by Ricciardi et al in the same year [20]. They implemented three classifiers, but they could add more, and they could use different KNN distance functions that might help to improve the results. In 2020, Mei et al. [21] discussed the likelihood of machine learning techniques to differentiate Parkinson’s disease and non-Parkinson’s disease patients. The significance of Machine learning in identifying Parkinson’s disease as motor and non-motor symptoms that might be missed during a doctor’s subjective testing was also reviewed by Mei et al. [11] in the same year. In the reviewed studies, the authors have used a single feature selection method or they have used a few classifiers and no one has shown the performance evaluation for different distance functions of KNN. Considering that research gap, this paper aims to explore variance threshold, information gain, PCA, and Chi-square as feature selection techniques with some Machine learning classifiers to predict Parkinson’s disease.
In this section, data pre-processing, feature selection techniques, classification models, and performance evaluation are discussed as the research methodology for the study which is also depicted as the systematic flowchart in Figure 1.
3.1 Data pre-processing
To improve the efficiency of our dataset, we applied a variety of pre-processing approaches at this stage. There might be some missing numbers or outliers in our dataset. The mean of each variable is used to fill in the missing data, and outliers are eliminated using the z-score approach.
3.2 Feature selection techniques
After the normalization of the features, we utilize four distinct feature selection techniques to extract effective features from the dataset, including variance threshold, information gain, Chi-Square, and PCA (Principal component analysis). The next sub-subsections explain these feature selection strategies.
3.2.1 Variance threshold
The variance threshold is a feature selector that excludes all low-variance features from the dataset that aren’t particularly useful for modeling. It may be used for unsupervised learning since it only considers the features (x), not the intended outputs (y). The threshold’s default value is 0.
Remove constant features if Variance Threshold = 0.
Remove Quasi-Constant Features if Variance Threshold>0.
Figure 1. Systematic flowchart of the proposed methodology
3.2.2 Information gain
Information gain calculates the loss of entropy or surprise when a dataset is modified in any way. It is widely used to construct decision trees from training data by evaluating each variable’s information gain. It selects the one with the most information gain, the lowest entropy, and the best split of the dataset into classification groups. Information gain may also be used to choose features by contrasting the gains of each variable to the target variable. By utilizing a slightly different phraseology, the calculation is referred to as the mutual information between the two random variables.
3.2.3 PCA (Principal component analysis)
Using principal component analysis (PCA), the majority of the data from the bigger set is kept while a significant number of variables are condensed into a smaller set. Formally, PCA is a technique for decreasing the dimensionality of massive data sets. Reducing the number of variables automatically lowers the quality of data collection, but the goal of dimensionality reduction is to exchange some accuracy for simplicity.
3.2.4 Chi-square
The chi-square technique is used to assess categorical features in a dataset. The feature with the greatest Chi-square score is picked after analyzing the correlation between every feature and the desired result. The chi-square test in statistics is used to evaluate if two occurrences are independent. The Chi-Square formula is used to determine the difference between the predicted count E and the actual count O:
$\chi_c^2=\sum \frac{\left(K_i-P_i\right)^2}{P_i}$ (1)
where, c = Degree of freedom, K = Observed value(s) and P = Expected value(s).
3.3 Classification models
There are various machine learning classifiers for classification. However, we have adopted seven different classification techniques that are briefly discussed sequentially in this section. We have taken these classification models because each of the classification models has some benefits. SVM is more effective in high dimensional spaces and SVM is relatively memory efficient. The decision tree is another classifier we have used. It requires less code, analysis, and even dummy variables to model, hence they take less time. The Random Forest Algorithm prevents overfitting since the outcome is based on a majority vote or average and Naive Bayes doesn't require as much training data. When the dataset is small and the data points are close together, KNN performs well. XGBoost has been improved for speed as well as accuracy. Its great efficiency and ability to handle a wide range of data formats make it an excellent choice for firms seeking to swiftly extract insights from their data and AdaBoost is best used to boost the performance of decision trees on binary classification problems.
3.3.1 K-Nearest Neighbor (KNN)
K-Nearest Neighbors is one of the most basic supervised learning-based machine learning approaches. The KNN approach assigns the new instance to the category that is the most similar to the current categories. By assuming that the new instance and the prior cases are identical. The KNN algorithm collects all available information and organizes new input based on similarity. This suggests that by utilizing the KNN technique, new data may be consistently and quickly classified.
3.3.2 Support Vector Machine (SVM)
The support vector machine (SVM) is one of the most used techniques for supervised learning in machine learning. The SVM method seeks to construct the optimal line or decision boundary that can split n-dimensional space into classes to quickly categorize new data points in the future. This boundary of optimal choice is known as a hyperplane. To assist in creating the hyperplane, SVM selects the extreme vectors and points. Support vectors, which are used to represent these extreme circumstances, are the basis of the SVM approach.
3.3.3 Naive Bayes classifier
The Naive Bayes classifier algorithm is a supervised learning strategy for classification problems. It is mostly used for text classification and contains a large training set. It encourages the rapid advancement of machine learning models that can make accurate predictions. It projected the possibility that an object will occur as a probabilistic classifier.
3.3.4 Decision tree
A decision tree is a flowchart that starts with one fundamental idea and grows based on the outcomes of your actions. The model is characterized as a "decision tree" because it frequently resembles a tree with branches. In ML, a decision tree, a supervised learning technique, may tackle regression and classification problems. However, it is frequently employed when attempting to solve classification problems. It is a classifier with a tree-like internal structure in which nodes reflect dataset characteristics. A decision tree has two nodes: the Decision Node and the Leaf Node.
3.3.5 Random Forest
The well-known machine learning algorithm Random Forest is included in the supervised learning technique. It may be applied to ML problems that need both regression and classification. It is based on ensemble learning. It is a technique for merging several classifiers to tackle challenging problems and enhance model performance. A forest is composed of trees, and a forest with more trees is a more stable forest. Similarly, the Random Forest technique constructs decision trees from data samples, derives predictions from each, and then votes to determine which answer is the best. The expanding number of trees in the forest prevents overfitting.
3.3.6 XGBoost
The supervised machine learning technique known as XGBoost is used by the Train Using AutoML application for classification and regression. XGBoost is a shortened name for extreme gradient boosting. The decision tree-based technique outperforms methods like gradient boost and Random Forest.
It is efficient for large and complicated datasets because of a variety of optimization strategies. Large dataset performance, usability, and speed are all goals of XGBoost’s design.
3.3.7 AdaBoost
Adaboost is the name of a supervised machine-learning algorithm. Both problem statements involving classification and regression may be handled by this technique. It fits under the boosting ensemble method category. This method builds a model by giving each piece of data an equal weight. The points with inaccurate classifications are thus given additional weight by it. In the new model, all points with higher weights are given more weight. If a lower error is not achieved, it will continue to train models.
3.4 Performance evaluation
For the evaluation of the classification models, we have considered accuracy, precision, recall, F1-score, and area under the curve (AUC) as the performance criteria which are explained briefly in this subsection.
3.4.1 Accuracy measure
A crucial factor for assessing classification models is accuracy. It is calculated by dividing the number of correct guesses by the total number of predictions. Formally, accuracy is measured by the following mathematical formula:
$Accuracy =\frac{T P+T N}{T P+T N+F N+F P}$ (2)
In this formula, TP stands for “True Positive”, TN for “True Negative”, FP for “False Positive”, and FN for “False Negative”.
3.4.2 Precision
Precision is the percentage of data samples from the positive class that a machine learning model correctly detects out of all the samples that are predicted to fall into that class.
$precision =\frac{T P}{T P+F P}$ (3)
Making one single positive prediction and ensuring it is right is a trial technique to get ideal accuracy. However, this would be ineffective since the classifier would discard all except one good occurrence. Therefore, precision is frequently combined with another statistic called recall, also known as sensitivity or the true positive rate (TPR).
3.4.3 Recall
The true positive rate (TPR), also known as recall, is the proportion of data samples correctly identified by a machine learning model as belonging to a class of interest- the “positive class” out of the total samples for that class.
$recall =\frac{T P}{T P+F N}$ (4)
3.4.4 F1 score
Precision and Recall are combined into a single number in the F1 score measure. The F1 score is the harmonic mean of recall and accuracy. A high F1 score for a classifier requires both good precision and recall. The formula for measuring the F1 score is given below:
$F1\,\,score =\frac{2 \,* \text { precision } * \text { recall }}{\text { precision }+ \text { recall }}$ (5)
3.4.5 Area Under the Curve (AUC)
The area under the ROC curve is known as the AUC. It computes the whole area under the two-dimensional ROC curve. The AUC is the probability that the model assesses a randomly picked positive example higher than a randomly selected negative example.
The dataset for our investigation is made up of signal features from Parkinson’s disease patients’ voice recordings. The data were from the UCI Machine Learning Respiratory [22]. The Department of Neurology at Istanbul University’s Cerrahpaa Faculty of Medicine collected data from 188 individuals with Parkinson’s disease (107 men and 81 women) ranging in age from 33 to 87. The control group included 64 healthy people ranging in age from 41 to 82, including 23 men and 41 women. The dataset has 755 variables and 756 distinct observations. A binary factor class variable is our goal variable.
Table 1. Parameter settings for tuning
|
Classifiers |
Finetuning Parameters |
|
SVM |
C = 0.1, 1, 10 Kernel = linear, RBF, poly Gamma = scale, auto |
|
RF |
n_estimators = 100, 200, 300 criterion = gini, entropy max_depth = None, 5, 10 |
|
KNN |
n_neighbors = 3, 5, 7 weights = uniform, distance; p = 1, 2 metric = [‘Euclidean’] |
|
GNB |
Priors = None, [0.1, 0.9], [0.3, 0.7], [0.5, 0.5], [0.7, 0.3], [0.9, 0.1] |
|
DT |
Criterion = gini, entropy max_depth = None, 5, 10 |
|
XGBoost |
learning_rate = 0.1, 0.01 max_depth = 3, 5, 7 n_estimators = 100, 200, 300 |
|
AdaBoost |
n_estimators = 50, 100, 200 learning_rate = 0.1, 1, 10 |
The study is to predict the target variable within two categories:
0: The persons who don’t have Parkinson’s disease are assigned as 0.
1: The persons who are affected by Parkinson’s disease are assigned as 1.
For analysis, four distinct feature selection methods were used for our dataset, and seven machine learning classifiers were integrated with these feature selection methods. We have taken different parameters for different classifiers to achieve the best performance metric. The parameters are given in Table 1.
The accuracy of various feature selection methods and classifier combinations is shown in Table 2. According to Table 2, the variance threshold feature selection approach has the highest accuracy when paired with SVM (91.43%), while the information gain method has the best accuracy when combined with XGBoost (90.13%). Once more, the Chi-square approach yields 86.18% accuracy with SVM and 91.44% accuracy is obtained by KNN with the PCA feature selection method. The PCA and KNN combination has the greatest accuracy in comparison to other feature selection methods and classifier combinations. We have found the precision, recall, AUC, and F1 scores for each feature extractor and classifier.
Table 2. Accuracy of classifiers with four different feature selection methods
|
Classifiers |
Accuracy |
|||
|
Feature Selection Method |
||||
|
Variance Threshold |
Information Gain |
Chi-square |
PCA |
|
|
Support Vector Machine (SVM) |
0.9143 |
0.8618 |
0.8618 |
0.9210 |
|
Random Forest (RF) |
0.8618 |
0.8684 |
0.875 |
0.875 |
|
K-Nearest Neighbor (KNN) |
0.8684 |
0.8421 |
0.8223 |
0.9144 |
|
Gaussian Nave Bayes (GNB) |
0.7894 |
0.6776 |
0.8289 |
0.8092 |
|
Decision Tree (DT) |
0.7631 |
0.8157 |
0.7960 |
0.7894 |
|
XGBoost |
0.8618 |
0.9013 |
0.8289 |
0.8815 |
|
AdaBoost |
0.8092 |
0.8289 |
0.8421 |
0.8486 |
Variance threshold feature selection with various classifications-based precision, recall, F1 score, and AUC values are depicted in Figure 2.
Figure 2 illustrates the values of precision, recall, F1 score, and AUC for seven different classifiers with the variance threshold feature selection method. The variance threshold method obtained the highest precision (92.43%), F1 measure (94.42%), and AUC (85.4%) with the classifiers SVM and RF and the highest recall (97.36%) with RF.
By using the variance threshold method, we found the average precision, recall, F1 score, and AUC of seven classifiers. The average precision is obtained at 87.42%, the average recall is 91.72%, the average F1 score is 89.41%, and the average AUC is obtained at 75.93%.
The information gain feature selection approach produced the greatest precision (91.59%) and maximum F1 measure (96.49%) with the classifier XGBoost. The highest recall (95.61%) is obtained with XGBoost and SVM, and the highest AUC (93.56%) is obtained with XGBoost (84.64%), according to Figure 3. The average F1 score is 88.48%, the average recall is 89.47%, the average AUC is 76.12%, and the average precision is 87.73% on average.
Figure 2. Precision, recall, F1-measure, and AUC for different classifiers with variance threshold feature selection method
Figure 3. Precision, recall, F1 score, and AUC for different classifiers with information gain feature selection method
Figure 4. Precision, recall, F1 score, and AUC for different classifiers with Chi-square feature selection method
The precision, recall, F1 measure, and AUC values for the combinations of different classifiers and Chi-square feature selection are presented in Figure 4. The chi-square method obtained the best precision (87.67%) and AUC (87.13%) with GNB and the best recall (97.36%) and F1 measure (77.63%) with RF. The average precision, recall, F1 score, and AUC of seven different classifiers are 85.72%, 93.85%, 89.58%, and 73.42% respectively.
Figure 5 illustrates the precision, recall, F1 score, and AUC values for the combinations of the PCA feature selection method and classifiers. The best precision (93.22%) and AUC (87.71%) are achieved by SVM. The best recall (96.49%) is obtained from RF and the highest F1 measure (95.31%) is found by KNN. The average precision, recall, F1 score, and AUC of seven different classifiers are 87.95%, 94.73%, 91.19%, and 77.81% respectively.
Figure 5. Precision, recall, F1score, and AUC for different classifiers with PCA feature selection method
We can observe from Figure 6 that the KNN has 92.43% precision for the Euclidean distance function which is the highest precision among all distance functions. For both Correlation distance and Euclidean distance function KNN achieved 96.49% recall. KNN achieves a 94.82% F1 score for the correlation distance function and AUC 87.71 is obtained by correlation distance.
Since KNN obtained the most accurate result, we are curious to see how KNN performs for various distance functions while utilizing the PCA feature selection approach. The classification accuracies for various distance functions with PCA features are shown in Table 3.
Figure 6. Precision, recall, F1score, and AUC for different distance functions of KNN with PCA
Table 3 demonstrates that the KNN achieved the maximum accuracy for the correlation distance, which is 92.10%. It also achieved positive outcomes for other distance functions. For the Euclidean distance function, Cosine distance, Manhattan distance, and Minkowski distance, KNN obtained 91.44%, 90.78%, 88.81%, and 88.81% accuracy respectively.
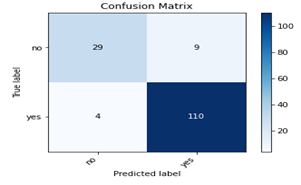
We have also analyzed the results using a confusion matrix. Figure 7 depicts the confusion matrix which is made by the combination of PCA (Correlation distance will be placed after KNN) providing a better result. It is provided TP=110 which indicates 110 observations are predicted positively and are positive; TN=29 indicates that 29 observations are predicted negatively and are truly negative. FP=9 signifies that 9 observations are predicted positive but are negative, while FN=4 suggests that 4 observations are projected negative but are positive, which means, the total number of wrong predictions is 13.
Table 3. Accuracy of KNN for different distance functions by using PCA features
|
Distance Function |
Accuracy |
|
Euclidean Distance |
0.9144 |
|
Manhattan Distance |
0.8881 |
|
Chebyshev Distance |
0.7828 |
|
Minkowski Distance |
0.8881 |
|
Cosine Distance |
0.9078 |
|
Hamming Distance |
0.7302 |
|
Correlation Distance |
0.9210 |
Figure 7. Confusion matrix of KNN (Correlation distance) with PCA
The AUC values between 0.7 and 0.8 are seen to be good, values between 0.8 and 0.9 are thought to be exceptional, and values beyond 0.9 are thought to be noteworthy [23]. The AUC of 0.5 frequently implies no distinction. From Figure 8, it can be observed the value of AUC is 0.88 for the proposed PCA features selection-based classification approach. It can also be reported that the proposed method provides a significant result.
Figure 8. ROC curve for best combination PCA (Correlation distance) with KNN
The proposed approach is compared with other state-of-the-art methods which are presented in tabular form as Table 4. Table 4 shows the comparison of our proposed method with previous work. We have obtained 92.10% by using KNN (correlation distance) with the PCA feature selection method. Avuçlu and Elen [24], Sheibani et al. [25], and Grover et al. [26] obtained the highest accuracy 70.20%, 90.60%, and 81.66% respectively. By comparing the proposed method with the previous studies, we can say that our result is satisfactory.
Table 4. Comparison with state-of-the-art methods
|
Authors |
Algorithms |
Accuracy (%) |
|
Avuçlu and Elen [24] |
Naive Bayes |
70.26 |
|
Sheibani et al. [25] |
Ensemble learning |
90.60 |
|
Grover et al. [26] |
Customized Deep neural network |
81.66 |
|
Proposed work |
KNN (Correlation distance) with PCA |
92.10 |
The burden associated with Parkinson’s disease has more than doubled over the last generation and it is currently one of the fastest-developing neurological illnesses globally. There are now 4% of sufferers globally who are under 50 years old; the likelihood of having this condition increases with age. With millions of victims, of Alzheimer’s disease, it is the world’s second most prevalent neurodegenerative disorder. Since this is most likely to be a dangerous disease, earlier detection is required. In this work, we have proposed a strategy for predicting Parkinson’s disease, which may help in detecting the condition early. Professionals may benefit from the proposed methods for early detection. The proposed technique will aid in the accurate detection of Parkinson’s disease.
We have used four distinct feature selection techniques to go through a huge number of features and identify the most important features. The disease is then predicted using seven different classifiers, and the PCA feature selection approach and KNN (correlation distance) classifier combination had the highest accuracy score (92.10%). When the dataset is small and the data points are close together, KNN performs well. Since our dataset is small, KNN (correlation distance) performs well when features are fed from the PCA feature selection method.
A few more feature selection techniques and classifier combinations provide significant results; these combinations have an accuracy score of 91.44% for variance threshold and SVM, 90.13% for information gain and XGB, and 86.18% for chi-square and SVM. In addition, a few deep learning models are becoming more and more well-liked due to their effectiveness and efficiency in classification modeling.
The Gini index favors larger partitions and is easy to implement. Gini Impurity is better for selecting the best features. Besides the Gini index, sequential feature selection is another feature selection technique. The key benefit of forward sequential feature selection is that it is a simple and rapid way of improving the algorithm’s performance. The algorithm adds one feature at a time, starting with the feature that improves the model’s performance the most. In the future, we may employ more effective feature selection techniques such as the Gini index, and sequential forward selection (SFS) approaches. We anticipate using these methods in our future work to improve results.
The authors acknowledge Kaggle for the contribution of the database employed in this work.
[1] Parkinson disease. World Health Organization. https://www.who.int/news-room/fact-sheets/detail/parkinson-disease.
[2] Tysnes, O.B., Storstein, A. (2017). Epidemiology of Parkinson’s disease, Journal of Neural Transmission, 124: 901-905. https://doi.org/10.1007/s00702-017-1686-y
[3] Cerri, S., Mus, L., Blandini, F. (2019). Parkinson’s disease in women and men: What’s the difference? Journal of Parkinson's Disease, 9(3): 501-515. https://doi.org/10.3233/JPD-191683
[4] Dorsey, E.R., Sherer, T., Okun, M.S., Bloem, B.R. (2018). The emerging evidence of the Parkinson pandemic. Journal of Parkinson's Disease, 8(s1): S3-S8. https://doi.org/10.3233/JPD-181474
[5] Dorsey, E.R., Bloem, B.R. (2018). The Parkinson pandemic—A call to action. JAMA Neurology, 75(1): 9-10. https://doi.org/10.1001/jamaneurol.2017.3299
[6] Singh, N., Pillay, V., Choonara, Y.E. (2007). Advances in the treatment of Parkinson's disease. Progress in Neurobiology, 81(1): 29-44. https://doi.org/10.1016/j.pneurobio.2006.11.009
[7] Little, M., McSharry, P., Hunter, E., Spielman, J., Ramig, L. (2008). Suitability of dysphonia measurements for telemonitoring of Parkinson’s disease. Nature Precedings. https://doi.org/10.1038/npre.2008.2298.1
[8] National Institute for Clinical Excellence (NICE). (2008). National Collaborating Centre for Chronic Conditions. In Type 2 diabetes: National clinical guideline for management in primary and secondary care (update). Royal College of Physicians Londres.
[9] Cherubini, A., Morelli, M., Nisticó, R., Salsone, M., Arabia, G., Vasta, R., Caligiuri, M.E., Quattrone, A. (2014). Magnetic resonance support vector machine discriminates between Parkinson disease and progressive supranuclear palsy. Movement Disorders, 29(2): 266-269. https://doi.org/10.1002/mds.25737
[10] Wang, Z.X., Zhu, X.F., Adeli, E., Zhu, Y.Y., Nie, F.P., Munsell, B., Wu, G.R. (2017). Multi-modal classification of neurodegenerative disease by progressive graph-based transductive learning. Medical Image Analysis, 39: 218-230. https://doi.org/10.1016/j.media.2017.05.003
[11] Mei, J., Desrosiers, C., Frasnelli, J. (2021). Machine learning for the diagnosis of Parkinson's disease: A review of literature. Frontiers in Aging Neuroscience, 13: 633752. https://doi.org/10.3389/fnagi.2021.633752
[12] Mukherjee, A., Islam, M.Z., Mamun-Al-Imran, G.M., Ali, L.E. (2021). Iris recognition using wavelet features and various distance based classification. In 2021 international conference on electronics, communications and information technology (ICECIT). pp. 1-4. https://doi.org/10.1109/ICECIT54077.2021.9641118
[13] Mukherjee, A., Ripon, K.S.N., Ali, L.E., Zahidul Islam, M., Mamun-Al-Imran, G.M. (2022). Image gradient based iris recognition for distantly acquired face images using distance classifiers. In International Conference on Computational Science and Its Applications. pp. 239-252. Springer, Cham. https://doi.org/10.1007/978-3-031-10548-7_18
[14] Chen, H.L., Huang, C.C., Yu, X.G., Xu, X., Sun, X., Wang, G., Wang, S.J. (2013). An efficient diagnosis system for detection of Parkinson’s disease using fuzzy k-nearest neighbor approach. Expert Systems with Applications, 40(1): 263-271. https://doi.org/10.1016/j.eswa.2012.07.014
[15] Sharma, A., Giri, R.N. (2014). Automatic recognition of Parkinson’s disease via artificial neural network and support vector machine. International Journal of Innovative Technology and Exploring Engineering (IJITEE), 4(3): 2278-3075.
[16] Sakar, C.O., Serbes, G., Gunduz, A., Tunc, H.C., Nizam, H., Sakar, B.E., Tutuncu, B., Aydin, T., Isenkul, M.E., Apaydin, H. (2019). A comparative analysis of speech signal processing algorithms for Parkinson’s disease classification and the use of the tunable Q-factor wavelet transform. Applied Soft Computing, 74: 255-263. https://doi.org/10.1016/j.asoc.2018.10.022
[17] Khamparia, A., Gupta, D., Nguyen, N.G., Khanna, A., Pandey, B., Tiwari, P. (2019). Sound classification using convolutional neural network and tensor deep stacking network. IEEE Access, 7: 7717-7727. https://doi.org/10.1109/ACCESS.2018.2888882
[18] Gunduz, H. (2019). Deep learning-based Parkinson’s disease classification using vocal feature sets. IEEE Access, 7: 115540-115551. https://doi.org/10.1109/ACCESS.2019.2936564
[19] Wang, W., Lee, J., Harrou, F., Sun, Y. (2020). Early detection of Parkinson’s disease using deep learning and machine learning. IEEE Access, 8: 147635-147646. https://doi.org/10.1109/access.2020.3016062
[20] Ricciardi, C., Amboni, M., De Santis, C., Ricciardelli, G., Improta, G., D’Addio, G., Cuoco, S., Picillo, M., Barone, P., Cesarelli, M. (2020). Machine learning can detect the presence of Mild cognitive impairment in patients affected by Parkinson’s disease. In 2020 IEEE International Symposium on Medical Measurements and Applications (MeMeA). pp. 1-6. https://doi.org/10.1109/MeMeA49120.2020.9137301
[21] Mei, J., Tremblay, C., Stikov, N., Desrosiers, C., Frasnelli, J. (2021). Differentiation of Parkinson’s disease and non-Parkinsonian olfactory dysfunction with structural MRI data. Proc. SPIE 11597, Medical Imaging 2021: Computer-Aided Diagnosis, 115971E. https://doi.org/10.1117/12.2581233
[22] Biswas, D. (2019). Parkinson’s Disease (PD) classification. Kaggle. https://www.kaggle.com/datasets/dipayanbiswas/parkinsons-disease-speech-signal-features.
[23] Trifonova, O.P., Lokhov, P.G., Archakov, A.I. (2014). Metabolic profiling of human blood. Biomeditsinskaya Khimiya, 60(3): 281-294. https://doi.org/10.18097/pbmc20146003281
[24] Avuçlu, E., Elen, A. (2020). Evaluation of train and test performance of machine learning algorithms and Parkinson diagnosis with statistical measurements. Medical & Biological Engineering & Computing, 58: 2775-2788. https://doi.org/10.1007/s11517-020-02260-3
[25] Sheibani, R., Nikookar, E., Alavi, S.E. (2019). An ensemble method for diagnosis of Parkinson's disease based on voice measurements. Journal of Medical Signals and Sensors, 9(4): 221-226. https://doi.org/10.4103%2Fjmss.JMSS_57_18
[26] Grover, S., Bhartia, S., Akshama, Yadav, A., Seeja, K.R. (2018). Predicting severity of Parkinson’s disease using deep learning. Procedia Computer Science, 132: 1788-1794. https://doi.org/10.1016/j.procs.2018.05.154