Muhammad Shoaib Akhtar | Tao Feng*
© 2022 IIETA. This article is published by IIETA and is licensed under the CC BY 4.0 license (http://creativecommons.org/licenses/by/4.0/).
OPEN ACCESS
A scalable indoor localization technique is a vital technology for future large-scale location-aware services covering a complex of multi-story buildings. Our research on the usage of ResNet for scalable building/floor categorization and floor-level position estimation based on Wi-Fi fingerprinting is presented in this publication. Building and floor-level coordinates are estimated using our new ResNet architecture, which utilizes a stacked autoencoder to reduce feature space and a feed-forward classifier to classify multiple labels of building/floor/location. This architecture is the foundation for our multi-building and multi-floor indoor localization system based on Wi-Fi fingerprinting. On the Jaume I University (UJI) campus in Spain, we test the accuracy of building/floor estimation and floor-level coordinates estimation for three buildings with four or five stories each. ResNet-based indoor localization using a single ResNet has been proven to be feasible, with results that are close to the state of the art. One ResNet is all that is needed in order for the proposed indoor localization system based on Wi-Fi fingerprinting to function at levels close to the current state of the art, allowing it to be implemented with less complexity and less energy consumption on mobile devices.
ResNet, deep learning, transfer learning
The goal of this study was to see if indoor positioning could be accomplished with Wi-Fi fingerprinting. The UJIIndoorLoc indoor location benchmark retrieved from the University of California Irvine (UCI) Machine Learning Repository was used to train, tune, and optimize a random forest, k-nearest neighbor, and artificial neural network [1]. In order to handle multi-label data, a machine learning pipeline was followed, and a rational technique was employed to combine the numerous labels into a single categorical variable. Research conducted by Koike-Akino et al. [2] yielded similar, if not superior. Results from the 2015 EvAAL-ETRI indoor locationing competition were comparable to those of the research teams who participated in the competition. In Kim et al. [3], they also describe their systems for the competition.
Using satellite signals and triangulating user locations, global positioning systems (GPS) have long been able to solve the outside positioning problem, allowing even vehicles travelling at high speeds to be navigated with pinpoint accuracy [4]. Numerous concrete and other building materials absorb GPS signals to the point where GPS is rendered useless in many major indoor, multi-storey complexes, such as shopping malls, university buildings, public libraries and airports [5]. Many smartphone applications could benefit greatly from knowing their users' specific position in context-aware systems in today's current day where cellphones are ubiquitous. The precise indoor position of these applications necessitates a solution [6].
There has been a lot of effort put into finding a solution to this issue. The current state of affairs is that no single remedy has been widely adopted as of the middle of 2018. A wide range of signal types (RFID, Bluetooth, Wi-Fi) and algorithms are used in the proposed solutions [7]. Due to the prevalence of various wireless access points (WAPs) in modern buildings and the widespread use of smartphones, Wi-Fi signals are an excellent option [8]. Modern approaches to this problem are frequently complex, comprising numerous data processing options and novel algorithms with numerous phases [9]. We'll use simple models to show that Wi-Fi signals can be used, but they'll still be accurate enough. A Scalable ResNet model designed for indoor location performance with low validation loss and the greatest validation accuracy at adaptive moments has been developed to achieve this goal. In addition, stochastic gradient and root mean square propagation have achieved high levels of precision. "Locationing" and "positioning" are used interchangeably in this article.
There have been a number of models of deep learning previously discussed. At the end of this part, we'll look at several current state of the art models and make some comparisons. While location-based services are popular in the outdoors, they are also becoming more popular in the indoors, according to Árvai [10]. In order to get a precise indoor location, you can use a digital interior map as a reference and track the movement of people walking, turning, or using stairs.
It's a framework for indoor localization and semantic mapping that Wei and Akinci [8] have developed. Using an image-based indoor localization and semantic mapping system has the following advantages. It only requires a picture as an input to provide localization, semantic interpretation, and association. The feature-extraction network is used for both localization and semantic understanding. Component-level associations with 6-DoF poses and semantic labels are supported.
An indoor localization framework based on Convolutional neural networks is presented by Zhao et al. [11]. Wi-Fi signals are represented as fingerprint images using Channel State Information (CSI) from the MIMO-OFDM PHY layer. Other algorithms for indoor location are presented, including a convolutional neural network and a Bayes adaptive Kalman filter. According to simulation data, our proposed strategy improves location accuracy by 51.8 percent over current methods. An improvement of up to 22% and an improvement of 9.8% in a real-world indoor environment are achieved by our strategy in the LoS scenario.
There is an extensive database of indoor location and trajectory estimates using CNN provided by Zhong et al. [12]. Researchers at the Xian Jiatong-Liverpool University in Suzhou, China, have developed a new location fingerprinting database based on measurements of Wi-Fi received signal strength and geomagnetic field intensity in a multi-story structure. It also includes preliminary findings about location and trajectory prediction utilising convolutional networks (CNN) and long-term memory (LSTM) (LSTM). To perform localization, they translate RSS data into an image-like array and use CNN, which is widely used in image and video analysis, to do so.
Adaptive deep-learning for quick indoor location is provided by Tiku et al. [13]. In this article, they explain how to reduce the computational requirements of a deep learning-based indoor location system while maintaining accuracy goals. Comparing their proposed method to the most well-known baseline deep learning-based indoor localization model, it has been shown to reduce prediction latency by 42 percent and prediction energy by 45 percent when implemented and confirmed across many phones.
These methods are based on Convolutional neural networks provided by Mittal et al. [14]. Convolutional Neural Networks can be used to develop a scalable fingerprinting framework by transforming Wi-Fi signatures into images (CNNs). Our proposed CNN-LOC indoor localization framework (CNN-LOC) has been tested in different inside situations with an average localization error of less than 2 metres. This new study outperforms the most well-known predecessors in the field.
Using deep learning, Tiku and Pasricha [5] have developed an indoor location framework. However, they propose a new approach to preventing indoor localization from becoming inaccurate in the face of AP attacks. With the suggested S-CNNLOC architecture, malicious AP attacks are up to 10 times more resistant than with the unencrypted version of the neural network.
Using a convolutional neural network, Song et al. [9] present a new indoor localization system. This system's performance is evaluated on the UJIIndoorLoc and Tampere datasets by comparing it to existing methods. A new Wi-Fi fingerprinting dataset, UTSIndoorLoc, is used to test the CNNLoc placement model. CNNLoc outperforms prior building- and floor-level localization systems, with 100% and 95% success rates, respectively.
Using convolutional neural networks, Bregar and Mohorčič [4] provide an indoor location. NLoS channel classification and range error regression models, both implemented in the Tensor Flow computational framework and using convolutional neural networks, form the basis of the method (CNNs). A number of computing platforms are used to evaluate how well the proposed CNN-based algorithms perform. They further demonstrate that the suggested CNN-based algorithms may be used in a distributed localization system even on computationally restricted devices by evaluating their computational performance and appropriateness on various computer systems.
There is combined activity recognition and indoor localisation provided by Wang et al. [15]. They propose a dual-task convolutional neural network with 1-dimensional convolutional layers for the dual task of activity recognition and indoor location. Experimentation and ablation analysis findings show that our strategy works effectively in this typical Wi-Fi sensing difficulty (see below).
Convolutional neural networks for indoor Wi-Fi fingerprinting are provided by Chen et al. [16]. When they examined the CNN and DNN, they discovered that each model could automatically distinguish location-specific patterns by quantifying and displaying CNN (or multilayer perceptron). According to standard quantitative criteria, they measure how each model's performance is affected by the inclusion or exclusion of relevant or non-related information.
There is an Indoor Localization method developed by Akino et al. using deep learning. There was a 99 percent classification accuracy, an average mean square error of 11.1 centimetres, and an average median error of 9.5 centimetres for the direct, coordinate estimation method. These intermediate channel readings are used in a deep learning technique for a number of different purposes, including 1) location-only classification, 2) simultaneous location and orientation classification, and 3) direct coordinate estimation.
Using recurrent neural networks, Jang et al. [17] give an indoor location. A geomagnetic field map is created on their campus testbed and a million walking patterns are generated. Our BLErfingerprinting results show an average location inaccuracy of 3.14 metres, compared to 1.062 metres with an RNN. For the first time, fingerprints can be used to follow a person's whereabouts in real time, something was previously impossible to do with RF fingerprinting. Only 5% of the traces are used for localization evaluation; the rest are used for training.
Instead of using the raw RSS feed, Lin et al. [18] advocate employing the more detailed regional features. To deal with inconsistencies in similarity and to better place users, they proposed a three-component deep learning network consisting of a one-dimensional convolutional neural network, a Siamese architecture, and a regression network for locating users. Their experiments reveal promising results when compared to current approaches.
With a success rate of 59.5 percent and an accuracy of 1-5 metres, the object-based indoor localization algorithm proposed by Li et al. [7] successfully recognised 81.7 per cent of the items in the photographs. To assess the method's accuracy, an additional set of 42 images were taken in places that were previously identified. To train the R-CNN and template matching, 600 photographs were shot around the test environment and tagged with specific elements.
Deep Neural Network (DNN) architectures based on FPGA implementation and fingerprint-based indoor location are provided by Liu et al. [19]. (named "SDNNLoc"). The fingerprint database features are extracted using a scalable stacked denoising auto-encoder for durability and accuracy. DNN accelerator generation and optimising frameworks for FPGA implementation are then proposed. They also demonstrate a crowd-sensing university campus Wi-Fi fingerprinting technology. Using the proposed DNN architecture, efficient and precise indoor location is attainable, according to the experimental results.
In the first stage, Chen et al. [20] used a convolutional neural network (CNN) to extract the environment's inherent features for indoor identification. In the second stage, a second CNN uses information from the surrounding inside environment to accomplish interior localization. CNN has been found to be a critical component in aiding the real-time deployment of efficient low power IoT sensor networks in this paper's conclusions.
Indoor localization system developed by Abbas et al. [1] achieves fine-grained and dependable accuracy even in noisy surroundings thanks to deep learning. WiDeep can achieve mean localization accuracy of 2.64m and 1.21m for large and minor testbeds, respectively. This accuracy outperforms current methods in every test circumstance.
New convolutional neural networks were developed by Zhou et al. [21] to automatically learn the correct features. This technology can detect nine different types of behaviour with 98 percent accuracy in little over two seconds, including standing motionless, walking up or down the escalator or elevator, turning, or going upward. With the use of accelerometers and magnetometers, barometers, and gyroscope data collected from various smartphone models, they built an extensive database of pedestrian activity.
A convolutional neural network is used by Zhang et al. [22] to offer indoor wireless localisation. Received signal strength indication (RSSI)-based localization models beat k-nearest neighbour (KNN) models 61.8 percent. The GPR approach improves localization accuracy even more than the CNN model, which boosts performance by 45.8 percent.
Table 1. Comparative analysis of convolutional neural network
|
Reference |
Dataset |
Techniques |
Accuracy |
|
Árvai, 2021 |
The data collection was done using a mobile phone as a collection device, and several volunteers participated in the procedure. |
Convolutional neural network (CNN) |
75.3 to 91% Indifferent positions |
|
Wei & Akinci, 2019 |
They used a publically available dataset |
Image-based method |
90% |
|
Zhao et al., 2019 |
ImageNet Dataset |
Channel State Information (CSI) |
51.8% more efficient than previous work |
|
Zhong et al., 2018 |
The database covers the lobby on the 5th floor and the corridor On the 4th floor of the hotel. |
convolutional neural network (CNN) long short-term memory (LSTM) |
95% |
|
Tiku et al., 2021 |
The dataset covers four buildings. |
Support Vector Machines (SVMs) deep neural networks (DNNs) |
85% to 95% |
|
Mittal et al., 2018 |
Training dataset |
received signal strength indication (RSSI) Convolutional Neural Networks (CNNs) |
99.67% |
|
Tiku & Pasricha, 2019 |
The used dataset was used in the training phase of the CNN. |
secured neural network framework (S-CNNLOC) |
90% |
|
Song et al., 2019 |
UJIIndoorLoc dataset and Tampere dataset |
Stacked Auto-Encoder (SAE) CNNLoc |
95% to 100% |
|
Bregar & Mohorcic, 2018 |
dataset with 1394 samples |
Channel State Information (CSI) |
88.13% |
|
F. Wang et al., 2019 |
DNN learning over wireless datasets |
convolutional neural network (CNN) channel state information (CSI |
92% |
|
K. M. Chen et al., 2019 |
Dataset of a regular office |
spatial beam signal-to-noise ratios (SNRs) |
100% |
|
Koike-Akino et al., 2020 |
(iterations over entire dataset), |
recurrent neural network (RNN) |
96% |
|
Jang et al., 2017 |
|
|
|
|
Lin et al., 2019 |
Training dataset |
Convolutional Neural Network (CNN) |
90% |
|
Chenning et al., 2018 |
Publically available data set |
Region-based Convolution Neural Network (R-CNN) |
81.7% |
|
Kim et al., 2018 |
UJIIndoorLoc dataset |
Deep Neural Network (DNN) |
89% |
|
C. Liu et al., 2020 |
RSS dataset |
Deep Neural Network (DNN) |
87% |
|
Z. Chen et al., 2020 |
dataset obtained from radio-frequency (RF) measurements |
convolutional neural network (CNN) |
97.8% |
|
Abbas et al., 2019 |
Publically available data set |
WiDeep |
90% |
|
Zhou et al., 2019 |
Ten participants were invited to collect the data of nine activities |
convolutional neural network (CNN) |
98% |
|
Zhang et al., 2019) |
Training dataset and five groups of test datasets. |
k-nearest neighbor (KNN) |
45.8% better than previous studies |
|
Njima et al., 2019 |
Multiple datasets |
Received Signal Strength Indicator (RSSI) |
89 to 98% |
|
Z. Liu et al., 2019 |
UJIIndoorLoc dataset and Tampere dataset |
Support Vector Machines (SVMs) K-Nearest Neighbor (KNN) |
80 to 84% |
|
Ashraf et al., 2020 |
publicly available magnetic dataset of Sony Xperia M2 |
Neural Networks (NNs) |
95% |
|
X. Wang et al., 2020 |
We used a CSI dataset of 5Hz |
channel state information (CSI), convolutional neural networks (DCNN) |
85% |
To mimic three-dimensional radio images, Njima et al. [23] propose a fingerprint of the received signal strength indicator (RSSI). Results from simulations show that the parameters, optimization methodologies, and model designs that were used in this study were correct. When it comes to the trade-off between accuracy and computer complexity, their proposed solution outperforms popular approaches.
The Ratio fingerprint and RSSI are merged into the HW-fingerprint developed by Liu et al. [24] to enhance the expression of the interior environment. KNN, SVM, and CNN increased their average daily location accuracy by 3.39 percent, 8.03 percent, and 9.03 percent, respectively. SVM and KNN, on the other hand, were beaten by the deep-learning algorithm by 4.19 percent and 16.37 percent in terms of average day location accuracy.
A deep neural network is utilized by Ashraf et al. [25] to accomplish indoor localisation. At half of the four unmistakable gadgets, the proposed approach can accomplish a limitation precision of 2.64 m. LG G6, LG G7, and Galaxy A8 each had a mean error of 2.23 m; for the Galaxy S8, the LG G6, and the LG G7. There is a mean blunder of 2.84 m, a standard deviation of 2.24m, and a half mistake pace of 2.33 m while utilizing the proposed strategy utilizing openly accessible attractive information from the Sony Xperia M2. Beside this, the effect of gadgets on different perspectives about area precision is inspected. There is a deep convolutional neural network for indoor location provided by Wang et al. [6]. For indoor localisation, they suggest using CiFi, DCNN, and commodity 5 GHz Wi-Fi, as well as deep convolutional neural networks (DCNN). A business 5GHz Wi-Fi framework is utilized to make the CiFi framework, which is then scrutinized in two delegates inside settings. A changed gadget driver is utilized to separate stage information from channel state data (CSI), which is then used to compute the point of appearance (AoA).
In this section, we will discuss the dataset and proposed work in detail. The UJIIndoorLoc dataset is a set of indoor positioning data points collected at the Universidad Jaume I using over 25 Android devices varying in model and OS versions. Each example consists of a Wi-Fi "fingerprint" – a set of signal strengths received by the given device from 520 different WAPs at the device's location. The signal strengths are in RSSI format, in units of decibel-mill watts (dBm), and take on integer values ranging from -104 (weak) to 0 (strong), with a value of 100 representing no signal detected.
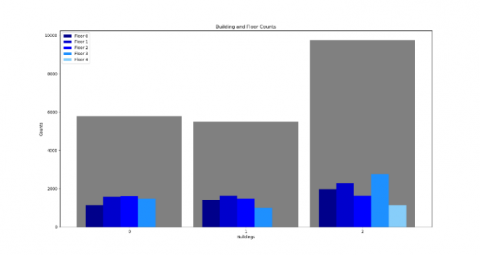
The dataset covers roughly 1.2 million ft2 across three buildings, numbered 0, 1, and 2. Buildings 0 and 1 each contain three floors, numbered 0, 1, and 2. Building 2 contains five floors, numbered 0 through 4. Several variables represent the location in each example: longitude, latitude, floor number, building number, space id (office, lab, etc.), and relative position (inside or outside the space's entrance door). In addition, the dataset contains metadata for each example – the user id, phone id, and a UNIX timestamp for when the example was recorded.
The dataset comes in two CSV files: "UJIIndoorLoc_trainingData.csv" and "UJIIndoorLoc_validationData.csv". The former consists of 19937 examples from 933 distinct locations. The latter consists of 1111 examples from 1074 distinct locations and includes examples generated by users and smartphones that did not participate/were not used in generating "UJIIndoorLoc_trainingData.csv".
In this research, we have proposed Scalable ResNet model and compared the performances with other Models. Figure 1 shows the complete methodology of this research.
Figure 1. Proposed flow chart
Table 2. Summarizes essential information about each variable
|
Column |
Description |
Units |
Values |
|
WAP001 - WAP520 |
RSSI received by the device from given WAP |
dBm |
Integer values from -104 to 0 (weak to strong), 100 (no signal) |
|
Longitude |
Longitude of position |
meters |
-7695.9387549299299000 to -7299.786516730871000 |
|
Latitude |
Latitude of position |
meters |
4864745.7450159714 to 4865017.3646842018 |
|
Floor |
Floor number |
--- |
Integer values from 0 to 4 |
|
Building ID |
Building number |
--- |
Integer values from 0 to 2 |
|
Space ID |
Integer identifying the space (lab, classroom, etc.) |
--- |
Various integer values |
|
Relative position |
Relative position concerning the space |
--- |
1 - inside, 2 - outside in front of the door |
|
User ID |
User identifier |
--- |
Integer values from 0 to 18 |
|
Phone ID |
Android device identifier |
--- |
Integer values from 0 to 24 |
|
Timestamp |
UNIX times when the example was recorded |
--- |
Integer values |
A. ResNet architecture
It is necessary to know where people spend their time and how they interact with the environment in order for future smart and green cities to be achieved. This is where having a sense of where you are comes in handy. When it comes to location-aware services in the future, large shopping malls and university campuses will tremendously benefit from scalable indoor localization. On each floor, there are currently dozens of different types of spaces (such as offices, lecture halls, and labs) available. Our localization area would have more spots to choose from if we adopted a grid-based depiction. As a result, a scalable indoor positioning system is needed to cover such a large region.
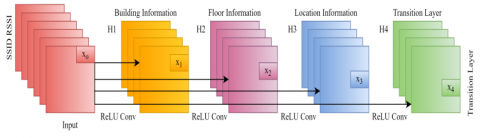
Systems for large-scale indoor localization based on ResNet are depicted in Figures 2 and 3. Building/floor/location categorization is divided into numerous subtasks, as shown in Figure 2, for each level of building, floor, and location.
Traditional building, floor and location estimates are replaced by ResNet's hierarchical Wi-Fi fingerprinting methods because of the use of ResNet. It takes more time and effort to train the ResNet at the floor and location levels of the system because of the hierarchical architecture's dependency on several sub-data sets that are derived from a common dataset.
When this happens, the system experiences a tremendous amount of computational stress. That's why our study is focused on an integrated architecture that employs a single ResNet to classify a structure's floor as well as its location using a single dataset. Each of the three buildings in the UJIIndoorLoc dataset has 933 distinct positions. Since the misfortune and precision are determined utilizing smoothed building/floor/area marks, it overlooks the progressive idea of the characterization issue and the comparing misfortune that outcomes from erroneously arranging a structure, floor, or area during the preparation stage. A current multi-class classifier and leveled names can be used to mirror the progressive idea of building/floor/area classification in a ResNet classifier. It may be difficult to utilize backpropagation to train a ResNet with flattened labels because of the convoluted loss function and lack of a closed-form gradient function. ResNet classifiers using multi-class classification have been shown to have scalability issues, therefore here we provide a multi-label classification-based scalable ResNet framework to address this issue. To start, successive numbers are relegated to building and floor IDs; the last two must be significant when related with more elevated level numbers; these numbers are encoded separately and consolidated into a vector for multi-name order, as displayed in the picture.
B. Model training
One could wonder why we didn't just utilize the cross-validation score of the tweaked models. What matters most is how the model performs on a validation set, in this example, a trained ResNet. If you search across many different hyper parameters, it is possible that a particular collection of hyper parameters will yield a high cross-validation score or perform well in the cross-validation test set only by random chance. Most models have more than two or three hyper parameters to tweak, thus this is a legitimate worry. Hyper parameter combinations can be multiplicative, thus there are numerous trials. Overestimation of our customized model is possible if we use cross-validation score/validation set score as the final metric for measuring model performance. In order to avoid overestimating model performance owing to random chance, we provide the modified model's performance on a second test set as the final indicator. A "lucky" model is unlikely to be successful in both validation and testing.
There are fingerprints from devices that did not take part in the generation of "UJIIndoorLoc trainingData.csv" in our test set called "UJIIndoorLoc validationdata-.csv." Because of this, model performance evaluations on the test set are remarkably accurate. Experiments with devices that the model had not been exposed to during training are also included in the dataset. However, a different strategy we could have used is to combine "UJIIndoorLoc trainingData.csv" and "UJIIndoorLoc validation- Data.csv" first (randomly combining the rows from each), then 1) if using cross-validation, split the combined dataset into a training set and a test set, where the training is further divided into folds during cross-validation, 2) if not using cross-validation, split We believe that the strategy we choose to solving this challenge will make a difference in how we tackle the problem differently from the other. We've picked an architecture that relies on testing the model on data it hasn't seen before. Afterwards, we show it instances of models it hadn't seen and examples generated by devices it hadn't seen. Because it did so well on the test set, the optimized model must be broader, which is a positive thing. A different approach involves combining the two datasets and making sure that all devices in "UJIIndoorLoc validationData.csv" are included in both sets of training and validation data. We believe that either design decision can be justified, and either one meets the study's purpose, which is to analyse the practicality of Wi-Fi signals for indoor positioning.
C. Data preprocessing
There were no omitted values. Wi-Fi fingerprints (WAP001-WAP520) were employed as characteristics in this investigation. The received signal intensity was transformed to a positive number, ranging from 0 to 105 to represent weak to strong signals. Only a few WAPs could be identified in any given scenario. Thus, a sparse matrix would better describe the data, which necessitated that we modify the no signals representation from 100s to 0s.
A place's longitude, latitude, floor, and building number are all that are needed to pinpoint its specific location. Notably, unlike a typical regression or classification problem, in which a single label contains two or more values or classes ("what is the sales volume of this product?" "what is the object in this image?" and "which brand does this user prefer, Sony or Acer?"), the problem in question contains several labels ("and a number of values/classes are contained in every single label"). As a result, the term "UNIQUE LOCATION" was coined to describe the situation. UNIQUE LOCATION takes on multiple values depending on the longitude, latitude, floor number, and building id, as the name says.
Features were not mean-centered in order to preserve the sparse data structure. There are many advantages to using normalized values, such as speeding up gradient descent methods. For example, normalizing features in training sets for ResNet allows for faster convergence of gradient descent techniques.
The ResNet training package requires that category variables be encoded into the dummy variable form using a one-hot-encoding algorithm. Before ResNet training, this was done for the UNIQUE LOCATION label. Numbers accompanied each feature.
D. Model explanation
ResNet classification uses layers made of mathematical constructs that loosely mimic biological neurons. We will not go into much detail here but give a good overview. In a ResNet, the features are inputted as a vector in the input layer, the first layer of the network. In the standard architecture, the input layer "neurons", or units, are connected to a series of layers, each containing multiple units, called the hidden layers. The final layer is the output layer. Since UNIQUE LOCATION had more than two possible classes, we used a type of output layer that can represent the predicted class. In this case, we used a Softmax output layer, which contains the same number of units as several classes in UNIQUE LOCATION. The value of each unit is interpreted as a predicted probability that the input example belongs to the class that the output unit represents. The predicted class for the input example is then chosen as the class with the highest predicted probability. The Softmax layer uses a Softmax activation function for each of its units.
The hidden layer units use other activation functions. At each hidden layer unit, an activation function maps the (linear) combination of outputs from the units in the previous layer to a new scalar value. Nonlinear activations functions, that is, activation functions that perform a nonlinear mapping of the input to the output, enable ResNet to learn complicated and highly nonlinear hypotheses. Finally, the weights and biases used to linearly combine layer outputs for feeding into units in the next layer are the ResNet parameters during training. These values are sometimes learned using batch gradient descent but more often by a faster variant called stochastic gradient descent or other variants of stochastic gradient descent. Essentially, stochastic gradient descent finds the optimal weight and bias values by considering batches of training examples at each iteration instead of the entire training set. It then repeats this process after each training example has been used once, called an epoch.
i) Hyper parameters tuned
Epochs – the number of epochs used during training, integer.
Batch size – the size of each batch used during one iteration of Adam (a variant of stochastic gradient descent used to train all ResNet tested), integer.
Hidden layers – the number of hidden layers, integer.
Neurons_per_hidden_layer – the number of "neurons", or units in each hidden layer, integer. Note that we did not try different numbers of units in each hidden layer.
L2_reg_lambda – L2 regularization parameter, float.
Dropout – dropout regularization parameter, the probability for a unit to be killed off during an optimization iteration, float. All other hyper parameters were their default values as defined by the package.
ii) Model tuning and evaluation
A grid search was conducted manually. Cross-validation was not used due to the higher computational cost and training time required for each ResNet. The hyper parameter values that gave the highest accuracy on the validation set was chosen as the best model. The differences between the validation set accuracies and accuracies on the training set were calculated to give us an idea of the degree of overfitting.
E. Data analysis
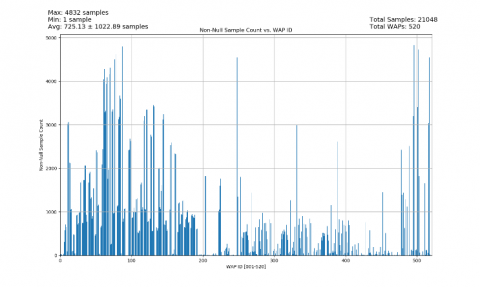
An access point can theoretically reach 10,000 square feet, but our normal 1600-square-foot per access point statistic from above will suffice for now. Figure below shows the active WAPS per sample.
Figure below shows the building and floor counts that has been considered in this study.
Figure 4. Floors and buildings counts
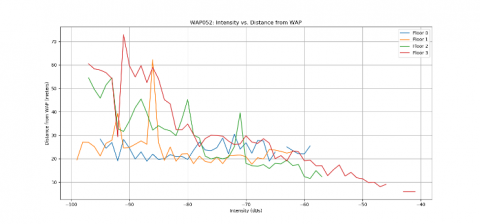
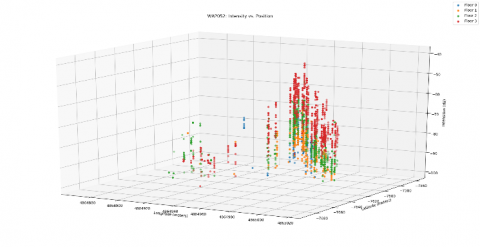
Figure 5. Distance vs intensity
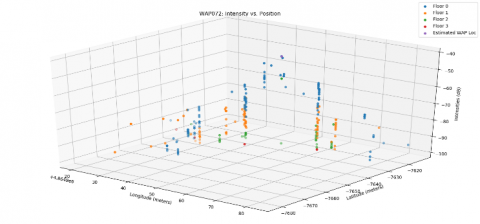
Figure 6. Distance vs intensity 3D plane
Figure 7. Latitude vs longitude
Figure 8. Data preprocessing to check null values
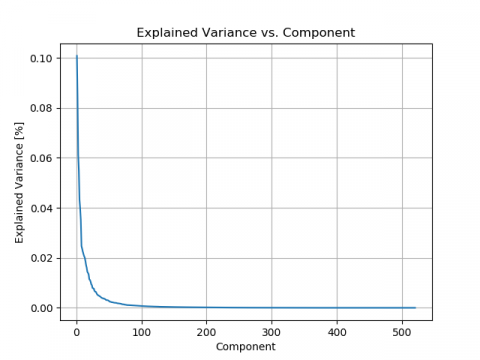
Figure 9. Explained variance vs components
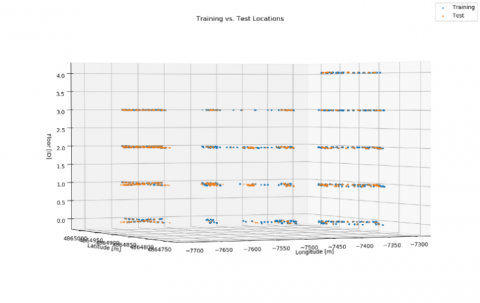
Data has been splitted into training and testing set in order to check the performance of algorithm. Figure below shows the visualization of training and testing data set.
There are two types of access points: those that communicate via radio and those that connect to a wired network, like Ethernet or Wi-Fi.
The measure of time and space A weak Wi-Fi signal can be caused by a variety of factors, the most prevalent of which is a lack of proximity to the router. To avoid interfering with other devices, wireless routers and access points can only transmit at low power levels, limiting their useful range to about 100 feet indoors. Below figure computes distance with intensity in WAP.
Figure 10. Training and testing set
F. Evaluation metrics
For deep learning models, following are the metrics
Table 3. Performance metrics
|
Metrics |
Description |
|
Building Error |
sum of all misclassified building samples over the total sample count * 100 (percent) |
|
Floor Error |
sum of all misclassified building samples over the total sample count * 100 (percent) |
|
Mean Coordinate Error |
Mean Euclidean error from estimated latitude and longitude against the true latitude and longitude. |
|
Standard Error |
sum of Building Penalty*Building Error + Floor Penalty*Floor Error + Coordinate Error where the Building Penalty is 50 and the Floor Penalty is 4 |
|
Mean Squared Error |
$\mathrm{MSE}=\frac{1}{n} \sum_{i=1}^{n}\left(Y_{i}-\widehat{Y}_{i}\right)^{2}$ |
|
Accuracy |
Accuracy $=\frac{(\mathrm{TP}+\mathrm{TN})}{(\mathrm{TP}+\mathrm{FP}+\mathrm{TN}+\mathrm{FN})}$ |
|
Kappa |
It is always less than or equal to 1 for Kappa to be considered. A score of 1 indicates perfect agreement, whereas a score below 1 indicates agreement that falls short of perfection. Occasionally, the Kappa value may be negative. As a result, the degree of agreement between the two observers was smaller than what might be expected by chance alone. |
|
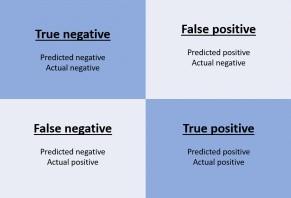
Confusion Matrix |
The findings of the ResNet model are shown in this section. People's position at Jaume I University can be predicted from WAP signal information using ResNet. Each of the training and validation datasets contains information about 520 different WAP signal strengths, as well as information about the buildings and levels in which they are located. It also contains information about where each user has logged in, as well as their relative position (within or outside the room). The information was gathered at Jaume I University. The above-mentioned source link has additional details on the dataset. A user at Jaume I University connects to the internet and we construct models that forecast their position (building, floor, and coordinates) based on the WAPs signal strength.
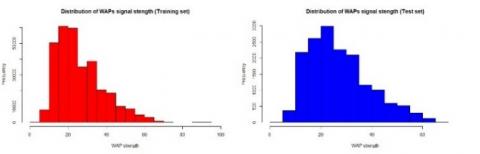
The figure below shows the distribution of WAPs signal strength for each dataset.
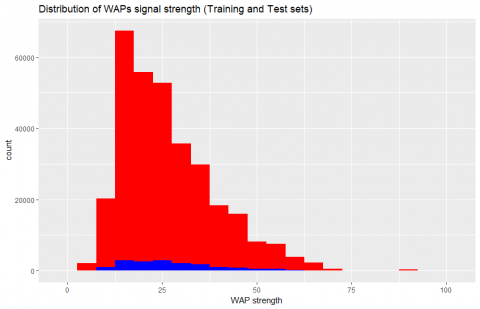
To make the comparison easier to understand, the following graph displays the strength distribution of WAPs on the same histogram.
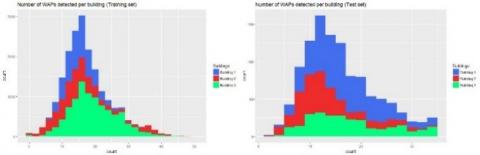
The figure below shows the number of WAPs found per building in the training and validation set.
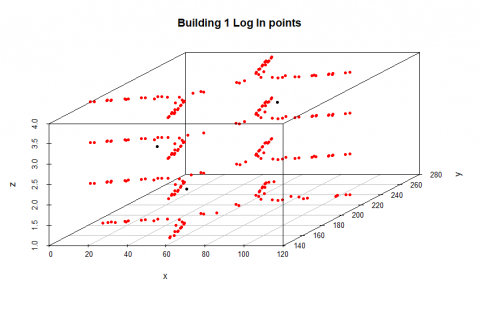
Users' login locations in Building 1 from the training set are shown in the following diagram.
We looked at areas with good, medium, and poor signals. Using this example, the places where consumers experienced signal strength of at least 60 dB are shown in the accompanying figure (out of 104).
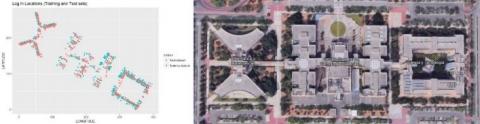
Longitude and latitude are the World Geodetic System coordinates used in this collection. We started with zero and worked my way up.
Login locations from training and validation sets are given in the figure below, together with a Google Map image showing the buildings of JIU.
The WAP signals in the center of the structure were the weakest, as shown above. Because of this, location estimates for this building will be less accurate later on.
Figure 11. Distribution of WAPs signal strength for each dataset
Figure 12. Distribution of WAPS testing and training sets
Figure 13. WAPs found per building in the training and validation set
Figure 14. Google map image showing the buildings of JIU
Figure 15. Building 1 log in points
Figure 16. Log in locations
Based on a person's IP address, we first developed a model that could predict where they had connected to the internet. I've decided to normalize the rows of WAPs instead of relying on the initial model's inaccuracy. The model's performance significantly improved when the parameters were set to range from 0 to 1. Various WAPs are not detected by either the test or validation sets. Only the columns that intersected remained after these others were deleted from both databases. This was further improved by adjusting the threshold for WAP signal intensity. The best models for normalized data are those that only use rows with an average value larger than or equal to 0.6. (Excluding non-detected WAPS).
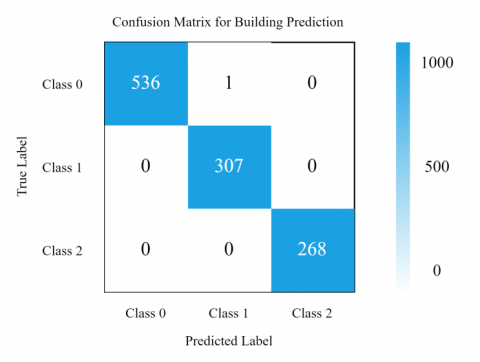
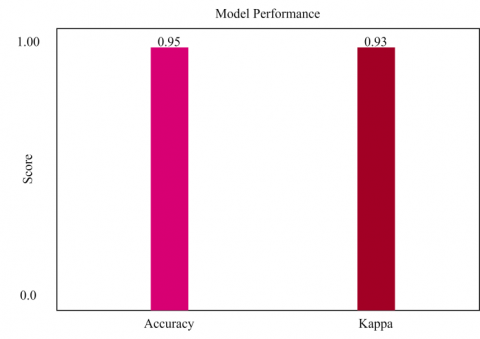
A. Building prediction
It is possible to get 100% accuracy with normalized WAP rows in the ResNet model for predicting buildings on the validation set. The model's performance in terms of accuracy and kappa as well as confusion matrix is shown below in the figure below:
Figure 17. Model performance for building prediction
Figure 18. Confusion matrix of ResNet for building prediction
B. Floor prediction
With ResNet, the best results were reached in all three buildings, and the difference in performance (approximately 1 percent) in floor projections for Building 1 and Building 3 may be inconsequential.
a) Building 1 floor prediction
The ResNet Algorithm produced the best results. The following graphs demonstrate the relationship between performance and mental perplexity:
Figure 19. Model performance for floor building 1 prediction
Figure 20. Confusion matrix of ResNet for floor building 1 prediction
b) Building 2 floor prediction
Figure 21. Model performance for floor building 2 prediction
This building's floor prediction has the lowest performance, as previously stated. Listed below are the performance and confusion matrixes:
Figure 22. Confusion matrix of ResNet for floor building 2 prediction
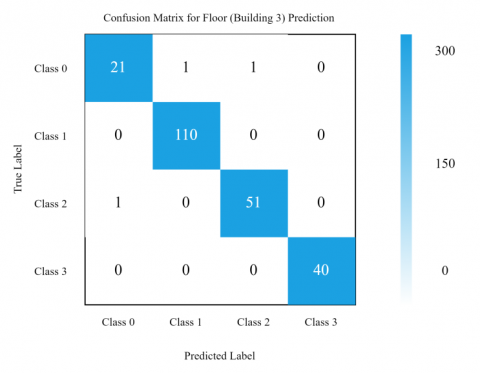
c) Building 3 floor prediction
Performance and confusion matrix with model using ResNet algorithm are shown below:
Figure 23. Model performance for floor building 3 prediction
Figure 24. Confusion matrix of ResNet for floor building 3 prediction
C. Coordinates prediction
ResNet was used to determine the final location of an internet user based on the strength of their signal. Longitude and latitude predictions necessitate their own models, resulting in a total of six models.
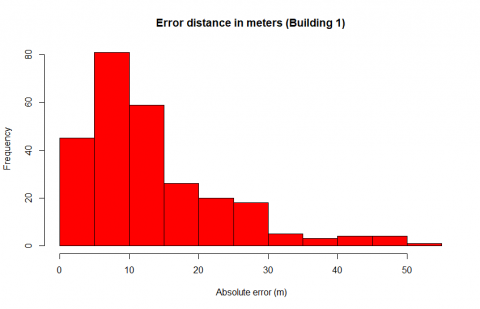
a) Building 1 coordinates prediction
Here is the model's performance on Building 1's validation set for longitude and latitude.
Performance of the ResNet model for longitude: RMSE = 7.6099567
Latitude RMSE = 7.1845765. The visual comparison of anticipated and actual coordinates is shown in the following figure.
Figure 25. Log in location predicted by ResNet
Below is a graph showing the distribution of the inaccuracy in metres in the distance measurement.
Figure 26. Error distance in measures building 1
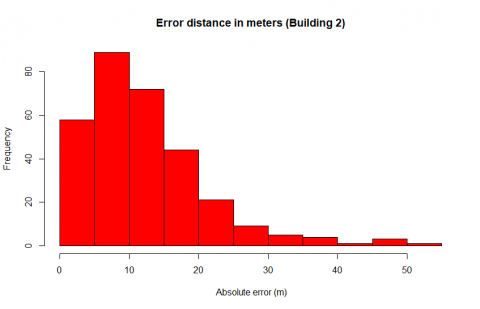
b) Building 2 coordinates prediction
Figure 27. Log in locations building 2
Here is the model's performance on Building 1's validation set for longitude and latitude.
The RMSE for the longitude model is 9.385072.
RMSE = 11.4652267 for the latitude model.
The visual comparison of anticipated and actual coordinates is shown in the following figure.
D. Predicted by ResNet
The distribution of the distance error in meters is shown in the figure below.
Figure 28. Error distance in measures building 2
c) Building 3 coordinates prediction
Here is the model's performance on Building 1's validation set for longitude and latitude.
Figure 29. Visual comparison of anticipated and actual coordinates
Figure 30. Error distance in measures building 3
There was RMSE of 12.8063785 for the longitude and 10.7050057 for the latitude models. The visual comparison of anticipated and actual coordinates is shown in the following figure.
Below is a graph showing the distribution of the inaccuracy in metres in the distance measurement.
Table below shows the comparative performance of ResNet with VGG and Inception V2 for the prediction of Floor, Building and Coordinates:
Table 4. Comparative performance of ResNet with VGG and inception V2
|
Transfer Learning Model |
Accuracy for Building Prediction |
Accuracy for Floor Prediction |
RMSE (avg) for Coordinates Prediction |
|
Proposed |
0.99 |
0.96 |
Long: 9 Lat: 11 |
|
VGG16 |
0.83 |
0.81 |
Long: 12 Lat: 23 |
|
VGG19 |
0.81 |
0.84 |
Long: 32 Lat: 23 |
|
Inception V2 |
0.89 |
0.81 |
Long: 24 Lat: 12 |
For future large-scale location-aware applications that will cover a complex of multistory buildings, scalable indoor localization techniques will be essential. We describe in this publication the results of our investigation into the application of ResNet for scalable building/floor categorization and floor-level position estimate based on Wi-Fi fingerprinting. Using our novel ResNet architecture, we are able to estimate building and floor-level coordinates. This design makes use of a stacked autoencoder to decrease feature space and a feed-forward classifier to categorize multiple labels of building/floor/location. Using Wi-Fi fingerprinting, this architecture serves as the foundation for our indoor localization system, which can operate across many buildings and floors. Using three buildings with four or five stories each on the Jaume I University (UJI) campus in Spain, we tested the accuracy of building/floor estimation as well as floor-level coordinate’s estimation. A single ResNet has been used to do indoor localization, and the results have been shown to be competitive with current best practises. In order for the proposed indoor localization system based on Wi-Fi fingerprinting to function at levels close to the current state of the art, only one ResNet is required, allowing it to be deployed with less complexity and with less energy consumption on mobile devices.
[1] Abbas, M., Elhamshary, M., Rizk, H., Torki, M., Youssef, M. (2019). WiDeep: WiFi-based accurate and robust indoor localization system using deep learning. In 2019 IEEE International Conference on Pervasive Computing and Communications, pp. 1-10. https://doi.org/10.1109/PERCOM.2019.8767421
[2] Koike-Akino, T., Wang, P., Pajovic, M., Sun, H., Orlik, P.V. (2020). Fingerprinting-based indoor localization with commercial MMWave WiFi: A deep learning approach. IEEE Access, 8: 84879-84892. https://doi.org/10.1109/ACCESS.2020.2991129
[3] Kim, K.S., Lee, S., Huang, K. (2018). A scalable deep neural network architecture for multi-building and multi-floor indoor localization based on Wi-Fi fingerprinting. Big Data Analytics, 3(1): 1-17. https://doi.org/10.1186/s41044-018-0031-2
[4] Bregar, K., Mohorčič, M. (2018). Improving indoor localization using convolutional neural networks on computationally restricted devices. IEEE Access, 6: 17429-17441. https://doi.org/10.1109/ACCESS.2018.2817800
[5] Tiku, S., Pasricha, S. (2019). Overcoming security vulnerabilities in deep learning--based indoor localization frameworks on mobile devices. ACM Transactions on Embedded Computing Systems (TECS), 18(6): 1-24. https://doi.org/10.1145/3362036
[6] Wang, X., Wang, X., Mao, S. (2018). Deep convolutional neural networks for indoor localization with CSI images. IEEE Transactions on Network Science and Engineering, 7(1): 316-327. https://doi.org/10.1109/TNSE.2018.2871165
[7] Li, C., Yang, T., Zhang, Q., Xu, H. (2018). Object-based indoor localization using region-based convolutional neural networks. In 2018 IEEE International Conference on Signal Processing, Communications and Computing (ICSPCC), pp. 1-6. https://doi.org/10.1109/ICSPCC.2018.8567795
[8] Wei, Y., Akinci, B. (2019). A vision and learning-based indoor localization and semantic mapping framework for facility operations and management. Automation in Construction, 107: 102915. https://doi.org/10.1016/j.autcon.2019.102915
[9] Song, X., Fan, X., Xiang, C., Ye, Q., Liu, L., Wang, Z., Fang, G. (2019). A novel convolutional neural network based indoor localization framework with WiFi fingerprinting. IEEE Access, 7: 110698-110709. https://doi.org/10.1109/ACCESS.2019.2933921
[10] Árvai, L. (2021). Convolutional neural network-based activity monitoring for indoor localization. Pollack Periodica, 16(3): 7-12. https://doi.org/10.1556/606.2021.00370
[11] Zhao, B., Zhu, D., Xi, T., Jia, C., Jiang, S., Wang, S. (2019). Convolutional neural network and dual-factor enhanced variational Bayes adaptive Kalman filter based indoor localization with Wi-Fi. Computer Networks, 162: 106864. https://doi.org/10.1016/j.comnet.2019.106864
[12] Zhong, Z., Tang, Z., Li, X., Yuan, T., Yang, Y., Wei, M., Lee, S. (2018). XJTLUIndoorLoc: A new fingerprinting database for indoor localization and trajectory estimation based on Wi-Fi RSS and geomagnetic field. In 2018 Sixth International Symposium on Computing and Networking Workshops (CANDARW), pp. 228-234. https://doi.org/10.1109/CANDARW.2018.00050
[13] Tiku, S., Kale, P., Pasricha, S. (2021). QuickLoc: Adaptive deep-learning for fast indoor localization with mobile devices. ACM Transactions on Cyber-Physical Systems (TCPS), 5(4): 1-30. https://doi.org/10.1145/3461342
[14] Mittal, A., Tiku, S., Pasricha, S. (2018). Adapting convolutional neural networks for indoor localization with smart mobile devices. In Proceedings of the 2018 on Great Lakes Symposium on VLSI, pp. 117-122. https://doi.org/10.1145/3194554.3194594
[15] Wang, F., Feng, J., Zhao, Y., Zhang, X., Zhang, S., Han, J. (2019). Joint activity recognition and indoor localization with WiFi fingerprints. IEEE Access, 7: 80058-80068. https://doi.org/10.1109/ACCESS.2019.2923743
[16] Chen, K.M., Chang, R.Y., Liu, S.J. (2019). Interpreting convolutional neural networks for device-free Wi-Fi fingerprinting indoor localization via information visualization. IEEE Access, 7: 172156-172166. https://doi.org/10.1109/ACCESS.2019.2956187
[17] Jang, H.J., Shin, J.M., Choi, L. (2017). Geomagnetic field based indoor localization using recurrent neural networks. In GLOBECOM 2017-2017 IEEE Global Communications Conference, pp. 1-6. https://doi.org/10.1109/GLOCOM.2017.8254556
[18] Lin, W.Y., Huang, C.C., Duc, N.T., Manh, H.N. (2018). Wi-Fi indoor localization based on multi-task deep learning. In 2018 IEEE 23rd International Conference on Digital Signal Processing (DSP), pp. 1-5. https://doi.org/10.1109/ICDSP.2018.8631868
[19] Liu, C., Wang, C., Luo, J. (2020). Large-scale deep learning framework on FPGA for fingerprint-based indoor localization. IEEE Access, 8: 65609-65617. https://doi.org/10.1109/ACCESS.2020.2985162
[20] Chen, Z., AlHajri, M.I., Wu, M., Ali, N.T., Shubair, R.M. (2020). A novel real-time deep learning approach for indoor localization based on RF environment identification. IEEE Sensors Letters, 4(6): 1-4. https://doi.org/10.1109/LSENS.2020.2991145
[21] Zhou, B., Yang, J., Li, Q. (2019). Smartphone-based activity recognition for indoor localization using a convolutional neural network. Sensors, 19(3): 621. https://doi.org/10.3390/s19030621
[22] Zhang, G., Wang, P., Chen, H., Zhang, L. (2019). Wireless indoor localization using convolutional neural network and Gaussian process regression. Sensors, 19(11): 2508. https://doi.org/10.3390/s19112508
[23] Njima, W., Ahriz, I., Zayani, R., Terre, M., Bouallegue, R. (2019). Deep CNN for indoor localization in IoT-sensor systems. Sensors, 19(14): 3127. https://doi.org/10.3390/s19143127
[24] Liu, Z., Dai, B., Wan, X., Li, X. (2019). Hybrid wireless fingerprint indoor localization method based on a convolutional neural network. Sensors, 19(20): 4597. https://doi.org/10.3390/s19204597
[25] Ashraf, I., Hur, S., Park, S., Park, Y. (2019). DeepLocate: Smartphone based indoor localization with a deep neural network ensemble classifier. Sensors, 20(1): 133. https://doi.org/10.3390/s20010133