Jinxin Ma| Limin Cui*
OPEN ACCESS
This paper focuses on three algorithms based on analysis of variance (ANOVA), cluster analysis (CA) and factor analysis (FA) to analyse student scores, and uses FA-based algorithm to objectively evaluate students. Firstly, the ANOVA-based algorithm was adopted to study whether the differences in majors have a significant impact on the students' scores of advanced mathematics by selecting the scores of the 303 students in the four different majors from 4 different classes and departments of Grade 2013-2015. Meanwhile, using the compulsory courses scores of the 50 students of Grade 2013 in their freshmen year of the Oil and Gas Storage and Transportation Engineering Department of the Mechanical Engineering College. Meanwhile, the CA-based algorithm was applied to classify the students and formulate corresponding plans for different types of students, in order to improve students' performance. In addition, the FA-based algorithm was used to find out the main factors affecting the scores of students in various courses, obtain the composite scores by calculating the factor scores, and further make comprehensive evaluation of the students. Finally, it’s verified that the three algorithms are feasible through the experiments. This shall be great significance for the student score evaluation and teaching research.
analysis of variance (ANOVA), cluster analysis (CA), factor analysis (FA), algorithm, score
At present, the algorithms based on multivariate statistical analysis aren’t well applied to the evaluation of the college students’ scores. The curriculum scores of the students are stored in the university's score database, only containing some simply recorded information, but without focusing on implied information. Thus, these scores haven’t played its due value for the time being. In this context, it is an important task for modern educational researchers to analyse the students' comprehensive scores using the multivariate statistical analysis algorithm and improve the teaching quality.
Many scholars have conducted research on how to use multivariate statistical analysis for evaluating the student scores. Liu Yinping and Ma Xiaoyue (2011), using the SPSS software, classified the students by cluster analysis, and find the main courses affecting the student performance through factor analysis, to obtain the comprehensive evaluation model of student score with the more scientific evaluation results [1]. He Lijuan, Zhang Kai (2013), taking the semester grade of a class as the original data, used CA to classify the students and FA to find the main courses affecting their major, and finally obtained a comprehensive evaluation model; comparing with the commonly used method of grade point average (GPA), the results of this model are more reliable [2]. Sun Guo, Ma Yanying (2017) conducted the principal component analysis and CA to study the implied information in students’ score data, providing scientific and effective data for teachers to teach students in accordance with their respective aptitude [3]. Liu Haisheng (2002) applied the principal component analysis method to comprehensively evaluate the scores of 37 random students, and achieved good results [4]. In view of the deficiencies in the calculation, Li Haiming, Zhao Haiying, Li Huan (2013) adopted the principal component analysis to understand the students' comprehensive situation more completely, thereby developing a more efficient teaching method [5]. Brijesh Kumar Baradwaj (2011) evaluated students and predicted their performance by extracting student score information [6]. Amjad Abu Saa (2016) collected the student information, classified students correctly, and finally concluded personal and social factors affecting student scores [7]. Literature [8] analysed the scores through multivariate statistical analysis methods and obtained the evaluation model, and finally proposed measures to effectively improve the teaching quality. Literature [9] used principal component analysis to evaluate the students in a more comprehensive and reasonable manner. In literature [10], the significance of factors affecting students' performance were analysed using the ANOVA. Literature [11-14] performed multivariate statistical analysis to analyse the main factors affecting students' performance, greatly contributed to the student management and performance evaluation. Literature [15-16] utilized FA to understand the main courses and other related factors that affect student scores, and proposed practical solutions, which played a major role in education and teaching.
This paper consists of five chapters. The first chapter mainly introduces the background, research significance and research status. The second to fourth chapters elaborates on the design and experimental process of three algorithms: the analysis of variance, cluster analysis and factor analysis; variance analysis algorithm is used to study whether the difference of majors has a significant impact on the scores of students; the CA algorithm is to classify the students, and formulate the corresponding plans for different types of students in order to improve their academic performance; the FA algorithm is to find the main courses that affect the student scores, and then evaluate the students comprehensively. The fifth chapter is the conclusion and prospect.
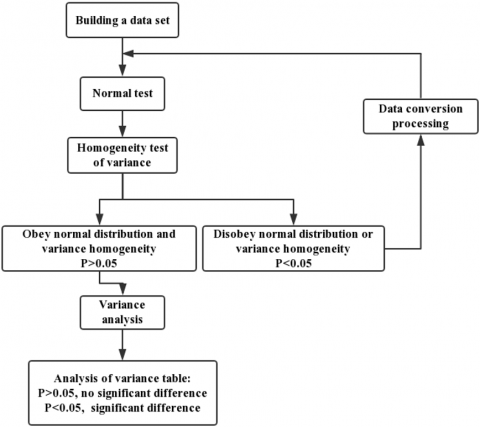
Figure 1. Flow design of the ANOVA-based algorithm
In the college teaching process, there are many factors affecting students' scores, such as the students’ psychological factors, origin of student, the teaching methods, and the environment etc. This section aims to study whether differences in majors have a significant impact on the students' scores of advanced mathematics. To this end, 303 samples of 11 classes in four different majors in Beijing Institute of Petrochemical Technology were selected on the advanced mathematics course from the students enrolled in 2013-2015, including 80×3 samples respectively from three classes of three grades in the Computer Science and Technology Department of Information Engineering College, 78×3 samples from three classes of three grades in the Automation Department of Information Engineering College, 85×3 from three classes of three grades in Chemical Engineering and Technology of Chemical Engineering School, and 60×2 samples from two classes of three grades in the Communication Engineering Department of Information Engineering College. Table 1 lists the algorithm based on ANOVA:
Table 1. Analysis of variance table
|
Analysis of variance |
||||||
|
|
Sum of squares |
variance |
Mean square |
F |
Significance |
|
|
2013 |
Between groups |
795.579 |
3 |
265.193 |
1.483 |
0.219 |
|
within groups |
53465.807 |
299 |
178.815 |
|
|
|
|
Total |
54261.386 |
302 |
|
|
|
|
|
2014 |
Between groups |
546.431 |
3 |
182.144 |
0.97 |
0.407 |
|
within groups |
56142.064 |
299 |
187.766 |
|
|
|
|
Total |
56688.495 |
302 |
|
|
|
|
|
2015 |
Between groups |
484.302 |
3 |
161.434 |
1.088 |
0.354 |
|
within groups |
44352.377 |
299 |
148.336 |
|
|
|
|
Total |
44836.68 |
302 |
|
|
|
|
Figure 2. Flow design of the CA-based algorithm
This paper selects the exam scores of 14 courses from 50 graduates of Grade 2013 majored in Oil and Gas Storage and Transportation Engineering of Mechanical Engineering School in the Beijing Institute of Petrochemical Technology as the experimental data. The 14 courses include basis of computer, college physics, physical experiment, college English, electrical and electronic technology, advanced mathematics, mechanical drawing, C language, probability and mathematical statistics, heat transfer, engineering fluid mechanics, linear algebra, organic chemistry, and theoretical mechanics. The 50 students are numbered as 1, 2, …, 50. The reasons for selecting these data are as follows:
(1) The selected data are all representative. This section selects the test data of the first-year students in Grade 2013; the freshman courses include basic compulsory courses, PE and computers. At present, most colleges have the same curriculum design for the first-year students.
(2) The data are very persuasive, because they come from the students in the strictly-disciplined exams, with a small possibility of false data.
(3) High school education before the freshman year is test-oriented, and the courses are simply designed. The scores in the first year of entering the university can truly reflect the students’ ability, which can help to analyse the students' strengths and weaknesses and further guides them. It is also useful for students to choose courses and majors on their own.
According to the CA-based algorithm, all the students can be classified into three groups: Group 2 have outstanding scores, Group 1 have good scores, and Group 3 common scores. Therefore, teachers or students can formulate the targeted teaching plans and learning strategies according to the results of CA, e.g., adding self-study time for Group 3 students, encouraging Group 2 to help the Group 1 and 3, and teachers pay more attention to the learning dynamics of the Group 3 students, in order to improve the teaching quality and the students’ learning effect.
The CA results were compared with the cumulative GPA of each student (only considering the courses covered in this study), as shown in Table 2.
Table 2. Comparison between cluster analysis results and cumulative grade point average
|
Student number |
GPA |
Ranking |
Group |
Student number |
GPA |
Ranking |
Group |
|
44 |
79.34 |
1 |
2 |
46 |
69.02 |
26 |
1 |
|
2 |
77.9 |
2 |
2 |
24 |
68.83 |
27 |
1 |
|
11 |
77.37 |
3 |
2 |
34 |
68.34 |
28 |
1 |
|
36 |
75.46 |
4 |
2 |
14 |
68.1 |
29 |
1 |
|
43 |
74.83 |
5 |
2 |
35 |
67.78 |
30 |
1 |
|
17 |
74 |
6 |
2 |
40 |
67.63 |
31 |
1 |
|
28 |
73.95 |
7 |
2 |
50 |
67.54 |
32 |
1 |
|
15 |
73.49 |
8 |
2 |
8 |
67.1 |
33 |
1 |
|
1 |
73 |
9 |
2 |
30 |
66.71 |
34 |
1 |
|
47 |
72.73 |
10 |
2 |
33 |
66.68 |
35 |
3 |
|
37 |
72.56 |
11 |
2 |
26 |
66.34 |
36 |
1 |
|
49 |
72.1 |
12 |
1 |
19 |
66 |
37 |
1 |
|
32 |
72.02 |
13 |
1 |
23 |
65.88 |
38 |
1 |
|
21 |
71.51 |
14 |
1 |
9 |
65.76 |
39 |
1 |
|
20 |
71.34 |
15 |
1 |
7 |
65.51 |
40 |
1 |
|
31 |
71.34 |
16 |
1 |
5 |
65.2 |
41 |
1 |
|
22 |
70.9 |
17 |
1 |
39 |
64.44 |
42 |
3 |
|
6 |
70.37 |
18 |
1 |
29 |
64.34 |
43 |
3 |
|
12 |
70.34 |
19 |
1 |
10 |
64.2 |
44 |
3 |
|
45 |
70.24 |
20 |
1 |
27 |
62.83 |
45 |
3 |
|
3 |
69.93 |
21 |
1 |
4 |
62.71 |
46 |
3 |
|
13 |
69.63 |
22 |
1 |
48 |
62.32 |
47 |
3 |
|
25 |
69.56 |
23 |
1 |
16 |
61.44 |
48 |
3 |
|
38 |
69.39 |
24 |
1 |
42 |
61.12 |
49 |
3 |
|
41 |
69.27 |
25 |
1 |
18 |
60.95 |
50 |
3 |
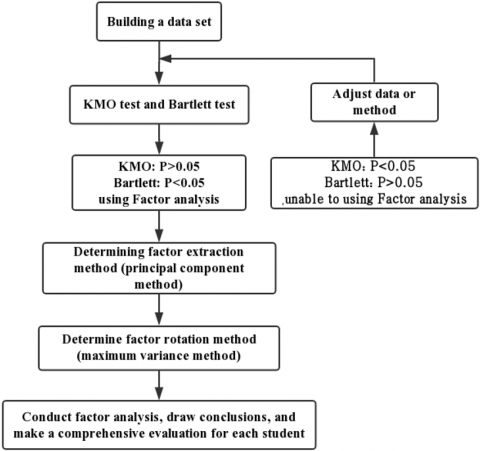
Figure 3. Flow design of FA-based algorithm
This experiment selects the scores of 50 students of Grade 2013 in Gas Storage and Transportation Engineering of Mechanical Engineering School of Beijing Institute of Petrochemical Engineering in their freshman year. Due to different curriculum settings of each major, the elective courses of each student are different. But in this study, only some compulsory courses were selected. Moreover, in order to better analyse students’ performance through FA, by excluding the courses similar to college students' mental health, situation and policy, this paper mainly focus on studying the public basic compulsory courses and professional compulsory courses for the same reasons as shown in the section 3 about the CA-based algorithm. The following symbols in Table 3 are used to indicate the courses in each course.
Table 3. Course number
|
Course |
No. |
Course |
No. |
|
Basis of computer |
X1 |
C language |
X8 |
|
College physics |
X2 |
Probability theory |
X9 |
|
Physical experiment |
X3 |
Heat transfer |
X10 |
|
English |
X4 |
Engineering fluid mechanics |
X11 |
|
Electrical and electronic technology |
X5 |
Linear algebra |
X12 |
|
Advanced mathematics |
X6 |
Organic chemistry |
X13 |
|
Mechanical drawing |
X7 |
Theoretical mechanics |
X14 |
Table 4. Variance contribution rate
|
Total variance explained |
|||||||||
|
Conponent |
Initial eigenvalue |
Extraction Sums of Squared Loadings |
Square rotating and loading/Rotation Sums of Squared Loadings |
||||||
|
Total |
Variance % |
Cumulative % |
Total |
Variance % |
Cumulative % |
Total |
Varianc e % |
Cumulative % |
|
|
1 |
2.069 |
14.77 |
14.77 |
2.069 |
14.77 |
14.77 |
1.534 |
10.95 |
10.95 |
|
2 |
1.762 |
12.58 |
27.36 |
1.762 |
12.58 |
27.36 |
1.469 |
10.49 |
21.44 |
|
3 |
1.567 |
11.19 |
38.55 |
1.567 |
11.19 |
38.55 |
1.415 |
10.11 |
31.55 |
|
4 |
1.395 |
9.966 |
48.51 |
1.395 |
9.966 |
48.51 |
1.385 |
9.893 |
41.45 |
|
5 |
1.374 |
9.812 |
58.33 |
1.374 |
9.812 |
58.33 |
1.369 |
9.782 |
51.23 |
|
6 |
1.016 |
7.256 |
65.58 |
1.016 |
7.256 |
65.58 |
1.311 |
9.366 |
60.6 |
|
7 |
0.918 |
6.556 |
72.14 |
0.918 |
6.556 |
72.14 |
1.29 |
9.212 |
69.81 |
|
8 |
0.793 |
5.661 |
77.80 |
0.793 |
5.661 |
77.80 |
1.119 |
7.992 |
77.80 |
|
9 |
0.692 |
4.946 |
82.75 |
|
|
|
|
|
|
|
10 |
0.604 |
4.317 |
87.06 |
|
|
|
|
|
|
|
11 |
0.559 |
3.994 |
91.06 |
|
|
|
|
|
|
|
12 |
0.488 |
3.489 |
94.55 |
|
|
|
|
|
|
|
13 |
0.41 |
2.93 |
97.48 |
|
|
|
|
|
|
|
14 |
0.353 |
2.52 |
100 |
|
|
|
|
|
|
It can be also seen from Table 4 that the cumulative variance contribution rate of the eight factors was 77.804 %, which can ensure better effect through the FA. In summary, after the second factor analysis, each factor can be clearly explained. Therefore, in order to make comprehensive evaluation of the students, the factor should be interpreted more clearly, and the cumulative variance contribution rate over 75 % should be selected, preferably to be 85 %.
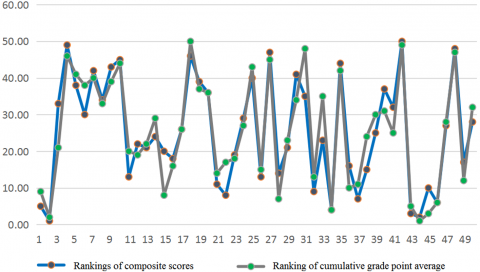
In addition, the ranking of factor scores was compared with the cumulative GPA of each student (only considering the courses covered in this paper), to obtain the results as follows:
Figure 4. Rankings of composite scores and cumulative grade point average
Figure 4 shows that the ranking of the composite score is basically consistent to the cumulative grade point average, but there are still some gaps. It’s due to that the composite scores are ranked comprehensively considering the weight of each course, and the grade point average only considers all the performance data of students. Thus, the FA-based algorithm is of research significance for making objective evaluation of the students.
Selecting the data from the GPAs of 14 courses by 50 graduates of Grade 2013 majoring in the Oil and Gas Storage and Transportation Engineering Department, the School of Mechanical Engineering in the freshman year, the comparison was made between the GPA, CA results, and composite scores. It can be seen that the CA results and composite scores differ little from the current GPA. Taking the comprehensive factors into consideration, all the algorithms used in this paper are feasible.
The ANOVA was used to analyse the scores of students in different majors, and concluded that the difference of majors will not affect the scores of students in advanced mathematics, indicating that the learning level of all students is roughly equal, and their scores won’t be affected by the major. That is, regardless of differences in majors, only by their own efforts, the students can achieve good results, which can spur on the students to face up to their majors and study hard.
The use of multivariate statistical analysis algorithms to conduct a scientific and efficient comprehensive assessment of student score can deeply exploit the potential ability of students, guide graduates' postgraduate entrance examination and employment, carry out education and teaching research, and improve the quality and efficiency of teaching management departments. Meanwhile, the teachers should better master this scientific method to guide their education and teaching from many aspects, because it has practical and guiding significance, making the teachers' work more scientific and reasonable. When using this algorithm to analyse student score data, the score data should be pre-processed, e.g., screening out the results, excluding the vacancy results and the retake scores or r make-up exam score for the same course, and selecting valuable data for analysis. Then, to understand the differences in scores of the same course between different departments, the ANOVA mentioned above can be used to determine whether differences in majors have an impact on student score. In addition, based on the principle of individualized teaching, the CA can be applied to classify the students of a class, a grade and even one professional department, and formulate a corresponding study plan for each type of student. Finally, the FA algorithm above is available to evaluate a student's comprehensive ability or determine whether one certain ability is outstanding, so that the students can be specifically understood and objectively evaluated.
The authors would like to thank Beijing Municipal Education Commission Scientific Research Plan, Social Science Plan General Project for their financial support under the grant number of No. KM201710017004, and the Project of “Passing the Scientific Research” for the Young Teachers of Beijing Institute of Petrochemical Technology and the Project of the School-level Education Reform and Research of Beijing Institute of Petrochemical Technology in the 2015-2016 Academic Year (NO. ZD20160801).
[1] Liu YP, Ma XY. (2011). Application of the multivariate statistical analysis in the stud ents scores. Jilin Normal University Journal (Natural Science Edition) (4): 89-91. https://doi:10.3969/j.issn.1674-3873.2011.04.027
[2] He LJ, Zhang K. (2013). Multivariate statistical analysis used in the student's discipline scores. Journal of Yangtze University (Natural Science Edition) 10(22): 19-21. https://doi:10.3969/j.issn.1673-1409.2013.08.006
[3] Sun G, Ma YY. (2017). A study on the application of principal component analysis to university students performance assessment. Journal of Jilin Teachers Institute of Engineering and Technology 33(06): 96-98. https://doi:10.3969/j.issn.1009-9042.2017.06.032
[4] Liu HS. (2003). The application of a method in comprehensive appraisal of achievements of students. Journal of North China Institute of Science and Technology 5(1): 77-79.
[5] Li HM, Zhao HY, Li H. (2013). Application of the multivariate statistical method in analysis of the students' experimental scores. Laboratory Science 16(2): 103-105. https://doi:10.3969/j.issn.1672-4305.2013.02.034
[6] Baradwaj BK, Pal S. (2011). Mining education data to analyze students performance. International Journal of Advanced Computer Science and Applications 2(6): 63-69. https://doi.org/10.14569/ijacsa.2011.020609
[7] Abu A. (2016). Educational data mining student’s performance prediction. International Journal of Advanced Computer Science and Applications 7(5): 212-220.
[8] Xu LQ. (2009). Statistical analysis and evaluation of exam performance. Journal of Zhejiang Business Technology Institute 8(2): 89-92. https://doi:10.3969/j.issn.1671-9565.2009.02.030
[9] Qiu YJ, Pan L. (2009). Application of factor analysis to students' performance rating. Journal of Chengdu University of Information Technology 21(1): 141-148. https://doi:10.3969/j.issn.1671-1742.2006.z1.030
[10] Song M, Zhang SD. (2012). Analysis of variance on student achievement assessent application. Logistics Engineering and Management 34(11): 226-227. https://doi:10.3969/j.issn.1674-4993.2012.11.082
[11] Liu L. (2012). Comprehensive evaluation of student achievement using multivariate statistical analysis. Agriculture and Technology 32(4): 184-185. https://doi:10.3969/j.issn.1671-962X.2012.04.141
[12] Quo DY, Jia G. (2013). College students education based on multivariate statistical analysis. Lecture Notes in Electrical Engineering 5: 571-578. https://doi.org/10.1007/978-1-4471-4844-9_76
[13] Christensen CM. Multivariate statistical analysis of differences between pre-professional groups of college students. The Journal of Experimental 21(3): 221-232. https://doi.org/10.1080/00220973.1953.11010455
[14] Wang HL. (2015). The modeling of college students’ psychological health based on statistical analysis. Proceedings of the 2014 International Conference on Computer Science and Electronic Technology, pp. 282-285. https://doi.org/10.2991/iccset-14.2015.61
[15] Chen QS, Liu HT, Cao L, Han C. (2015). Evaluation of new media’s influences on college students based on factor analysis. Advances in Intelligent Systems and Computing 362: 1511-1518. https://doi.org/10.1007/978-3-662-47241-5_126
[16] Li RQ. (2003). Application of primary component analysis into comprehensive appraisal of student's achievements. Open Education Research (4): 49-51. https://doi:10.3969/j.issn.1007-2179.2003.04.015