Julien Desvergnes* | Axel Carlier | Vincent Charvillat | Christophe Jouffrais
OPEN ACCESS
Visual neuroprostheses are devices that restore limited visual perception for visually impaired patients. Some of these neuroprostheses, implanted in the retina or the visual cortex, include an implant, a computing device and an external camera to capture the scene. Microstimulation of the retina or the visual cortex activates white spots called phosphenes, which restores a limited visual perception. Indeed, the resolution of current implants (i.e., the number and spacing of the electrodes) that have passed clinical trial phases remains low. Such a low resolution, coupled with the limited number of different colours rendered by the implants, limits the information that can be transferred. Hence, the regular rendering process used in the implants, called scoreboard, is insufficient to provide implanted patients with a good understanding of the visual scene and complex sensorimotor processes such as wayfinding. Ongoing research mainly aims at maximising the quality and quantity of the phosphenes provided by the implant. We set up a comparative study between different renderings, and we showed that providing the implanted patient with the possibility to switch between different renderings significantly increases the understanding of the environment.
visual neuroprostheses, interactive rendering, retinal implant, computer vision, blind
According to the WHO [1], 253 million people are visually impaired: 36 million of them are blind, and 217 million have moderate to severe visual impairment. Visual neuroprostheses first appeared in the 1960s [2] and have emerged as a promising technique for partially restoring vision in people with visual impairments. Over the last ten years, several implants have passed clinical trials [3] but show limited improvement in scene perception. Since the implants have a low resolution (about 300 electrodes), the way to choose the electrodes to stimulate appears to be the main difficulty. This study is based on the analysis of the needs of blind people provided by Ratelle and Couturier [4]. Their report presents the elements described as necessary to perform certain tasks by the blind (locating obstacles, catching objects,...). We compared three different prosthetic rendering modes: the regular Scoreboard rendering; a rendering that combines both semantic object segmentation and scene structure detection (called “Combined”), which is similar to a recent state-of-the-art rendering [5]; and a new rendering method that we called "Switch", which allows switching between the Combined rendering and two other renderings where only objects or only structure can appear.
Our hypothesis is that the Switch rendering mode provides a better understanding of the visual scene than the two other rendering modes (Scoreboard and Combined). Since it is impossible to perform such tests on implanted patients, the study was performed with a prosthetic vision simulator inspired by clinical results. Our results, obtained on twenty subjects, show that using the Switch allows subjects to better understand and analyse outdoor scenes.
2.1 Visual neuroprostheses
Visual neuroprostheses are devices designed to restore visual perception in people with partial or total blindness. They usually consist of a portable camera, a small computer and an array of electrodes that is implanted in the retina. The neuroprosthesis generates electrical micro-stimulations that cause the appearance of blurred points called phosphenes. Several devices have been developed, and some implants have been clinically tested.
Current visual neuroprosthesis are based on the retinal implantation of a limited number of electrodes (6x10 for the Argus II developed by Second Sight [6], 21x18 for the PRIMA system developed by Pixium Vision [7]). While these neuroprostheses have improved the daily lives of many blind people [8], the restored visual perception is too weak to allow more advanced perceptual or sensorimotor processes such as wayfinding.
2.2 Different phosphenic renderings depending on the task
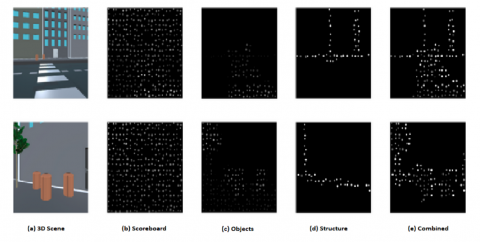
The limitations of current visual neuroprostheses pose significant problems for rendering a scene in a comprehensible manner. The historical method of "Scoreboard" rendering consists in reducing the captured image to the resolution of the implant, then converting the image to grayscale and quantifying the grayscale to the intensity level supported by the implant (Figure 1B). However, several studies have shown that specific image processing can improve the performance of subjects involved in various perceptual or cognitive tasks [9-11]. Specifically, Sanchez-Garcia et al. [5] proposed a rendering that highlights the structural edges and silhouettes of segmented objects. An example of this type of rendering is proposed on Figure 1E.
Figure 1. Examples of prosthetic renderings: (a) shows the initial image in a virtual environment. (b) shows how (a) is rendered with the Scoreboard rendering. (c) shows how (a) is rendered with a method that detects objects only (semantic object segmentation), and (d) shows how (a) is rendered with a method that enhances structural information in the scene (structure enhancement). (e) is a rendering combining (c) and (d) and called Combined
Due to the difficulty in involving implanted patients to test different renderings, the use of a prosthetic vision simulator is common [5, 9, 10, 12]. It allows doing simulations of different implants (size, position, resolution) in various contexts (2D or 3D visual scenes, static or dynamic). To conduct this study, we have created a prosthetic vision simulator using the Unity 3D engine (Unity Technologies, version 2019.4.19f1). This tool initially dedicated to the development of video games includes many functionalities (rendering engine, physics engine, user interface components) which allowed us to develop an online simulator.
3.1 Simulated implant
We chose to simulate the PRIMA neuroprosthesis developed by Pixium Vision, Paris, France, made of a 21x18 electrodes array. Our choice was motivated by the fact that it is one of the most recent implants, having passed clinical trials [4]. In addition; it is one of the implants with the highest resolution to date. For instance, a competing device called Argus II (Second Sight Medical Products Inc., Sylmar, CA, USA) has 6x10 electrodes only [13].
Our simulator was inspired by [12, 14]. During the experiment, to ensure that the visual rendering was similar to reality, we asked the subjects to stand at a distance between 50 and 75 cm from the screen. Since the display area on the screen was 10cm x 10cm, the perceived field of view was about 10°, which is close to what was measured during the PRIMA clinical trials. Each electrode can generate a phosphene with four levels of grey. A dropout rate of 10% was applied to the electrodes to simulate non-functional or broken electrodes. A Gaussian blur was applied to the generated phosphenes. The size of the phosphenes varied between 0.235° and 0.275° of the field of view. The spacing between two phosphenes varied between 0.55° and 0.825° of the field of view.
3.2 Phosphenic renderings
A different phosphene layout was randomly generated for each subject, in order to simulate the realistic scenario where two people implanted with the same visual neuroprosthesis have different phosphenic perceptions. In this study, we used the Scoreboard rendering as the control condition. We used a second rendering inspired by [5], which is based on both object and structure segmentation. We called it "Combined". We also designed a third rendering mode called "Switch" which allows one to freely change the rendering that is used during the task (Objects only, Structure only, Combined). We detail below the different renderings used in the study.
Scoreboard rendering (control condition)
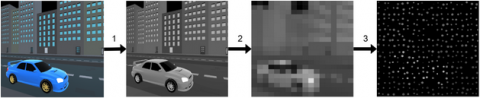
The image is reduced to the resolution of the implant. We then quantize the intensity into four levels of gray. Finally, we transform each rectangular area that now represents a micro-electrode into a phosphene (see Figure 2).
Figure 2. Generation of the Scoreboard rendering (Control)
Combined rendering (objects + structure)
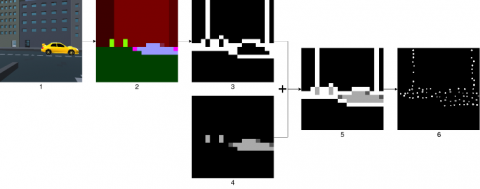
First, we extract an object segmentation map from the input image (Figure 3-2). Then, we extract the edges of the scene structure, and we scale and quantize the image (Figure 3-3). In a parallel thread, we also extract objects and quantize the image (Figure 3-4). We then combined both images into a single image (Figure 3-5). Finally, we transform each rectangular area that now represents a mirco-electrode into a phosphene.
Figure 3. Generation of the Combined rendering (objects + structure)
Switch rendering
The Switch rendering mode allows the subject to change the rendering at will by clicking on a button. In this mode, the available renderings are Combined, Objects and Structure renderings. The Objects rendering is obtained by transforming the semantic image (Figure 3.4) into a phosphenic display. The Structure rendering is obtained by transforming the structure image (Figure 3.3) into a phosphenic display.
We made the hypothesis that the ability to independently switch between renderings in real time would provide a better understanding of outdoor visual images than using a specific rendering.
4.1 Subjects, task and experimental conditions
The subjects were recruited in an engineering school and via social networks (LinkedIn, Facebook). 20 subjects, (11 men and 9 women aged from 17 to 55 years, mean: 25 years, sd: 13 years), participated in the experiment. Each participant had normal or corrected vision.
The three tasks consisted in answering questions related to the presence or absence of three categories of items (objects, streets, doors and crosswalks) in the image.
In this study we included three experimental conditions: (i) “Scoreboard” (control condition), (ii) “Combined” (Objects + Structure), and (iii) “Switch” that allows one to use any renderings (among Objects, Structure and Combined) at will before answering.
4.2 Protocol
The experimental session contained three blocks corresponding to the three experimental conditions. Each block was divided into three parts, including familiarization with the rendering used in the block, the test phase per se, and then a questionnaire.
During the familiarization, subjects were free to watch the image as long as they wanted to answer two questions. In the Switch condition, they can change the rendering at will before answering these two questions. During the test phase, the subject had to answer a series of 15 questions including 5 questions in each task ("objects", "streets", "doors and crosswalks"). Once an answer is validated, users can move on to the next question. The orders of the blocks and tasks were randomized across subjects to limit sequence-related biases.
At the end of each block, subjects were asked subjective assessments about the rendering used in this block, which focused on user experience and perceived usability. There were three assessments for the Scoreboard and Combined conditions, and four for the Switch condition (an additional one related to the relevance of this condition). The assessments were: “I enjoyed using this rendering”, “This rendering is adapted to the task I had to do”, “This rendering provides me with enough information to complete the task”. They were asked to answer these questions on a Likert scale from 1 to 7 (1 meaning not at all in agreement and 7 meaning completely in agreement).
At the end of the session, they were asked to rank the renderings according to their preference.
4.3 Variables and analysis
For each subject, we measured: (i) the validity of each answer (Correct / Incorrect / I don't know), (ii) the response time for each trial, (iii) the score (1-7) for each subjective assessment, and (iv) the rendering preference order. In addition, for the Switch condition, we measured: (i) the rendering selection order, (ii) the usage duration for each rendering, and (iii) the number of rendering changes. To analyze the quantitative results, we performed 2-way ANOVA tests according to the model Condition * Task * Interaction, and then used a Tukey post-hoc test to compare pairs. In the figures, we use 95% confidence intervals.
5.1 Comparison of the three renderings
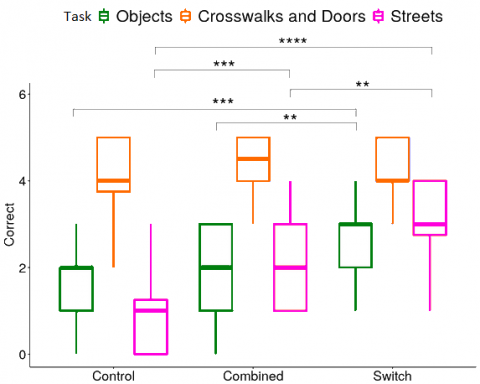
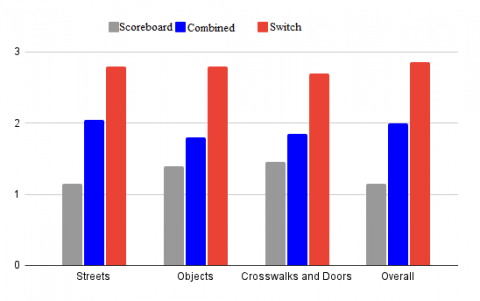
Correct answers: The results of the two-way ANOVA (Condition * Task * Interaction) showed that the number of correct answers is significantly different according to the Rendering (F(2,171) = 15.834; p < 0.0001) and to the Task F(2,171) = 81.730; p < 0.0001). The interaction was also significant (F(4,171) = 5.728; p<0.001), showing that the Switch condition was highly effective in identifying objects, but even more in understanding street layouts. A Tukey post-hoc test confirmed the differences between the three renderings for Streets questions and between the Switch and the two other conditions for Objects questions (see Figure 4).
“I don't know” answers: A two-way ANOVA (Condition * Task * Interaction) showed that the number of "I don't know" answers was significantly different by Rendering (F(2,171) = 10.543; p<0.0001) and by Task F(2,171) = 5.882; p < 0.001). The interaction was not significant (F(4,171) = 1,909; p = 0.111). Tukey's post-hoc test shows that the results are significant between the Control and Switch conditions in the case of the "Objects" task and between the Control and Combined or Switch conditions in the case of the "Streets" task (see Figure 5).
Response time: Since the distribution of response times was not normal, we performed a logarithmic transformation of the data. We performed a two-way ANOVA (Condition * Task * Interaction) on the transformed data which showed that the response time is significantly different according to the Rendering (F(2,891) = 17.245; p < 0.0001) and to the Task F(2,891) = 14.081; p < 0.0001). The interaction was not significant (F(4,891) = 0.465; p= 0.762). A Tukey post-hoc test shows that the results are significantly different between the Control and Switch conditions in the case of the "Objects" task, between the Switch and Combined or Control conditions in the case of the "Doors and Crosswalks" task, and between the Switch and Control conditions in the case of the "Streets" task (see Figure 6).
Figure 4. Average number of correct responses by Rendering and by Task. Detection of crosswalks and doors is equivalent for all conditions. Identification of objects and street patterns is significantly improved with the Switch rendering. (N=20. Bars indicate 95% confidence interval. *=0.05; **=0.01; ***=0.001; ****=0.00001)
Figure 5. Average number of “I don’t know” responses by Rendering and by Task. (N=20. Bars indicate 95% confidence interval. *=0.05; **=0.01; ***=0.001; ****=0.00001)
Figure 6. Average response time by Rendering and by Task. (N=20. Bars indicate 95% confidence interval. *=0.05; **=0.01; ***=0.001; ****=0.00001)
Subjective judgement: A two-factor ANOVA (Rendering * Task * Interaction) shows that the score is significantly different by Rendering (F(2,228) = 11.878; p<0.0001) and by Task (F(3,228) = 5.604; p < 0.001). The interaction is significant too (F(6,228) = 7.537; p < 0.0001). A Tukey post-hoc test shows that the results are significant for all three tasks (see Figure 7). We see that in terms of pleasure of use, the Combined and Switch renderings are significantly better rated than the Control rendering (Scoreboard). We can also see that in terms of difficulty of use, perceived usability and the amount of information presented, the Switch rendering is better rated than the Control rendering. We also notice that the Control and Combined renderings are not perceived with a different level of difficulty. Note that for the question: "I found the ability to switch renderings very useful", we obtain an average score of 6.2 +/- 0.52 (out of 7).
Final Ranking: Subjects were finally asked to rank the renderings in order of preference for each task separately, and overall. In order to generate a preference score, we assigned 3, 2 or 1 points to the rendering according to the preference order. The results show that the average order of preference for the renderings is: Switch, Combined, Scoreboard, regardless of the task (see Figure 8).
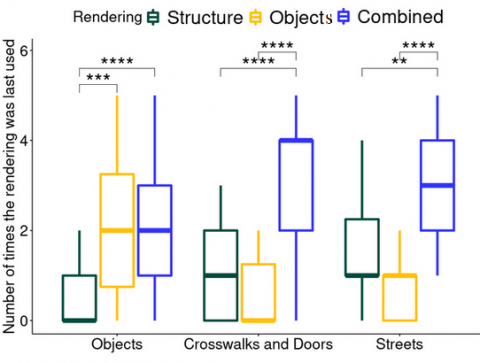
5.2 Behavior observed with the Switch rendering
In the Switch mode, users can choose to freely use one or more renderings among the Objects, Structure, and Combined renderings. For each trial performed by the subjects, we analyzed the number of times each rendering was used, the usage duration of each rendering, and the last rendering used in the task.
Figure 7. Average score given by subjects to the three renderings (Scoreboard, Combined and Switch). The scores are between 1 and 7 (1 meaning strongly disagree and 7 meaning strongly agree). (N=20. Bars indicate 95% confidence interval. *=0.05; **=0.01; ***=0.001; ****=0.00001)
Figure 8. Average final ranking given by users (N=20). Switch rendering is the best ranked on average, regardless of the task performed
Figure 9. Average number of last rendering used in the Switch mode by Task. (N=20 subjects)
Because the distribution of usage durations was not normal, we performed a log transformation of the data. A one-way ANOVA (Task) showed that the usage durations were not significantly different according to the task (F(2,860) = 0.09; p = 0.914). A one-way ANOVA (Task) showed that the number of uses was not significantly different according to the task either (F(2,860) = 1.589; p = 0.205). Interestingly, a one-way ANOVA (Task) showed that the number of times a rendering is used last is significantly different according to the task (F(2,171) = 5.914; p < 0.001; see Figure 9). A Tukey's post-hoc test shows that the results are significant for all three tasks. Figure 9 illustrates the relation between the last rendering used and the task. Independently of the task, the last rendering used is the Combined rendering. For the Objects task, the Object and Combined renderings are used similarly.
Our results show that the detection of crosswalks and doors is easy, regardless of the rendering used. This is not surprising because the rendering of doors is always a white rectangle, and the rendering of crosswalks is a series of rectangles, which are easy to perceive. On the other hand, the identification of objects and the understanding of the street layout strongly depends on the rendering being used.
The results show that the Switch rendering is significantly better than the Control and Combined renderings for identifying both objects and streets. The Combined rendering is not significantly better than the Control rendering for object detection. This is not consistent with the study by Sanchez-Garcia et al. [5]. This difference can be explained by the resolution of the implants used in our simulator (21x18) that is lower than in their study (32x32). Indeed, according to Tan et al. [15], 600 electrodes with a Scoreboard rendering (Control) are sufficient to obtain an already functional perception.
The analysis of the "I don't know" responses shows that there is a significant difference between renderings and tasks. The Control rendering gets more "I don't know" responses than the Switch rendering in the "objects" and "streets" tasks. One subject used this option a lot and answered "I don't know" 14 times for the Scoreboard rendering mode (control), 6 times for the Combined rendering mode and 7 times for the Switch mode. His number of correct answers is 1 for Scoreboard, 6 for the Combined rendering mode and 6 for the Switch mode. Regarding the response times, we obtain significant differences. The Switch rendering is systematically more used in terms of time than the Control rendering whatever the task. It is also more used than the Combined renderer in the "Doors and crosswalks" type tasks. This can be explained by the fact that changing rendering automatically increases response time. On the other hand, as shown by the preference indices, the decision is more reliable and the satisfaction is higher. One could imagine that with training, the decision is made more quickly with the Switch mode. According to the analysis of subjective judgments and ranking of the rendering modes, we highlight that the Switch rendering mode has a clear advantage over the Scoreboard rendering mode in all categories. That said, the Switch rendering mode is not significantly preferred over the Combined rendering mode. On the other hand, the final ranking still shows that the top-ranked rendering mode is Switch over Combined. In the case of Switch, subjects often use the renderings in the order that the buttons are displayed on the screen. Thus, it seems that there is no conscious strategy on which rendering to choose. On the other hand, we observe that the last rendering chosen is significantly related to the task performed. In particular, we observe that the Combined and Objects renderings are more often the last rendering used for object identification. The Combined and Structure renderings are more often the last renderings used to understand the street configuration. This confirms the hypothesis that the appropriate renderings for each task are more usable for making the final decision.
First, we can address the issue of predicting the segmentation and structure images to build the different renderings. In our study, these data are very easy to obtain because the objects of the scene are labelled and the cameras are parameterized to capture only the elements that are relevant (objects for the object camera that changes the texture according to the labels, structure elements for the structure camera). In real conditions, we would have to find another way to recover this information. The addition of neural networks would solve this problem. The prediction of semantic segmentation maps has been widely discussed lately, leading to the birth of neural networks such as EfficientDet [15] or DeepLab [16] which obtain excellent performances. Regarding structure recovery there are also some networks trained to predict this kind of information such as PanoRoom [17]. There are still two problems to manage, the errors in the predictions and the calculation time. It is necessary that the predictions are not too far from reality and that these predictions are produced in quasi-real time. Another limitation is that our study does not allow us to capture the notion of motion since we use static images. The motion information is a very useful information, so much so that some devices use event-based cameras (event cameras) [18] to create a phosphenic rendering. To solve this problem, one could imagine performing the same study using video clips instead. To push the realism to the maximum it could also be interesting to realize an experiment in real condition. The device could be composed of a virtual reality helmet equipped with a camera that films the scene and a calculation box that takes care of calculating the visual rendering. A remote control would allow the subject to change the rendering in real time. This device would be an extension of the first one proposed by Cha in 1992 [19]. The interest to make a study in real conditions is double: on one hand we could propose a complete device of study very close to reality, which would allow the future works to be tested on a realistic model. Moreover, we could measure the reaction of the subjects in navigation tasks and not in perception and comprehension tasks.
[1] Bourne, R.R., Flaxman, S.R., Braithwaite, T., Cicinelli, M.V., Das, A., Jonas, J.B., Zheng, Y. (2017). Magnitude, temporal trends, and projections of the global prevalence of blindness and distance and near vision impairment: A systematic review and meta-analysis. The Lancet Global Health, 5(9): e888-e897. https://doi.org/10.1016/S2214-109X(17)30293-0
[2] Wilson, B.S., Dorman, M.F. (2008). Cochlear implants: Current designs and future possibilities. J Rehabil Res Dev, 45(5): 695-730
[3] Fernandez, E. (2018). Development of visual Neuroprostheses: Trends and challenges. Bioelectronic Medicine, 4(1): 1-8. https://doi.org/10.1186/s42234-018-0013-8
[4] Ratelle, A. (2019). Manuel d’intervention en orientation et mobilité. University Press Montreal, PUM.
[5] Sanchez-Garcia, M., Martinez-Cantin, R., Guerrero, J.J. (2020). Semantic and structural image segmentation for prosthetic vision. Plos One, 15(1): e0227677. https://doi.org/10.1371/journal.pone.0227677
[6] Zhou, D.D., Dorn, J.D., Greenberg, R.J. (2013). The Argus® II retinal prosthesis system: An overview. In 2013 IEEE international conference on multimedia and expo workshops (ICMEW), 1-6. https://doi.org/10.1109/ICMEW.2013.6618428
[7] Palanker, D., Le Mer, Y., Mohand-Said, S., Muqit, M., Sahel, J.A. (2020). Photovoltaic restoration of central vision in atrophic age-related macular degeneration. Ophthalmology, 127(8): 1097-1104. https://doi.org/10.1016/j.ophtha.2020.02.024
[8] Stingl, K., Schippert, R., Bartz-Schmidt, K.U., Besch, D., Cottriall, C.L., Edwards, T.L., Zrenner, E. (2017). Interim results of a multicenter trial with the new electronic subretinal implant alpha AMS in 15 patients blind from inherited retinal degenerations. Frontiers in Neuroscience, 11: 445. https://doi.org/10.3389/fnins.2017.00445
[9] Vergnieux, V., Macé, M.J.M., Jouffrais, C. (2014). Wayfinding with simulated prosthetic vision: Performance comparison with regular and structure-enhanced renderings. In 2014 36th Annual International Conference of the IEEE Engineering in Medicine and Biology Society, pp. 2585-2588. https://doi.org/10.1109/EMBC.2014.6944151
[10] Vergnieux, V., Macé, M.J.M., Jouffrais, C. (2017). Simplification of visual rendering in simulated prosthetic vision facilitates navigation. Artificial Organs, 41(9): 852-861. https://doi.org/10.1111/aor.12868
[11] Li, H., Su, X., Wang, J., Kan, H., Han, T., Zeng, Y., Chai, X. (2018). Image processing strategies based on saliency segmentation for object recognition under simulated prosthetic vision. Artificial intelligence in medicine, 84: 64-78. https://doi.org/10.1016/j.artmed.2017.11.001
[12] Chen, S.C., Suaning, G.J., Morley, J.W., Lovell, N.H. (2009). Simulating prosthetic vision: I. Visual models of phosphenes. Vision Research, 49(12): 1493-1506. https://doi.org/10.1016/j.visres.2009.02.003
[13] Farvardin, M., Afarid, M., Attarzadeh, A., Johari, M.K., Mehryar, M., Nowroozzadeh, M.H., Nami, M. (2018). The Argus-II retinal prosthesis implantation; from the global to local successful experience. Frontiers in Neuroscience, 12: 584. https://doi.org/10.3389/fnins.2018.00584
[14] Denis, G., Jouffrais, C., Mailhes, C., Macé, M.J. (2014). Simulated prosthetic vision: Improving text accessibility with retinal prostheses. In 2014 36th Annual International Conference of the IEEE Engineering in Medicine and Biology Society, pp. 1719-1722. https://doi.org/10.1109/EMBC.2014.6943939
[15] Tan, M., Pang, R., Le, Q.V. (2020). Efficientdet: Scalable and efficient object detection. In Proceedings of the IEEE/CVF Conference on Computer Vision and Pattern Recognition, pp. 10781-10790.
[16] Chen, L.C., Papandreou, G., Kokkinos, I., Murphy, K., Yuille, A.L. (2017). Deeplab: Semantic image segmentation with deep convolutional nets, atrous convolution, and fully connected CRFS. IEEE transactions on pattern analysis and machine intelligence, 40(4): 834-848. https://doi.org/10.1109/TPAMI.2017.2699184
[17] Fernandez-Labrador, C., Facil, J.M., Perez-Yus, A., Demonceaux, C., Guerrero, J.J. (2018). Panoroom: From the sphere to the 3d layout. arXiv preprint arXiv:1808.09879. https://doi.org/10.48550/arXiv.1808.09879
[18] Posch, C., Serrano-Gotarredona, T., Linares-Barranco, B., Delbruck, T. (2014). Retinomorphic event-based vision sensors: Bioinspired cameras with spiking output. Proceedings of the IEEE, 102(10): 1470-1484. https://doi.org/10.1109/JPROC.2014.2346153
[19] Cha, K., Horch, K., Normann, R.A. (1992). Simulation of a phosphene-based visual field: Visual acuity in a pixelized vision system. Annals of Biomedical Engineering, 20(4): 439-449. https://doi.org/10.1007/BF02368135