A. Kokosy | P. Saey | G. Tagne | A. Oukhrid | T. Degallaix | M. Troch | D. De Schuyter | A. Verhoeven
OPEN ACCESS
This article presents a heterogeneous, open and configurable data recording device to facilitate the implementation of clinical trials. It includes an embedded system connected via USB to an Android device, and a database in the Cloud. Using an Android application, it is possible to configure each clinical trial according to the needs of the test protocol and the people involved in the study. This device ensures the recording and storage of data from both the various sensors used and the questionnaires. This original device was used during the implementation of the clinical trials for a powered wheelchair “Obstacle Alerting System”. This system will be mounted on the wheelchairs of the people participating in the clinical trials and used for 14 days in their real life environment.
data collection, heterogeneous data recording, clinical trials, obstacle alerting system, intelligent connected wheelchair, EDUCAT project
When clinically testing a medical device or the effectiveness of a drug treatment in an uncontrolled environment, it is usually necessary to collect data generated by various physical sensors, but also the answers to the various questionnaires used in the study. In addition, an individual configuration of each test is frequently required. The collected heterogeneous data often comes in massive quantities, making the analysis very tedious.
In order to collect and store the data, Cloud solutions can be used. Fu et al. offer a platform based on a Cloud solution, connected only to some internal sensors of a smartphone [1, 2]. However, these platforms are not open, as it is not possible to interface other sensors. Furthermore, the system is not configurable, which limits its use to very specific cases. It is also not possible to integrate data from questionnaires. Kipf et al. [3] offer a platform for data management called Mezuri. It provides protocols for the transfer of data from different sources (e.g. those collected manually from sensors) and their storage in the Cloud. A computer tool based on web technologies is available to analyze, visualize and share the data.
However, this platform does not collect data directly or in real time from sensors or questionnaires. This implies significant pre-processing of these data. More recently, Lin et al. [4] proposed a data acquisition system used in an industrial setting. But it can neither be configured according to the user's needs, nor be used to collect information from questionnaires.
In most cases, questionnaires are still produced in paper format, as the data collected is often sensitive. This makes it extremely difficult to analyze the data, especially when it is necessary to correlate it with information from sensors. Following a study carried out by psychology clinicians among 1700 people using electronic questionnaires programmed by IT experts, the need to develop a generic app for the creation of electronic questionnaires has been demonstrated by Schobel et al. [5]. It is indeed important to provide clinicians with a tool enabling them to create questionnaires in a simple way that can be used on a smartphone or tablet, while respecting the legal criteria for data collection in clinical studies. In addition, the need to collect data from the questionnaires and also from sensors has also been identified.
In order to guarantee an efficient analysis of post-clinical trial data, it is therefore useful to have a single platform for the collection and storage of heterogeneous data. This platform must offer easy interfacing with various sensors that communicate using a variety of communication protocols. It must enable clinicians and researchers to access the data collected in real time or remotely. In this article we propose a data recording system that will provide a solution to the problems identified above.
The article is organized as follows. The first part presents the data recording system, highlighting its open and modular nature (section 2). Then an example of the use of an “Obstacle Alerting System” (OAS) for a wheelchair in the preparation of clinical trials will be described in section 3.
The data recording system offers several functionalities:
2.1 Overview and functionalities of the device
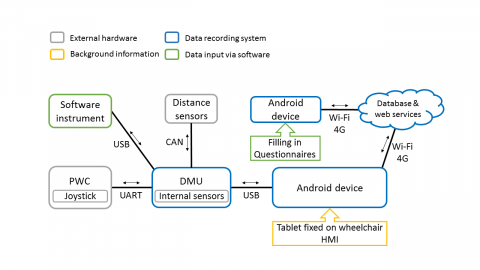
In order to guarantee the identified functionalities, the device is composed of four elements:
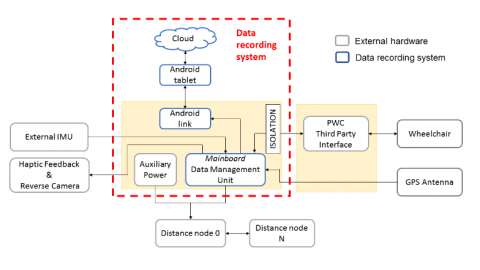
Figure 1 shows an overview of the system. This device is designed around the "Data Management Unit" (DMU) which is the main piece of equipment. It manages the data collection of all sensors. New sensors and/or systems (e.g. via CAN bus, Bluetooth, UART, etc.) can be connected to the in-vehicle system by adding only the driver associated with the new device. The system configuration on the Android tablet allows these sensors or instruments to be integrated via a graphical interface, using the configuration data in the Cloud database. The tablet transports the encrypted measurement data to the database in the Cloud.
Figure 1. Overview of the data recording system
By using this open and configurable heterogeneous data recording system, developers can merge their own sensors, systems, algorithms, etc. with new modules, enabling cost- and time-efficient testing. This system makes it easy to set up clinical trials at different remote sites with different types of users (technicians, doctors, device users, researchers, etc.).
The different questionnaires filled in by users and practitioners during clinical trials can be designed in a user-friendly web interface. These questionnaires can be completed on a smartphone or tablet. All of these operations can be carried out simultaneously on different geographical locations. The data collected from the measurements and questionnaires are stored in a single database in the Cloud, available for further analysis.
The technology used in this device is simple, using microcontrollers and standard Android devices, and does not require a lot of computing power. The aim is to provide a low-cost solution for wide-spread use. The abstraction is done at the database level. System configuration is done on the mobile phone or tablet and then uploaded to the DMU. Once the configuration is checked and saved, the DMU can start collecting the data and send it to the Android device and from there to the Cloud.
The resulting system allows the integration of heterogeneous sensors, the addition of new sensors and actuators, and reconfiguration according to the user's needs. It also allows the simultaneous collection of data from the questionnaires and their storage in the database. In the following paragraphs, we will describe it in more detail by addressing the hardware and some of the software aspects.
2.2 DMU – Hardware
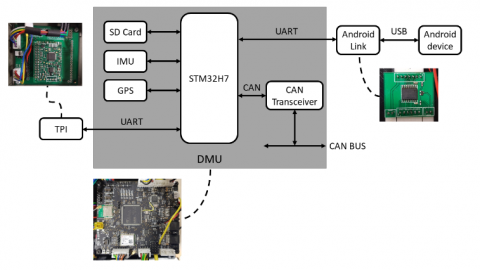
The Data Management Unit (DMU) manages the data collection of all sensors as well as the data from the medical device (in this paper a wheelchair Obstacle Alerting System will be presented). The data is both stored locally on the SD card and sent to the tablet to be stored in the database in the Cloud. The DMU also stores the configuration of the sensors connected to the recording system. The hardware part is designed around the STM 32 microcontroller as shown in Figure 2. This circuit is connected by several inputs/outputs via UART port, CAN port, USB. It is also connected to an SD card, a GPS and an inertial unit (IMU, Inertial Measurement Unit) via the I2C port. The medical device (called TPI in Figure 2) is connected to the DMU via UART.
Figure 2. Data recording system: hardware architecture
An embedded architecture requiring little computing power is used, with the aim of providing a low-cost solution.
2.3 DMU – Software
2.3.1 Configuration
The software is designed with configurability in mind. A configuration represents the state of the system at a given moment, in terms of the associated instruments and therefore the data produced. All hardware or software elements providing data to the DMU are called instruments. The configuration is a structure containing information about a specific configuration in the header, and an instrument list, as described in Figure 3.
In the program written in C, the instrument list is a table of instrument structures:
The configuration is set up using the tablet. Once finalized, it is sent to the DMU via the tablet's communication protocol for local storage on the SD card.
Figure 3. Configuration structure
2.3.2 Software architecture
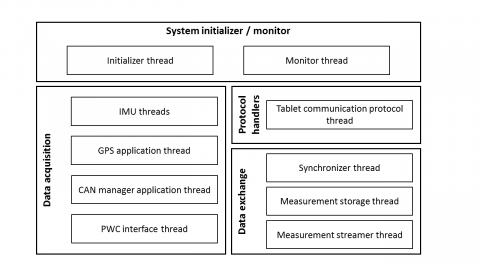
The software is structured in 4 main modules, each comprising one or more "threads", as shown in Figure 4.
Figure 4. DMU software modules
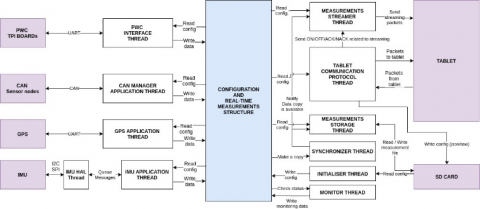
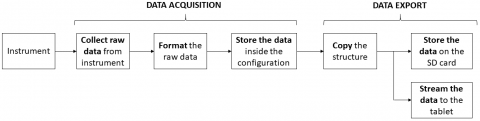
The general software architecture of the recording system is shown in Figure 5. The data flow is described in Figure 6. The data is first collected from each instrument using their specific "thread", and then exported to be stored in both the SD card and the database in the Cloud.
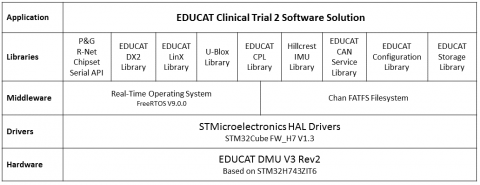
The software is generated by STM32CubeMX, a tool provided by STMicroelectronics. It runs on an STM32H743ZIT6. FreeRTOS V9.0.0 is used. The different software layers are described in Figure 7. All the libraries marked with the "EDUCAT" label have been specially developed within the project.
Figure 5. Data recording system: software architecture
Figure 6. Data flow
Figure 7. Software layers in the DMU
2.4 Tablet and android application
The tablet receives data from the DMU via USB. This data is sent to the Cloud via its Internet connection (Wi-Fi or 4G) by means of an application developed for this purpose: the EDUCAT App (start-up screen is in Figure 8, left).
Figure 8. Screenshots of the EDUCAT App
The EDUCAT App allows at start-up to configure the device and transmit this configuration to the DMU. A configuration contains all the necessary information to automatically program data collection with specific sensors for a measurement. The configuration menu allows to:
A user can create a new configuration by using the "New Configuration" option in the configuration menu. The application will request a name, hardware ID, version and company ID for the new configuration. Once the user has entered all the details, the application will send a request to the database to create a new configuration.
The created configuration opens in a new screen (Figure 8, center). This interface is a graphical representation of the study object used in clinical trials, allowing the instruments to be placed and configured. For each instrument, it is possible to configure its data acquisition frequency, its unit of measurement, its physical position, its identifier, etc. It is also possible to configure the time slots for automatic data recording. In this article the object of study is a wheelchair on which an Obstacle Alerting System will be mounted; Fig. 8 right shows part of the configuration. However, it is also possible to imagine that in a clinical study of a new drug, sensors have to be placed on the person in order to measure its effects. In this case, the object of the study is the person. During the tests the data from the instruments can be displayed in real time as graphs or as values in the HMI of the tablet available via EDUCAT App. In addition, the application also allows the user to fill in the questionnaires necessary for the study. The Android application gives access to the different functionalities of the device according to the user's login profile. For the moment three profiles have been identified: researcher, clinician, (end-)user of the device.
2.5 Web service and questionnaires
The heterogeneous data management system not only allows the recording of sensor data, but also the editing and completion of questionnaires. A Web service allows the persons in charge of the clinical trials to easily create the questionnaires. These questionnaires (format and order of the questions) are saved in the database in the form of SQL commands, which are then interpreted by the EDUCAT App. The questionnaires are presented on the screen so that they can be used by the trial participants, in their own language. These questionnaires (e.g. questions on health status, taking medication, use of medical equipment) will be offered to the participants of the clinical trial at the set frequency and the results will be synchronised with all other recorded data.
Within the EDUCAT project (www.educat2seas.eu), an Obstacle Alerting System (OAS) for electric wheelchairs will be clinically tested. These tests will be carried out over 14 days in the real life environment of participants with electric wheelchairs with a Dynamic Control (DX2 or LiNX) or Penny and Giles (R-Net) type joystick. The system detects obstacles around the wheelchair using infrared and ultrasound sensors and alerts the user about their location and dangerousness. The alert can be visual, audible or haptic. The user has the option of activating or deactivating the sensors at his/her own choice in real time. The number of sensors connected to each chair will depend on its dimensions. All the data collected will be stored in the database. In order to enrich the study, the participants will have to answer a questionnaire three times a day. In addition, additional questionnaires, pre- and post-trial, will also be used. All this data will be analysed to assess whether the proposed Obstacle Alerting System could offer a better quality of life to people with reduced mobility. It is easy to see that in order to carry out these clinical trials, it is essential to use a system that can be configured according to the person's wheelchair and the number of sensors used. In addition, the person must be offered an HMI that will allow him or her to change in real time the feedback he or she wishes to have for the alert. In addition, in order to make it easier to fill in the daily questionnaire (morning, noon, evening) in time, a reminder function has been created. It thus ensures the collection of rich and homogeneous information. In order to meet all these requirements, the data recording system described in section II was used.
3.1 Material part
The Obstacle Alerting System has the following instruments: wheelchair joystick, GPS, IMU and distance sensors, as well as a software instrument in the tablet (see Figures 3 and 9). This system is integrated into the data management system described above. It consists of the following components:
Figure 9. General diagram of the Obstacle Alerting System
3.2 Software part and user feedback
The different software layers of this application are described in Figure 7. The application is based upon the previously developed layers.
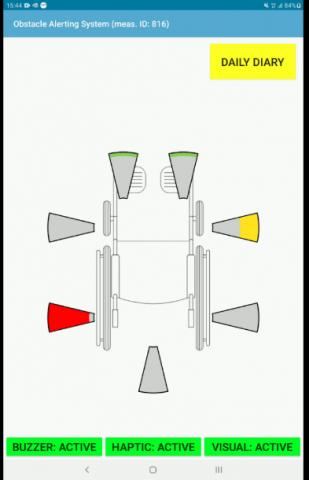
The algorithm and visual feedback are programmed in the Android EDUCAT App. The Obstacle Alerting System is seen by the data recording device as a software instrument. Figure 10 shows a screenshot of the Obstacle Alerting Application.
Figure 10. Visual feedback of the Obstacle Alerting System
In addition, the EDUCAT App allows the data of each sensor to be visualized on a real-time graph. For the clinical trials of the Obstacle Alerting System, three different profiles have been created: researchers (full access), clinicians (access to editing and filling in questionnaires, configuration of the system during installation, display of data in real time) and users (access to the OAS interface and the daily questionnaire).
Finally, the preparation of clinical trials of the OAS for electric wheelchairs illustrates the added value of the data management system, presented in section II. The trials, already carried out with student volunteers, have shown the effectiveness of the device and the ease of data analysis; a video of the trials can be found in this link. The protocol for the clinical trials has just been approved by the Central Research Ethics Committee in Cambridge, United Kingdom (ref. 20/EE/0007). The trials will start shortly with around 20 of people.
In this article, we presented an open and configurable device for recording data from both sensors and questionnaires. The simultaneous storage of all these data in the database facilitates their analysis. This device is composed of an embedded system, called a data management unit, an Android tablet, a database in the Cloud and an Android application. The hardware architecture of the embedded board allows the connection of sensors using standard communication protocols. Data is collected, encrypted and sent to the database via a tablet.
An example of the use of this device to perform clinical trials of an Obstacle Alerting System has been illustrated. The OAS detects obstacles around the wheelchair and alerts the driver to the proximity of the obstacles, depending on the wheelchair’s speed. The feedback can be visual, audible or haptic. The Android application provides access to the device's various functions depending on the user's profile.
The first trials have demonstrated the ease of use and effectiveness of the device. It is being tested on a larger population and during longer test periods, in clinical trials started in September 2020 in the UK.
Frederic Depuydt, Jos De Brabanter (both at KU Leuven during the project’s main development period, F. Depuydt is now with ArcelorMittal Gent), for development and advices. Alexis Clemente (at Junia, now with Technicentre of Hellemmes, SNCF), for development. This work was funded by the Interreg Va 2 Seas project 2S01-032 EDUCAT (www.educat2seas.eu).
[1] Fu, J., Hao, W., White, T., Yan, Y., Jones, M., Jan, Y. K. (2013). Capturing and analyzing wheelchair maneuvering patterns with mobile cloud computing. 2013 35th Annual International Conference of the IEEE Engineering in Medicine and Biology Society (EMBC), Osaka, pp. 2419-2422. https://doi.org/10.1109/EMBC.2013.6610027
[2] Fu, J., Jones, M., Liu, T., Hao, W., Yan, Y., Qian, G., Jan, Y.K. (2016). A novel mobile-cloud system for capturing and analyzing wheelchair maneuvering data: A pilot study. Assistive Technology, 28(2): 105-114. https://doi.org/10.1080/10400435.2015.1095810
[3] Kipf, A., Brunette, W., Kellerstrass, J., Podolsky, M., Rosa, J., Sundt, M., Thomas, E. (2016). A proposed integrated data collection, analysis and sharing platform for impact evaluation. Development Engineering, 1: 36-44. https://doi.org/10.1016/j.deveng.2015.12.002
[4] Lin, H., Zhang, Z., Guo, Y., Ding, Z. (2018). A Configurable Data Acquisition System for Various Working Conditions. 2018 25th International Conference on Mechatronics and Machine Vision in Practice (M2VIP), Stuttgart, pp. 1-5. https://doi.org/10.1109/M2VIP.2018.8600879
[5] Schobel, J., Pryss, R., Reichert, M. (2015). Using smart mobile devices for collecting structured data in clinical trials: Results from a large-scale case study. 2015 IEEE 28th International Symposium on Computer-Based Medical Systems, Sao Carlos, pp. 13-18. https://doi.org/10.1109/CBMS.2015.69