Badis Bakri* | Hani Benguesmia | Ahmed Ketata | Slah Driss | Zied Driss
OPEN ACCESS
In this work, the unsteady turbulent flow in a new solar air heater test bench, developed in our LASEM laboratory, was predicted. The considered system consists of two passages solar air heater separated by an absorber and powered by a fan working in a delivery mode, placed in the hole inlet side the insulation. On this system, a glass is hanging on the front side and an absorber is inserted inside. On the glass side, it is connected to the box prototype through a pipe. The hot air flow is routed towards the box prototype. Two circular holes, are located in the same face of the box prototype. The inlet hole allows the hot air supply. However, the outlet hole allows its escape into the ambient environment. By using the ANSYS Fluent 17.0 software, the Navier-Stokes equations coupled with the standard k-ω turbulence model were resolved. The numerical results were compared with our experimental data, established in the second passage of the solar air heater test bench. The good agreement confirms the validity of the numerical method. The range of temperatures is very useful in many applications such as industrial and domestic applications.
Solar air heater, test bench, tows passages, box prototype, aerodynamic structure
Solar energy refers to all the techniques where solar air heat can be used on site. It is directly related to building techniques that save energy for heating, cooling, and lighting. The objective is to minimize energy consummation with the use of renewable energy [1-3]. In this context, Abdulmunem et al. [1] evaluated and compared the overall thermal performance of flat plate solar air heater. The results show that the latent storage heat material for paraffin wax as a PCM gives better thermal performance than sensible storage heat material in the solar air heater. Altaa et al. [2] compared three different types of designed flat-plate solar air heaters, two having fins and the other without fins. One of the heater with a fin had single glass cover and the others had double glass covers. Based on the energy output rates, heater with double glass covers and fins is more effective and the difference between the input and output air temperature is higher than of the others. Zukowski [3] presented a novel construction of a forced air solar heater based on a confined single slot jet of air impinging on the flat surface of an absorber plate. The results of experimental research confirmed that the efficiency of energy conversion ranged from 66% up to 90%. El-Sebaii et al. [4] developed a comparison between the measured outlet temperatures of flowing air, temperature of the absorber plate and output power of the double pass-finned and v-corrugated plate solar air heaters. The results indicated that the double pass v-corrugated plate solar air heater is 9.3-11.9% more efficient compared to the double pass-finned plate solar air heater. Wazed et al. [5] confirmed that the fabricated solar air heater is working efficiently. The maximum room temperature and the temperature difference from ambient are 45.5℃ and 12.25℃ for forced circulation and 41.75℃ and 8.5℃ for natural circulation respectively. Sopian et al. [6] confirmed that the addition of the porous media in the second channel of the double-pass solar collector increases the performance of the collector. The experimental validation confirmed that the theoretical simulation and experimental data are in close agreement with each other. The efficiency of the double pass solar collector with porous media is about 60-70%. Esen [7] presented an energy analysis for a novel flat plate solar air heater (SAH) with several obstacles and without obstacles. The analysis of the results confirmed that the optimal value of the efficiency is middle level of absorbing plate in flow channel duct for all operating conditions. The double-flow collector supplied with obstacles appears significantly better than that without obstacles. The results showed that the largest irreversibility is occurring at the flat plate collector and without obstacles in which collector efficiency is smallest. Ozgen et al. [8] experimentally investigated a device for inserting an absorbing plate made of aluminum cans into the double-pass channel in a flat-plate Solar Air Heater (SAH). Three different absorber plates had been designed and tested for experimental study. The highest efficiency had been obtained for an air mass flow rates of 0.05 kg/s. Teodosiu et al. [9] presented experimental and numerical comparisons to give the precision of a CFD model. Du et al. [10] conducted experimental results measurements to present the characteristics of a Chinese house. Homod [11] studied and proposed a new system by coupling reasons of internal conditions that are influenced by the outdoor environment. Terrados and Moreno [12] integrated the architectural concepts with energy efficient. Yasa [13] analyzed the inside regions and the surrounding areas of education buildings and performed the microclimatic comfort. Premrov et al. [14] studied a single storey house wood frame case for objective to avoid the last energy. Johnston et al. [15] predicted and measured performance of the building fabric in new build dwellings. Chan [16] modeled a building of 21 floors by using Energy plus. The results of simulations indicated that the apartments flat presents satisfactory periods for the environment. Ibrahim et al. [17] planned technical coating projection. The proposed mathematical model was compared with experimental results. Nam and Chae [18] developed an optimal design of the grounding by using a numerical method. Alam et al. [19] developed an alternative way of releasing heat of building to reduce energy demand of building in tropical environment. Rode [20] illustrated global relations to highlight the building performance. Han et al. [21] investigated hybrid solar energy system. A general view of the architectural envelope designs and innovative system was presented. Watson [22] reviewed design quality research on buildings in relation to users. Sailor et al. [23] studied the mechanisms that lead to building energy use implications of green roof design decisions. Focusing on these anterior studies, it has been noted that the most published works focusing on the developing of the solar system to improve the heat ventilation and to minimize the energy consumption. For this purpose, we are interested on the prediction of the unsteady turbulent flow in a solar air heater test bench with two passages. The comparison of the numerical results with our experimental data presented a good agreement.
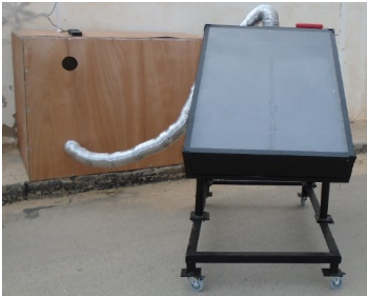
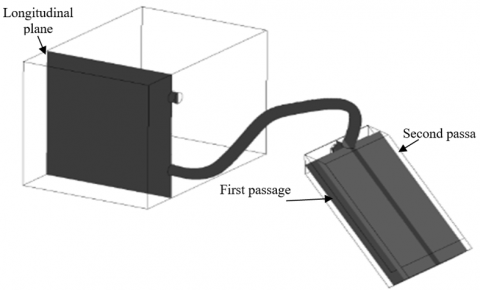
Figure 1 shows the experimental device consisting of a new solar air heater test bench designed and realized in our LASEM laboratory. The solar system consists of two passages solar air heater separated by an absorber and powered by a fan working in a delivery mode and placed in the inlet, side the insulation. On the glass side, it is connected to the box prototype through a pipe. The geometrical arrangements of the computational domain are presented in Figure 2. It is composed of two domains separated by a circular pipe with a diameter d=100 mm. The first one is the solar air heater with a height hs=194 mm and a width Ws=778mm. On this system, a glass is hanging on the front side with a length Lg=1000 mm and an absorber is inserted inside with a length La=1086 mm. The hot air flow is routed towards the box prototype with a length Lb=1500 mm, a height Hb=1100 mm and a width Wb=1000 mm. Two circular holes, with a distance h2=900 mm, are located in the same face of the box prototype. The inlet holes, placed in the altitude h1=250 mm and a longitude L1=300 mm, allows the hot air supply. However, the outlet hole allows its escape in the ambient environment.
Figure 1. Solar air heater test bench
Figure 2. Geometrical arrangements
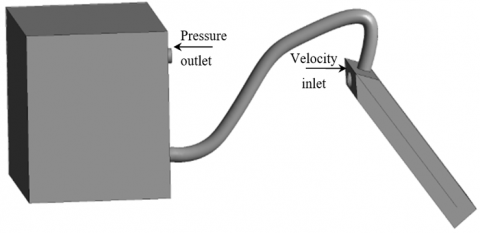
A boundary condition is required anywhere fluid enters or exits the system and can be set as a pressure inlet, mass flow inlet, interior, internal or interface. General interpretation was given on the basis of numerical simulation of the solar air heater. A physical model was simulated using ANSYS Fluent 17.0, based on the geometrical dimensions of the solar air heater. The boundary conditions are illustrated in Figure 3. Wall boundary was applied for the solar air heater with heat flux of value equal zero to obtain the adiabatic wall. Convective heat transfer option was applied for different parts of the device such as glass and absorber. For the inlet velocity, it has been taken a magnitude velocity equal to V=3 m.s-1. For the outlet pressure, a value of p=101325 Pa is set. This means that at this opening, the fluid exits the model to an area of static atmospheric pressure condition. Using the solar calculator of the discrete ordinates (DO), we have defined all the considered parameters of the radiation model with fair weather conditions. For the global position, we have introduced the longitude, the latitude and the time zone. For the date and time, we have indicated the day, the month, the hour, and the minute. Also, we have specified the north and the east of the mesh orientation. In our test bench, the lateral surfaces of the solar air heater system and the box prototype were fabricated by the wood with a conductivity equal to λ=0.1 W.m-1. K-1 [29]. By considering it adequate for thermal insulation, we have used adiabatic wall in our simulation.
Figure 3. Boundary conditions
The goal of this section is to demonstrate various meshing capabilities allowing us to better adjust the computational mesh to the problem at hand.
The mesh of geometry constitutes the longest and most determining part of a digital project. It is estimated that this stage represents approximately 60% of the time devoted to the project.
Defining the characteristics of the mesh is therefore an important step in a digital project since it conditions the calculation time, convergence and precision on the quantities calculated during the simulation.
The automatically generated mesh is usually appropriate and intricate problems with thin and small. Geometrical and physical features can result in extremely high number of cells, for which the computer memory is too small. Meshing options allow us to manually adjust the computational mesh to the solved problems features to resolve them better. In this application, we have adopted a refined model consisting of a maximum number of cells equal to N=1578369 cells. This meshing gives the lower numerical diffusion inside the solar air heater with an unstructured and tetrahedral meshing as presented in Figure 4.
Figure 4. Meshing of the computational domain
The distribution of the velocity fields, the temperature, the DO irradiation, the total pressure, the turbulent kinetic energy, the specific turbulent dissipation rate and the turbulent viscosity are presented in different visualization planes as presented in Figure 5. In our case, the Reynolds number is evaluated to be equal to Re=20000.
Figure 5. Visualization planes
5.1 Velocity fields
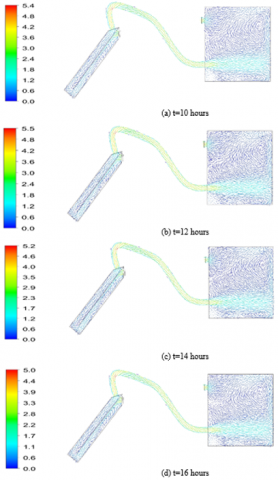
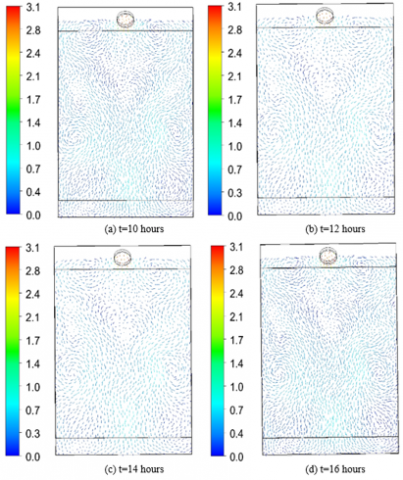
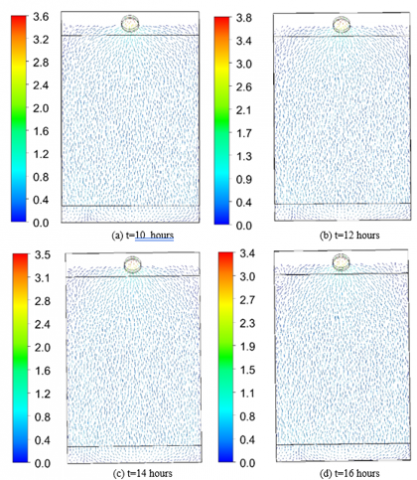
Figures 6, 7 and 8 show the velocity fields distribution in the different longitudinal and transverse planes for the first and second passages of the solar air heater supplying the box prototype and at t=10 hours, t=12 hours, t=14 hours and t=16 hours. According to these results, it is clear that the velocity fields present the same distribution at the different considered instances. For example, at t=12 hours the inlet velocity is governed by the boundary condition defined by V=3 m.s-1. In the first passage, a decrease in the flow has been observed and a recirculation zone was created. This phenomenon is more prominent during the transition of the flow to the second passage. In this side, the flow becomes uniform until the exit of the solar air heater. Indeed, the velocity reaches a very important value equal to V=5 m.s-1. Via the pipe separating the solar air heater from the box prototype, a discharge area appears in the hole inlet and invaded the reverse wall. At this level, the velocity changes his direction and two axial flows have been observed. The first ascending flow is responsible on the recirculation zone appeared in the whole area of the box prototype. This movement continues until the exit of the air flow through the hole outlet and reaches the maximum value equal to V=4 m.s-1. The second descending flow is due to the dead zone appeared in the down area. Globally, the averaged velocity value is about V=1.5 m.s-1 in the discharge area. Elsewhere, the averaged velocity presents a very low value. By comparing the velocity fields for the different instances, it is clear that the maximum value of the average velocity is obtained at t=12 hours. For the other instances, the magnitude velocity decreases and the minimum values are obtained at t=16 hours.
Figure 6. Distribution of the velocity field in the longitudinal plane
Figure 7. Distribution of the velocity field in the first passage
Figure 8. Distribution of the velocity field in the second passage
5.2 Temperature
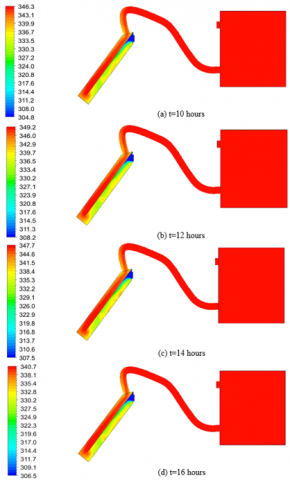
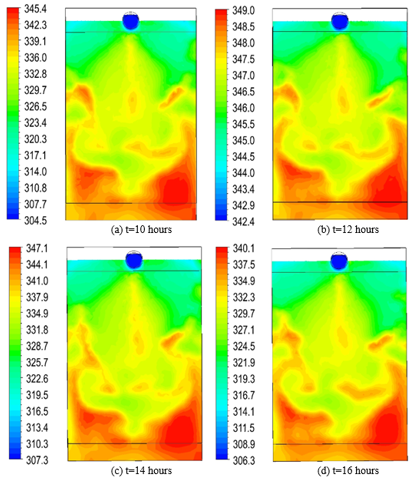
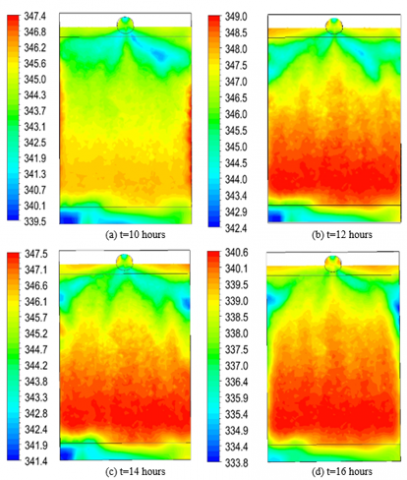
Figures 9, 10 and 11 show the distribution of the temperature in the different longitudinal and transverse planes for the first and second passages of the solar air heater supplying the box prototype and at t=10 hours, t=12 hours, t=14 hours and t=16 hours. According to these results, it is clear that the temperature presents the same distribution at the different considered instances. For example, at t=12 hours it has been noted that the inlet temperature is governed by the boundary condition defined by T=308 K. This value increases immensely and reaches an average value equal to T=338 K in the first passage and T=347 K in the second passage. This fact can be explained by the air flow incoming at ambient temperature and flowing the channel between the absorber plane and the insulation, which start swarming up by the convection with the absorber. In the second passage, the temperature of the air flow is more important since the flowing between the glass and the absorber is affected by the solar radiations. Thereby, the box prototype is powered by a continuous air heater characterized by the maximum temperature value equal to T=349 K. By comparing the temperature for the different instances, it is clear that the maximum value of the temperature is obtained at t=12 hours. For the other instances, the temperature decreases and the minimum values are obtained at t=16 hours. At this instance, the maximum value of the temperature is equal to T=340 K.
Figure 9. Distribution of the temperature in the longitudinal plane
Figure 10. Distribution of the temperature in the first passage
Figure 11. Distribution of the temperature in the second passage
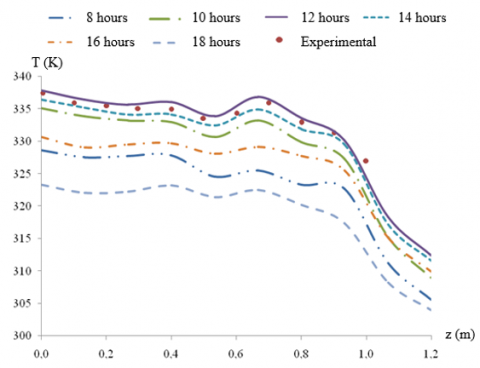
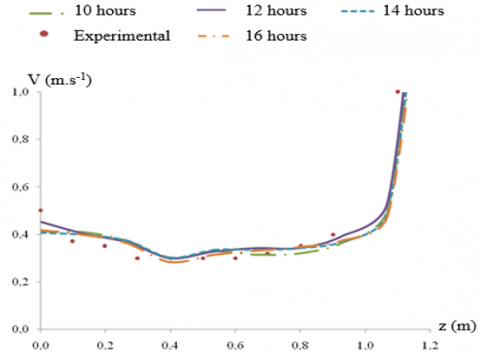
Figures 12 and 13 compare the numerical results of the temperature and velocity profiles in the second channel superposed with our experimental results in a fan delivery mode side the insulation. Different instances equal to t=8 hours, t=10 hours, t=12 hours, t=14 hours, t=16 hours and t=18 hours have been considered. According to these results, a similar appearance between the curves has been observed for the magnitude velocity with a small difference between the calculated values. However, this difference is clearer for the temperature profiles. In fact, in these conditions, the maximum values of the temperature is obtained at t=12 hours. By comparing these obtained results, it has been observed that the temperature values decrease slightly at t=14 hours. However, the minimum values of the temperature is obtained at t=18 hours. For the other instances t=10 hours, t=16 hours and t=8 hours, the temperature values decrease immensely. The comparison of the numerical results with our experimental data picked up on 28 August at t=12 hours, presents a good agreement with a gap equal to 6%. These results confirm the validity of our numerical method.
Figure 12. Profile of the temperature in the second channel
Figure 13. Profile of the magnitude velocity in the second channel
Figure 14 presents the profile of the energy efficiency which confirms the results obtained over the time. In fact, at the beginning of the day, the energy efficiency has very low values. With the increase of the temperature through the day, there is a gradual increase of the energy efficiency until t=12 hours, with a value equal to η= 31.8%. In the first half day, it has been noted that the increase of the energy efficiency is more important after t=10 hours. Afternoon, the energy efficiency starts to decrease with a constant slope. At t=18 hours, the energy efficiency is very low and it is equal to η= 24.8%.
For the SAH test bench, the energy efficiency is written as follows:
$\eta=\frac{\dot{\mathrm{m}} \mathrm{C}_{\mathrm{p}}\left(\mathrm{T}_{\mathrm{out}}-\mathrm{T}_{\mathrm{in}}\right)}{\mathrm{I} \mathrm{A}}$ (1)
where:
$\dot{\mathrm{m}}$: Mass flow rate (kg.s-1),
Cp: Specific heat capacity of the air at constant pressure (J.kg1.K-1),
Tout: Outlet temperature (K),
Tin: Inlet temperature (K),
I: Solar radiation (W.m-2),
A: Area of the SAH (m2).
Figure 14. Energy efficiency profile
Since the solar air heater is not very common used in the domestic and industrial applications, we are interested on the design and the realization of a new solar air heater test bench to investigate the efficiency of the solar system. The considered test bench consists of two passages solar air heater separated by an absorber and powered by a fan working in a delivery mode and placed in the inlet, side the insulation. On the glass side, it is connected to the box prototype through a pipe. On this system, a glass is hanging on the front side and an absorber is inserted inside. The hot air flow is routed towards the box prototype. Two circular holes, are located in the same face of the box prototype. The inlet holes, allows the hot air supply. However, the outlet hole allows its escape into the ambient environment. Indeed, we have developed numerical simulations to study the turbulent flow in the considered test bench over the day. In these conditions, it has been observed a decrease in the flow and an appearance of the recirculation zones in the first passage. This phenomenon is more prominent during the transition of the flow to the second passage. However, the flow becomes uniform until the exit of the solar air heater. Via the pipe separating the solar air heater from the box prototype, a discharge area appears in the hole inlet and invaded the reverse wall. By comparing the local characteristics for the different instances, a similar appearance has been observed with a maximum value at t=12 hours. For the magnitude velocity, a small difference between the calculated values has been noted. However, this difference is clearer for the temperature distribution. For the energy efficiency, it presents very low values at the beginning of the day. With the increase of the temperature through the day, there is a gradual increase of the energy efficiency until t=12 hours, with a value equal to η=31.8%. This technology will be very useful since it can provide sustainable energy and substitute the expensive traditional technologies.
[1] Abdulmunem, A.R., Abed, A.H., Hussien, H.A., Samin, P.M., Rahman, H.A. (2019). Improving the performance of solar air heater using high thermal storage materials. Annales de Chimie - Science des Matériaux, 43(6): 389-394. https://doi.org/10.18280/acsm.430605
[2] Altaa, D., Bilgilib, E., Ertekina, C., Yaldiza, O. (2010). Experimental investigation of three different solar air heaters: Energy and exergy analyses. Applied Energy, 87(10): 2953-2973. https://doi.org/10.1016/j.apenergy.2010.04.016
[3] Zukowski, M. (2015). Experimental investigations of thermal and flow characteristics of a novel microjet air solar heater. Applied Energy, 142: 10-20. https://doi.org/10.1016/j.apenergy.2014.12.052
[4] El-Sebaii, A.A., Aboul-Enein, S., Ramadan, M.R.I., Shalaby, S.M., Moharram, B.M. (2011). Thermal performance investigation of double pass-finned plate solar air heater. Applied Energy, 88(5): 1727-1739. https://doi.org/10.1016/j.apenergy.2010.11.017
[5] Wazed, M.A., Nukman, Y., Islam, M.T. (2010). Design and fabrication of a cost effective solar air heater for Bangladesh. Applied Energy, 87(10): 3030-3036. https://doi.org/10.1016/j.apenergy.2010.02.014
[6] Sopian, K., Alghoul, M.A., Ebrahim, M.A., Sulaiman, M.Y., Musa, E.A. (2009). Evaluation of thermal efficiency of double-pass solar collector with porous- nonporous media. Renewable Energy, 34(3): 640-645. https://doi.org/10.1016/j.renene.2008.05.027
[7] Esen, H. (2008). Experimental energy and exergy analysis of a double-flow solar air heater having different obstacles on absorber plates. Building and Environment, 43(6): 1046-1054. https://doi.org/10.1016/j.buildenv.2007.02.016
[8] Ozgen, F., Esen, M., Esen, H. (2009). Experimental investigation of thermal performance of a double-flow solar air heater having aluminum cans. Renewable Energy, 34(11): 2391-2398. https://doi.org/10.1016/j.renene.2009.03.029
[9] Teodosiu, C., Kuznik, F., Teodosiu, R. (2014). CFD modeling of buoyancy driven cavities with internal heat source-Application to heated rooms. Energy and Buildings, 68: 403-411. https://doi.org/10.1016/j.enbuild.2013.09.041
[10] Du, X.Y., Bokel, R., Dobbelsteen, A.V.D. (2014). Building microclimate and summer thermal comfort in free-running buildings with diverse spaces: A Chinese vernacular house case. Building and Environment, 82: 215-227. https://doi.org/10.1016/j.buildenv.2014.08.022
[11] Homod, R.Z. (2014). Assessment regarding energy saving and decoupling for different AHU (air handling unit) and control strategies in the hot-humid climatic region of Iraq. Energy, 74: 762-774. https://doi.org/10.1016/j.energy.2014.07.047
[12] Terrados, F.J., Moreno, D. (2014). “Patio” and “Botijo”: Energetic strategies’ architectural integration in “Patio 2.12” prototype. Energy and Buildings, 83: 70-88. https://doi.org/10.1016/j.enbuild.2014.03.081
[13] Yasa, E. (2016). Microclimatic comfort measurements evaluation of building physics: The effect of building form and building settled area, on pedestrian level comfort around buildings. Journal of Building Physics, 40(5): 472-500. https://doi.org/10.1177/1744259115621979
[14] Premrov, M., Leskovar, V.Z., Mihalic, K. (2016). Influence of the building shape on the energy performance of timber-glass buildings in different climatic conditions. Energy, 108: 201-211. https://doi.org/10.1016/j.energy.2015.05.027
[15] Johnston, D., Miles-Shenton, D., Farmer, D. (2015). Quantifying the domestic building fabric ‘performance gap’. Building Services Engineering Research and Technology, 36(5): 614-627. https://doi.org/10.1177/0143624415570344
[16] Chan, A.L.S. (2015). Investigation on the appropriate floor level of residential building for installing balcony, from a view point of energy and environmental performance. A case study in subtropical Hong Kong. Energy, 85: 620-634. https://doi.org/10.1016/j.energy.2015.04.001
[17] Ibrahim, M., Wurtz, E., Biwole, P.H., Achard, P. (2014). Transferring the south solar energy to the north facade through embedded water pipes. Energy, 78: 834-845. https://doi.org/10.1016/j.energy.2014.10.078
[18] Nam, Y., Chae, H.B. (2014). Numerical simulation for the optimum design of ground source heat pump system using building foundation as horizontal heat exchanger. Energy, 73: 933-942. https://doi.org/10.1016/j.energy.2014.06.108
[19] Alam, M.R., Zain, M.F.M., Kaish, A.B.M.A., Jamil, M. (2013). Underground soil and thermal conductivity materials based heat reduction for energy-efficient building in tropical environment. Indoor and Built Environment, 24(2): 185-200. https://doi.org/10.1177/1420326X13507591
[20] Rode, C. (2012). Global building physics. Journal of Building Physics, 36(4): 337-352. https://doi.org/10.1177/1744259112462107
[21] Han, H.J., Jeon, Y.I., Lim, S.H., Kim, W.W., Chen, K. (2010). New developments in illumination heating and cooling technologies for energy-efficient buildings. Energy, 35(6): 2647-2653. https://doi.org/10.1016/j.energy.2009.05.020
[22] Watson, K.J., Evans, J., Karvonen, A., Whitley, T. (2014). Re-conceiving building design quality: A review of building users in their social context. Indoor and Built Environment, 25(3): 509-523. https://doi.org/10.1177/1420326X14557550
[23] Sailor, D.J., Elley, T.B., Gibson, M. (2011). Exploring the building energy impacts of green roof design decisions - A modeling study of buildings in four distinct climates. Journal of Building Physics, 35(4): 372-391. https://doi.org/10.1177/1744259111420076
[24] Driss, Z., Mlayeh, O., Driss, D., Maaloul, M., Abid, M.S. (2014). Numerical simulation and experimental validation of the turbulent flow around a small incurved Savonius wind rotor. Energy, 74: 506-517. https://doi.org/10.1016/j.energy.2014.07.016
[25] Driss, Z., Mlayah, O., Driss, S., Driss, D., Maaloul, M., Abid, M.S. (2015). Study of the bucket design effect on the turbulent flow around unconventional Savonius wind rotors. Energy, 89: 708-729. https://doi.org/10.1016/j.energy.2015.06.023
[26] Driss, Z., Mlayah, O., Driss, S., Maaloul, M., Abid, M.S. (2016). Study of the incidence angle effect on the aerodynamic structure characteristics of an incurved Savonius wind rotor placed in a wind tunnel. Energy, 113: 894-908. https://doi.org/10.1016/j.energy.2016.07.112
[27] ANSYS Fluent Theory Guide. (2016). ANSYS, Inc., Southpointe 2600, ANSYS Drive Canonsburg, PA 15317.
[28] Tiwari, G.N., Sahota, L. (2017). Advanced Solar-Distillation Systems: Basic Principles, Thermal Modeling, and Its Application. Springer.
[29] Prałat, K. (2015). Research on thermal conductivity of the wood and analysis of results obtained by the hot wire method. Experimental Techniques, 40: 973-980. https://doi.org/10.1007/s40799-016-0096-7