P Srikanth | P. Kalyani | Lalit Kumar Sagar | P S Ramapraba | V.Sudha | G.Sujatha | Jonnadula Narasimharao | Lakshmi Tulasi Ravulapalli
© 2025 The authors. This article is published by IIETA and is licensed under the CC BY 4.0 license (http://creativecommons.org/licenses/by/4.0/).
OPEN ACCESS
The Infrastructure less mobile ad hoc network is known as MANET and all MANET environment networks are having Good Sensor Nodes (GSN) initially and they become Bad Sensor Nodes (GSN) due to internal and external attacks. Therefore, the MANET environment networks have both types of GSN and BSN. These BSN are categorized into Malicious Sensor Nodes (MSN) and Residual Sensor Nodes (RSN). The formation of these MSN and RSN may degrade the performance efficiency of the entire MANET environment network. Therefore, it is necessary to detect and mitigate these BSN from the network. In this work, GSN and BSN are classified using the proposed CNN structure. This proposed system consists of feature computations, feature optimization through Ant Colony Optimization (ACO) Algorithm and the optimized features are classified through the proposed CNN structure. The performance of the proposed MANET system is analyzed using precision, recall, True Negative Rate, Accuracy, Packet Delivery Ratio (PDR) and throughput.
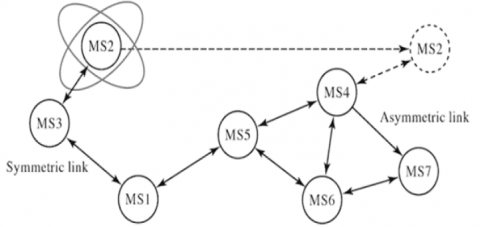
The Infrastructure less mobile ad hoc network is known as MANET and all the sensor nodes in MANET are self configure. The main application of the MANET is disaster management and the network environment which requires mobility of sensor nodes [1-3]. The sensor nodes in MANET are designed with the sensing element which is followed by the Analog to Digital (A/D) converter. The converted digital outputs are transmitted via the microcontroller unit with less mobility based energy aware antenna. These sensor nodes in MANET are affected by some external resources which are called as hacker. The hacker attacked the sensor nodes in MANET and converts the actual and real functionalities of sensing node. This degrades the performance efficiency of the entire MANET environment network. Hence, the detection and identification of these attacked sensor nodes in MANET are important in order to improve the performance efficiency [4-6]. These hacked or attacked sensor nodes are categorized as malicious and residual sensor nodes. The malicious nodes are the attacked sensor nodes which have the energy less than 10 mj and further they are not able to transmit the data to the nearby sensor nodes. The residual sensor nodes are the nodes where the functional characteristics of the node is altered which continuously sends the irrelevant information to the nearby sensor nodes [7]. Figure 1 is the MANET environment where all the mobile sensor nodes (MS) are interfaced with other sensor nodes.
Michail Chatzidakis et al. (2022) detected and mitigated the abnormal malicious and residual sensor nodes using graph based linear correlation method. The authors developed this linear correlation algorithm using clustering approach. The authors split the entire simulation model into three regions and cluster head was formed for each individual region. Among these three split regions, region 1 obtained 93.9% of malicious detection accuracy, region 2 obtained 94.9% of malicious detection accuracy and the region 3 obtained 94.1% of malicious detection accuracy. Sherif et al. (2021) discussed various machine learning techniques on the classification of sensor nodes in MANET for improving the security mechanism in real time disaster applications. In this work, the performance of the machine learning techniques on the detection process of sensor nodes in MANET were cross validated with respect to existing malicious node detection approaches in terms of detection accuracy and computational complexity. Zulfiqar Ali Zardari et al. (2019) proposed dual attack detection algorithm which detected both malicious and residual nodes in MANET environment network. This proposed and developed algorithm was able to detect all kind of black and hole attacks in this environment and the authors verified the attack detection ration with other existing similar models in MANET environment network. The authors split the entire simulation model into three regions and cluster head was formed for each individual region. Among these three split regions, region1 obtained 95% of malicious detection accuracy, region 2 obtained 95.1% of malicious detection accuracy and the region 3 obtained 93.3% of malicious detection accuracy.
Rajeswari et al. (2016) developed an effective clustering based algorithm for the detection of malicious sensor nodes in MANE. This algorithm was entirely based on back off working principle and the malicious sensor nodes were categorized into various sub class counts using the developed and proposed back off algorithm in this work. The authors also developed mitigated algorithm to predict the behavior of each detected malicious nodes in MANET and the detected malicious sensor nodes were completely mitigated and their performance was estimated and compared with other similar malicious node detection models. Singh et al. (2011) developed intrusion identification and processing algorithm for detecting and mitigating the residual nodes and malicious sensor nodes in MANET environment system. The authors computed the Euclidean distance parameters between all the sensing nodes in MANET and these sensor nodes were classified through the distance computing mechanism in this work. The authors tested this proposed work on standard test benches to validate the effectiveness of this MANET intrusion detection algorithm. The authors split the entire simulation model into three regions and cluster head was formed for each individual region. Among these three split regions, region 1 obtained 90.1% of malicious detection accuracy, region 2 obtained 92.0% of malicious detection accuracy and the region 3 obtained 93.0% of malicious detection accuracy.
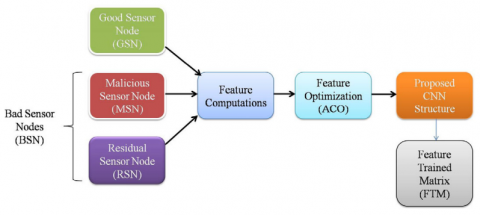
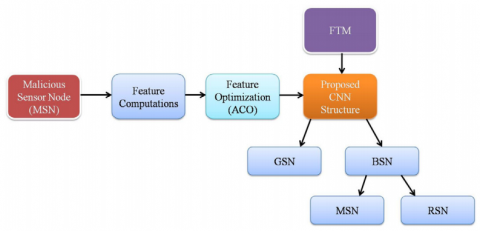
All MANET environment networks are having Good Sensor Nodes (GSN) initially and they become Bad Sensor Nodes (GSN) due to internal and external attacks. Therefore, the MANET environment networks have both types of GSN and BSN. These BSN are categorized into Malicious Sensor Nodes (MSN) and Residual Sensor Nodes (RSN). The formation of these MSN and RSN may degrade the performance efficiency of the entire MANET environment network. Therefore, it is necessary to detect and mitigate these BSN from the network. In this work, GSN and BSN are classified using the proposed CNN structure. This proposed system consists of feature computations, feature optimization through Ant Colony Optimization (ACO) Algorithm and the optimized features are classified through the proposed CNN structure. Figure 2(a) shows the proposed ACO-CNN training phase and Figure 2(b) shows the proposed ACO- CNN testing phase.
Figure 2(a). Proposed ACO-CNN training phase
Figure 2(b). Proposed ACO-CNN testing phase
3.1 Feature computations and optimization
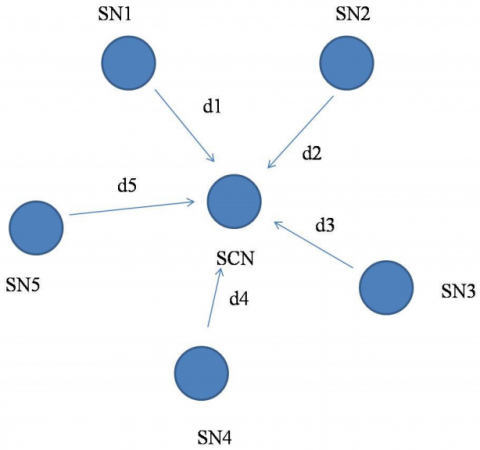
The features in this work are determined between the Sensing Center Node (SCN) and Surrounding Sensing Nodes (SN), as illustrated in Figure 3. In this Figure 3, the center node SCN is classified as GSN, MSN and RSN, using the computed features which are feed as input to the classification architecture.
Figure 3. Computations of FM
Step 1:
Compute the distance between Sensing Center Node (SCN) to all other surrounding sensing nodes SN1, SN2, SN3, SN4, and SN5, using the following equations.
d1=√(SCN−SN1)2 (1)
d2=√(SCN−SN2)2 (2)
d3=√(SCN−SN3)2 (3)
d4=√(SCN−SN4)2 (4)
d5=√(SCN−SN5)2 (5)
Step 2:
Determine the Distance Metric (DM) of the computed all distances with the following equations.
DM=∑d1+d2+d3+d4+d5n (6)
Where, n is the number of surrounding sensor nodes in MANET environment.
Step 3:
Find the Sensing Node Metric (SNM) between SCN and all other SN as given below.
SNM1=d1∗DMn (7)
SNM2=d2∗DMn (8)
SNM3=d3∗DMn (9)
SNM4=d4∗DMn (10)
SNM5=d5∗DMn (11)
Step 4:
Find Odd Node Metric (ONM) between SCN and all other surrounding SN as stated below.
ONM1=SNM1+d1∑SNM1+SNM2+SNM3+SNM4+SNM5 (12)
ONM3=SNM3+d3∑SNM1+SNM2+SNM3+SNM4+SNM5 (13)
ONM5=SNM5+d5∑SNM1+SNM2+SNM3+SNM4+SNM5 (14)
Step 5:
Find Even Node Metric (ENM) between SCN and all other surrounding SN as stated below.
ENM2=DM(SNM2+d2)∑SNM1+SNM2+SNM3+SNM4+SNM5 (15)
ENM4=DM(SNM4+d2)∑SNM1+SNM2+SNM3+SNM4+SNM5 (16)
Step 6:
Find Feature Matrix (FM) using the following equation.
FM=[d1,d2,d3,d4,d5SNM1,SNM2,SNM3,SNM4,SNM5ONM1,ONM3,ONM5ENM2,ENM4,DM] (17)
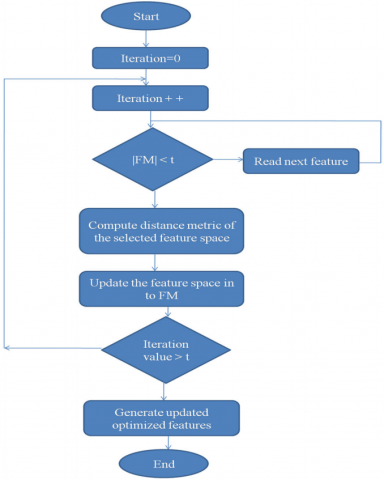
In this paper, during training the FM is computed individually for GSN, MSN and RSN and they are individually trained by the following proposed CNN architecture for the classification of center sensing node into any one of the sensing node category as GSN or MSN or RSN. The size of this constructed FM is large due to the computation of all features individually for all the sensing nodes in MANET environment. This cannot be directly processed by the proposed CNN architecture. Hence, this constructed FM from the entire MANET architecture should be reduced using feature optimization algorithm. Figure 4 shows the flow of ACO Algorithm for FM optimization. The entire constructed FM is fed into ACO algorithm which is given in Figure 4. In this working flow of FM optimization, each element in the FM is compared with 't', which is the average value of all theelements in FM. If the element in FM is greater than the computed 't', then the computation of distance metric of the selected feature space is processed and the feature space is updated into FM. Now, the iteration value is compared with 't' which produces the updated optimized FM (OFM) if the condition is satisfied, as depicted in Figure 4.
Figure 4. Flow of ACO Algorithm for FM optimization
3.2 CNN structure
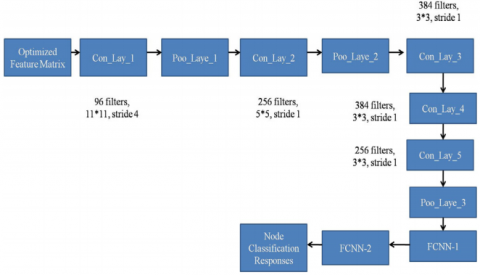
In this work, two CNN architectures are used to perform classification process of sensing nodes in MANET into either GSN or BSN. The existing AlexNet CNN architecture is designed using five Convolutional layers along with three pooling layers and two Fully Connected layers as illustrated in Figure 5(a). The first Con_Lay_1 in this architecture constitute using 96 filtering elements with 11∗11 kernel size along with stride 4. The input Optimized Feature Matrix (OFM) is passed through Con_Lay_1, to produce the matrix which is greater than the size of the OFM with negative index values. These negative index values are removed by passing the output of Con_Lay_1 to the Poo_Laye_1, which is operated using Max function. The output of Poo_Laye_1 is passed through Con_Lay_2, which constitute using 256 filtering elements with 5∗5 kernel size along with stride 1. In order to remove the negative index values in this output, the output of Con_Lay_2 is again passed through Poo_Laye_2. The output of Poo_Laye_2 is now passed through the three consecutive elements Con_Lay_3 , Con_Lay_4 and Con_Lay_5. The design specifications of these three consecutive elements are given in Table 1. Now, the response from Con_Lay_5 is passed through Poo_Laye_3 and its output is passed through FCNN-1 (4096 neurons) and FCNN2 (1028 neurons). The final output from FCNN-2 gives the classification indexes as GSN, MSN or RSN.
Figure 5(a). Processing Elements of Existing AlexNet
Figure 5(b). Processing Elements of proposed CNN
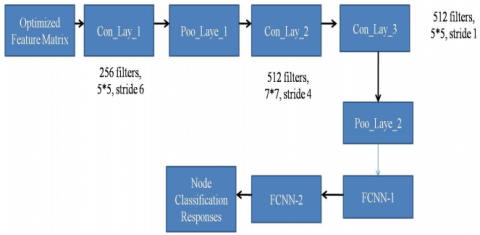
The proposed CNN is the resource efficient modifications of the existing AlexNet CNN architecture, which is illustrated in Figure 5(b). The number of utilization layers in existing AlexNet CNN architecture is significantly reduced in the proposed CNN, which optimize the output response of the proposed design in this work. The internal elements configuration and its size with filter counts are clearly given in Table 1. Even though the number of Con_Lay elements are reduced, the number of filters and its size are increased which maximizes the output, as depicted in Figure 5(b).
Table 1. Proposed CNN internal design specifications
|
Internal Elements Name |
Specifications Remarks |
|
Con_Lay_1 |
256 filters, 5 * 5, stride 6 |
|
Poo_Laye_1 |
Max function (2 * 2) |
|
Con_Lay_2 |
512 filters, 7 * 7, stride 4 |
|
Con_Lay_3 |
512 filters, 5 * 5, stride 1 |
|
Poo_Laye_2 |
Max function (2 * 2) |
|
FCNN-1 |
Specifications remarks |
|
FCNN-2 |
256 filters, 5 * 5, stride 6 |
The simulation environment of MANET network consists of 1000 GSN and 1500 BSN and Network Simulator version 3 is used in this work to simulate the entire proposed ACOCNN algorithm. The simulation area is set to 1000 m∗1000 m as width and height respectively and the initial energy of the each sensing node is set to 2000 J.
The transmission rate of each sensing node is set to 100 Mb/s. The specification of the simulation environment is illustrated in Table 2.
Table 2. MANET simulation environment specifications
|
Parameters |
Simulation Initial Value |
|
Total sensing nodes |
2500 |
|
GSN counts |
1000 |
|
BSN counts |
1500 |
|
Simulation area |
|
|
Initial energy of node |
2000 J |
|
Routing protocol |
Dynamic Source Routing (DSR) |
The following mathematical equations are used in MANET system to analyze its performance behavior.
Precision (Pr)=TPTP+FP (18)
Recall (Re)=TPTP+FN (19)
True Neagative Rate (TNR)=TNFP+TN (20)
Accuracy(Acc)=TP+TNTP+TN+FP+FN (21)
Whereas, TP and TN indicate correctly detected GSN and BSN respectively, FP and FN indicates the wrongly detected GSN and BSN respectively.
In this work, 950 GSN are correctly detected over 1000 GSN nodes and hence the TP is 950. The 1450 BSN nodes are correctly detected over 1500 BSN nodes and hence the value of FP is set to 1450. The 50 GSN nodes are wrongly detected and hence the value of FP is set to 50 and the 50 BSN nodes are wrongly detected and hence the value of FN is set to 50. These computed parameters are applied in the above equations and the performance evaluation parameters for MANET system is depicted in Table 3.
Table 3. Performance computations of the proposed ACOCNN system
|
Performance Parameters |
Computed Values in % |
|
Precision (Pr) |
95 |
|
Recall (Re) |
95 |
|
True Negative Rate (TNR) |
96.6 |
|
Accuracy (Acc) |
96 |
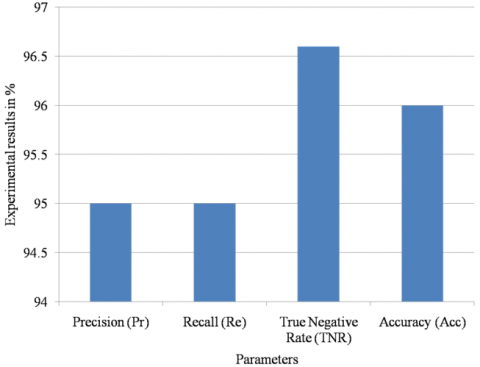
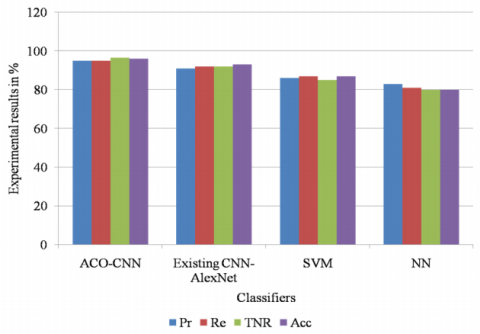
Figure 6 is the graphical illustration of the proposed ACOCNN system with various parameters Precision, Recall, True Negative Rate and Accuracy. From this graphical analysis of various performance parameters, the precision and recall have more or less similar values which are 95% and it is most suitable values for the proposed MANET system. Further, the value of TNR is high which is 96.6% which illustrates that there is few malicious nodes presence in the proposed MANET system. Finally, the graph illustrates the accuracy value which is 96% which highlights the performance efficiency of the proposed MANET system.
Figure 6. Graphical illustration of the proposed ACO-CNN system with various parameters
Table 4 shows the performance comparisons of proposed ACO-CNN with other existing classifiers. In this work, the performance of ACO-CNN classifier is compared with existing AlexNet CNN, Support Vector Machine (SVM) and Neural Networks (NN) classifiers in terms of Pr, Re, TNR and Acc. The proposed MANET system using ACO-CNN architecture stated in this paper obtains 95% Pr, 95% Re, 96.6% TNR and 96% Acc. The MANET system with existing AlexNet CNN architecture obtains 91% Pr, 92% Re, 92% TNR and 93% Acc. The MANET system with existing SVM architecture obtains 86% Pr, 87% Re, 85% TNR and 87% Acc. The MANET system with existing NN architecture obtains 83% Pr, 81% Re, 80% TNR and 80% Acc.
Table 4. Performance comparisons of proposed ACO-CNN with other existing classifiers
|
Methodologies/Classifiers |
Performance Parameters in % |
|||
|
|
Pr |
Re |
TNR |
Acc |
|
ACO-CNN (proposed in this work) |
95 |
95 |
96.6 |
96 |
|
Existing CNN-AlexNet |
91 |
92 |
92 |
93 |
|
SVM |
86 |
87 |
85 |
87 |
|
NN |
83 |
81 |
80 |
80 |
Figure 7 is the graphical illustration of the comparisons of proposed ACO-CNN with other existing classifiers Alaxnetthe deep learning classification algorithm, SVM and NN-the machine learning classification algorithms. In case of ACOCNN method, the TNR have higher value than the other parameters. In case of AlexNet method, the value of Accuracy has higher value than the other parameters. In case of SVM, the value of recall has higher value than the other parameters. In case of NN method, the value of Precision has higher value than the other parameters.
Figure 7. Graphical illustration of the comparisons of proposed ACO-CNN with other existing classifiers
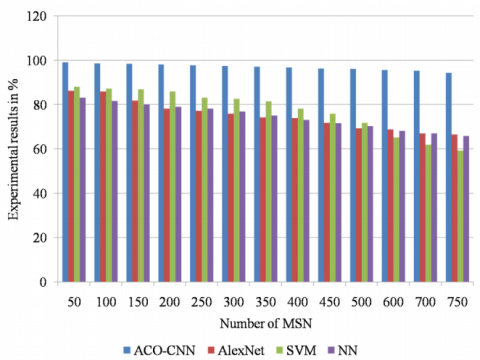
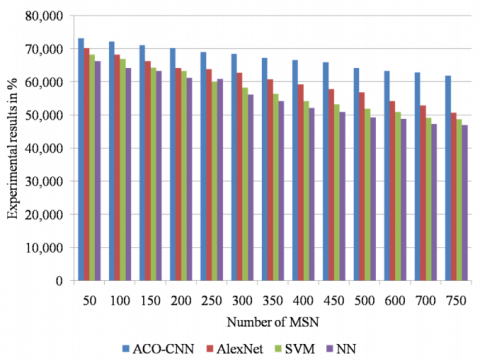
Table 5 shows the comparative analysis in terms of PDR for MSN detection system. In this paper, the MANET performance is evaluated and compared with other classification methods AlexNet, SVM and NN with respect to number of MSN nodes in MANET environment network. The number of MSN in MANET environment reduces the PDR performance as illustrated in Table 5. The presence of 50 MSN in MANET obtains 99.1% PDR and the presence of 750 MSN obtains 94.3%. PDR using ACO-CNN architecture in this paper.
The MANET system using existing AlexNet obtains 86.3% PDR for the presence of 50 MSN and also obtains 66.5% PDR for the presence of 750 MSN. The MANET system using existing SVM obtains 88.1% PDR for the presence of 50 MSN and also obtains 59.3% PDR for the presence of 750 MSN. The MANET system using existing NN obtains 83.2% PDR for the presence of 50 MSN and also obtains 65.9% PDR for the presence of 750 MSN.
Table 5. Comparative analysis in terms of PDR for MSN detection system
|
Number of MSN |
ACO-CNN |
Existing CNN-AlexNet |
SVM |
NN |
|
50 |
99.1 |
86.3 |
88.1 |
83.2 |
|
100 |
98.7 |
85.9 |
87.3 |
81.7 |
|
150 |
98.4 |
81.9 |
87.0 |
80.3 |
|
200 |
98.1 |
78.3 |
85.9 |
79.1 |
|
250 |
97.8 |
77.3 |
83.2 |
78.2 |
|
300 |
97.5 |
75.9 |
82.7 |
76.9 |
|
350 |
97.1 |
74.3 |
81.5 |
75.1 |
|
400 |
96.8 |
73.9 |
78.3 |
73.2 |
|
450 |
96.4 |
71.9 |
75.9 |
71.6 |
|
500 |
96.1 |
69.3 |
71.9 |
70.3 |
|
600 |
95.7 |
68.8 |
65.2 |
68.3 |
|
700 |
95.3 |
67.1 |
61.9 |
67.1 |
|
750 |
94.3 |
66.5 |
59.3 |
65.9 |
Figure 8 shows the graphical illustration of the comparative analysis in terms of PDR for MSN detection system. From this graph, the number of MSN nodes are mainly dependant on the proposed method performance and its significantly affects the performance of the entire system with respect to various parameters.
Figure 8. Graphical illustration of the comparative analysis in terms of PDR for MSN detection system
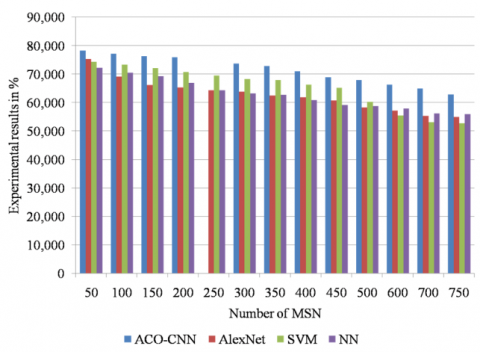
Table 6 shows the comparative analysis in terms of throughput for MSN detection system.The presence of 50 MSN in MANET obtains 78,291b/s and the presence of 750 MSN obtains 62,917 b/s using ACO-CNN architecture in this paper. The MANET system using existing AlexNet obtains 75,298 b/s for the presence of 50 MSN and also obtains 54,962 b/s for the presence of 750 MSN. The MANET system using existing SVM obtains 74,392 b/s for the presence of 50 MSN and also obtains 52,747 b/s for the presence of 750 MSN. The MANET system using existing NN obtains 72,198 b/s for the presence of 50 MSN and also obtains 55,956 b/s for the presence of 750 MSN.
Table 6. Comparative analysis in terms of throughput for MSN detection system
|
Number of MSN |
ACO-CNN |
Existing CNN-AlexNet |
SVM |
NN |
|
50 |
78,291 |
75,298 |
74,392 |
72,198 |
|
100 |
77,186 |
69,197 |
73,298 |
70,547 |
|
150 |
76,297 |
66,208 |
72,168 |
69,291 |
|
200 |
75,938 |
65,298 |
70,827 |
66,894 |
|
250 |
74.397 |
64,296 |
69,567 |
64,298 |
|
300 |
73,748 |
63,847 |
68,296 |
63,198 |
|
350 |
72,865 |
62,486 |
67,957 |
62,747 |
|
400 |
70,947 |
61,947 |
66,299 |
60,896 |
|
450 |
68,916 |
60,837 |
65,198 |
59,187 |
|
500 |
67,947 |
58,297 |
60,286 |
58,846 |
|
600 |
66,297 |
57,187 |
55,492 |
57,946 |
|
700 |
64,915 |
55,298 |
53,192 |
56,198 |
|
750 |
62,917 |
54,962 |
52,747 |
55,956 |
Figure 9 is the graphical illustration of the comparative analysis in terms of throughput for MSN detection system. From this graph, the number of MSN nodes are mainly dependant on the proposed method performance and its significantly affects the performance of the entire system with respect to various parameters.
Figure 9. Graphical illustration of the comparative analysis in terms of throughput for MSN detection system
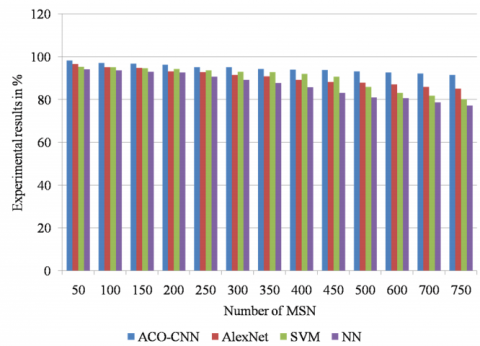
Table 7 shows the comparative analysis in terms of PDR for RSN detection system. In this paper, the MANET performance is evaluated and compared with other classification methods AlexNet, SVM and NN with respect to number of MSN nodes in MANET environment network. The number of RSN in MANET environment reduces the PDR performance as illustrated in Table 7. The presence of 50 RSN in MANET obtains 98.3% PDR and the presence of 750 RSN obtains 91.6%. PDR using ACO-CNN architecture in this paper. The MANET system using existing AlexNet obtains 96.6% PDR for the presence of 50 RSN and also obtains 85.2% PDR for the presence of 750 RSN. The MANET system using existing SVM obtains 95.3% PDR for the presence of 50 RSN and also obtains 80.3% PDR for the presence of 750 RSN. The MANET system using existing NN obtains 94.2% PDR for the presence of 50 RSN and also obtains 77.3% PDR for the presence of 750 RSN.
Table 7. Comparative analysis in terms of PDR for RSN detection system
|
Number of MSN |
ACO-CNN |
Existing CNN-AlexNet |
SVM |
NN |
|
50 |
98.3 |
96.6 |
95.3 |
94.2 |
|
100 |
97.1 |
95.2 |
95.1 |
93.7 |
|
150 |
96.9 |
94.9 |
94.7 |
93.1 |
|
200 |
96.3 |
93.2 |
94.3 |
92.7 |
|
250 |
95.2 |
92.9 |
93.7 |
90.7 |
|
300 |
95.1 |
91.5 |
93.1 |
89.2 |
|
350 |
94.4 |
90.9 |
92.8 |
87.8 |
|
400 |
94.1 |
89.3 |
92.1 |
85.8 |
|
450 |
93.9 |
88.2 |
90.7 |
83.2 |
|
500 |
93.2 |
87.9 |
85.9 |
81.0 |
|
600 |
92.7 |
87.1 |
83.2 |
80.7 |
|
700 |
92.3 |
85.9 |
81.9 |
78.7 |
|
750 |
91.6 |
85.2 |
80.3 |
77.3 |
Figure 10 is the graphical illustration of the comparative analysis in terms of PDR for MSN detection system. From this graph, the number of MSN nodes are mainly dependant on the proposed method performance and its significantly affects the performance of the entire system with respect to various parameters.
Figure 10. Graphical illustration of the comparative analysis in terms of PDR for MSN detection system
Table 8 shows the comparative analysis in terms of throughput for RSN detection system. The presence of 50 RSN in MANET obtains 73,209 b/s and the presence of 750 RSN obtains 61,928 b/s using ACO-CNN architecture in this paper. The MANET system using existing AlexNet obtains 70,298 b/s for the presence of 50 RSN and also obtains 50,726 b/s for the presence of 750 RSN. The MANET system using existing SVM obtains 68,298 b/s for the presence of 50 RSN and also obtains 48,725 b/s for the presence of 750 RSN. The MANET system using existing NN obtains 66,298 b/s for the presence of 50 RSN and also obtains 46,981 b/s for the presence of 750 RSN.
Table 8. Comparative analysis in terms of throughput for RSN detection system
|
Number of MSN |
ACO-CNN |
Existing CNN-AlexNet |
SVM |
NN |
|
50 |
73,209 |
70,298 |
68,298 |
66,298 |
|
100 |
72,198 |
68,291 |
66,918 |
64,198 |
|
150 |
71,097 |
66,298 |
64,298 |
63,298 |
|
200 |
70,298 |
64,269 |
63,298 |
61,298 |
|
250 |
69,009 |
63,916 |
60,198 |
60,956 |
|
300 |
68,514 |
62,749 |
58,287 |
56,198 |
|
350 |
67,298 |
60,816 |
56,487 |
54,296 |
|
400 |
66,674 |
59,296 |
54,298 |
52,187 |
|
450 |
65,987 |
57,826 |
53,209 |
50,961 |
|
500 |
64,174 |
56,916 |
51,927 |
49,298 |
|
600 |
63,298 |
54,286 |
50,957 |
48,915 |
|
700 |
62,938 |
52,918 |
49,198 |
47,296 |
|
750 |
61,928 |
50,726 |
48,725 |
46,981 |
Figure 11 shows the graphical illustration of the comparative analysis in terms of throughput for RSN detection system.
Figure 11. Graphical illustration of the comparative analysis in terms of throughput for RSN detection system
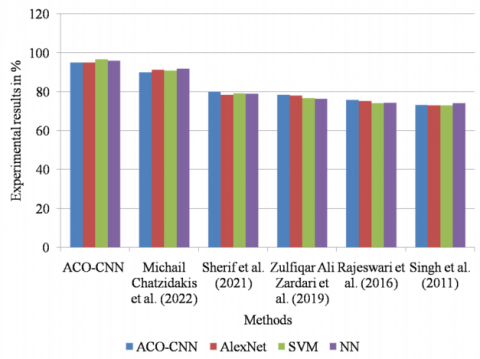
Table 9. shows the comparisons of the proposed ACO-CNN method with other existing methods
|
Methodologies |
Pr (%) |
Re (%) |
TNR (%) |
Acc (%) |
|
ACO-CNN MANET system |
95 |
95 |
96.6 |
96 |
|
Michail Chatzidakis et al. (2022) |
90 |
91.2 |
90.8 |
91.8 |
|
Sherif et al. (2021) |
79.9 |
78.3 |
79.1 |
79.0 |
|
Zulfiqar Ali Zardari et al. (2019) |
78.3 |
78.1 |
76.7 |
76.3 |
|
Rajeswari et al. (2016) |
75.8 |
75.3 |
74.1 |
74.3 |
|
Singh et al. (2011) |
73.1 |
72.9 |
72.9 |
74.1 |
Figure 12 shows the graphical comparisons of the proposed ACO-CNN method with other existing methods. It is well known that, the proposed ACO-CNN method obtains higher performance efficiency with respect to various performance parameters than the other existing deep and machine learning classification algorithms in this paper.
Figure 12. Graphical comparisons of the proposed ACOCNN method with other existing methods
This paper proposes a high performance ACO-CNN based malicious and residual sensor node detection system in MANET environment network. In this work, the performance of ACO-CNN classifier is compared with existing AlexNet CNN, Support Vector Machine (SVM) and Neural Networks (NN) classifiers in terms of Pr, Re, TNR and Acc. The proposed MANET system using ACO-CNN architecturestated in this paper obtains 95% Pr, 95% Re, 96.6% TNR and 96% Acc. The MANET system with existing AlexNet CNN architecture obtains 91% Pr, 92% Re, 92% TNR and 93% Acc. The MANET system with existing SVM architecture obtains 86% Pr, 87% Re, 85% TNR and 87% Acc. The MANET system with existing NN architecture obtains 83% Pr, 81% Re, 80% TNR and 80% Acc. The presence of 50 MSN in MANET obtains 99.1% PDR and the presence of 750 MSN obtains 94.3%. PDR using ACO-CNN architecture in this paper. The presence of 50 MSN in MANET obtains 78,291b/s and the presence of 750 MSN obtains 62,917 b/s using ACO-CNN architecture in this paper.
[1] S. Xiao, X. Ge, QL. Han, Y. Zhang, "Secure distributed adaptive platooning control of automated vehicles over vehicular Ad-Hoc networks under Denial-of-service attacks". IEEE Trans. Cybern. 1– 13 (2021).
[2] H.Fatemidokht , M.K.. Rafsanjani, B.B. Gupta, C.H. Hsu, "Efficient and secure routing protocol based on artificial intelligence algorithms with UAV-assisted for vehicular Ad Hoc networks in intelligent transportation systems". IEEE Trans. Intell. Transp. Syst. 22(7) 4757– 4769 (2021).
[3] P. Surjeet, Bhardwaj, R. Pal, N. Gupta, "An intelligent scheme for slot reservation in vehicular ad hoc networks". China Commun. 18(7) 223– 235 (2021).
[4] G. Cervera, M. Barbeau, J. Garcia-Alfaro, E. Kranakis, "A multipath routing strategy to prevent flooding disruption attacks in link-state routing protocols for MANETs". J. Network Comput. Appl. 36(2), 744– 755 (2013).
[5] J. Sathiamoorthy, B. Ramakrishnan, M. Usha, "Design of a proficient hybrid protocol for efficient route discovery and secure data transmission in CEAACK MANETs". J. Inf. Secur. Appl. 36, 43– 58 (2017).
[6] S. Satheeshkumar,N. Sengottaiyan, "Defending against jellyfish attacks using cluster-based routing protocol for secured data transmission in MANET". Clust. Comput. 22, 10849– 10860 (2017).
[7] S. Sharma, A.Kaul , "A survey on intrusion detection systems and honeypot based proactive security mechanisms in VANETs and VANET cloud". Veh. Commun. 12, 138– 164 (2018).
[8] Michail Chatzidakis, Stathes Hadjiefthymiade, "A trust change detection mechanism in mobile ad-hoc networks", Computer Communications, Volume 187, 1 April 2022, Pages 155-163.
[9] A.R Rajeswari, K. Kulothungan, S. Ganapathy and A. Kannan, "Malicious Nodes Detection in MANET Using Back-Off Clustering Approach", Circuits and Systems, vol. 7, pp. 2070-2079, 2016.
[10] B. V. Sherif and P. Salini, "Effective and Prominent Approaches for Malicious Node Detection in MANET,"2021 International Conference on Computational Intelligence and Computing Applications (ICCICA), Nagpur, India, 2021, pp. 1-6.
[11] Zulfiqar Ali Zardari, Jingsha He, Nafei Zhu, Khalid Hussain Mohammadani, Muhammad Salman Pathan, Muhammad Iftikhar Hussain, et al., "A Dual attack detection technique to identify black and grey hole attacks using an intrusion detection system and a connected dominating set in MANETs", Future Internet, 2019.
[12] Y. Singh, S.K. Jena, "Intrusion Detection System for Detecting Malicious Nodes in Mobile Ad Hoc Networks". In: D. Nagamalai, E. Renault, M. Dhanuskodi, M. (eds),"Advances in Parallel Distributed Computing". PDCTA 2011. Communications in Computer and Information Science, vol 203. Springer, Berlin, Heidelberg.
[13] K Saravanan, et. Al (2021) "WMLP: Web-based Multi-Layer protocols for Emergency Data Transmission in Mobile Ad Hoc Network", International Conference of Computer Science and Renewable Energies (ICCSRE'2021), http://doi.org/doi: 10.1051/e3sconf/202129701065.
[14] S.Kumarganesh, et. al (2022), "A Novel Analytical Framework Is Developed for Wireless Heterogeneous Networks for Video Streaming Applications", Journal of Mathematics. http://doi.org/10.1155/2022/2100883.
[15] B. Thiyaneswaran, S. Kumarganesh, K. MartinSagayam , Hien Dang, "An effective model for the iris regional characteristics and classification using deep learning alex network". IET Image Processing 2022, Vol. 17(1) pp. 227-238, DOI: 10.1049/ipr2.12630. K Saravanan, et. al (2021),"Power Adjustment Algorithm for Higher Throughput in Mobile Ad-Hoc Networks".International Conference of Computer Science and Renewable Energies (ICCSRE'2021), http://doi.org/10.1051/e3sconf/202129701064.