Abbas Kadhim Shakir | Ebrahim Hajidavalloo* | Alireza Daneh-Dezfuli | Samer Mohammed Abdulhaleem | Oras Khudhayer Obayes
© 2023 IIETA. This article is published by IIETA and is licensed under the CC BY 4.0 license (http://creativecommons.org/licenses/by/4.0/).
OPEN ACCESS
The electrical efficiency of the solar cell is effectively increased by the cooling process. In order to create a hybrid collector, the current work addresses how to cool the PV panel using three different nanofluids, including CuO, ZnO, and TiO2. known as a photovoltaic thermal sun collector in numbers (PVT). The volume fraction of the nanoparticles was 0.1, 0.2, and 0.3 vol%. The PV panel was cooled using a copper tube that was attached to the rear of the PV and positioned to cover as much of the back as feasible. To compare them, three distinct flow cross sections (rectangular, square, and circular) were chosen. This numerical analysis was conducted with nanofluid flow rates of 0.5, 1, 1.5, and 2 L/min under solar radiation levels ranging from 450 W/m2 to 750 W/m2. The outcomes demonstrate the PVT system's electrical and thermal efficiency under various circumstances. When nanofluid was added instead of just plain water, the electrical efficiency rose. The cell with CuO/nanofluids had the maximum electrical efficiency at 450 W/m2, which was equal to 11.8%, while ZnO/nanofluids, TiO2/nanofluids, and water had 11.6%, 11.5%, and 10.8%, respectively. The CuO/nanofluids and rectangular sections provided the best value for the highest electrical efficiency of 11.5% and electrical power of 83.17 W.
nano-technology, photovoltaic collector, PVT, electrical efficiency, thermal efficiency
Energy is crucial to the economy and economic development of every country [1-3]. Fossil fuels account for a significant amount of the world's energy, which produces greenhouse gases and contributes to global warming. For the survival and development of humanity, several nations intend to reduce their non-renewable energy generation portfolio. Because they optimize the use of netted heat inside the photovoltaic cell while also improving PV performance, photovoltaic-thermal collectors, a cogeneration technology that combines the elements of a photovoltaic cell and solar thermal absorber, are an effective option.
The numerical model was created by Rajaee et al. [4] in the ANSYS CFX environment while taking into consideration the unit's energetic and exergetic performance. The major factors in this simulation are the Reynolds number and the volume fractions of the nanoparticles. The results of this study demonstrate that, particularly at lower Reynolds numbers, utilizing hybrid nanofluids reduces the cell temperature more effectively than using pure water. Furthermore, their findings revealed that the electrical efficiency depended on the type of nanofluid. By utilizing the hybrid nanofluids, the Concentrating Photovoltaic- Thermal panel's energy efficiency is also noticeably improved. The use of hybrid nanofluids in solar systems might theoretically result in a desirable performance, it can be determined.
Mustafa et al. [5] developed a numerical and mathematical model to assess the performance of a photovoltaic thermal nanofluid system. The goal of this work is to theoretically investigate a new PVT system configuration that uses a nanofluid as the working fluid to extract heat from a solar panel and a rectangular stainless-steel tube. The impacts of mass flow rate and solar irradiation on three distinct volume concentrations from (Tio2) 0.5 to 1.5V% were investigated. The best results were obtained with lower volume concentration, according to the data, which showed that the electrical and thermal efficiency are proportional to mass flow rate. Additionally, it was discovered that volume concentrations of 0.5V% under Malaysia's average solar irradiation of 650W/m2 and average climate demonstrated greater electrical and thermal efficiency, respectively. Khanjari et al. [6] examined how using nanofluid affected the effectiveness of the PV/T system. A water riser tube and an absorber plate are included in the suggested model to account for conduction and convection heat transfer methods. Conjugate heat transfer was used CFD to produce the numerical results. The findings demonstrate that growing the volume percentage of nanoparticles increases the efficiency and heat transfer coefficient.
A nanofluid-cooled photovoltaic/thermal system was created by Lari & Sahin [7] to satisfy the electricity requirements of a residential building for the climate. The best collector design is chosen using CFD, and then the system's daily and yearly performance is analytically assessed using Engineering Equation Solver. A feasibility study on the economy is also conducted to show the system's financial advantages. According to the results, a watercooled PVT system has a growth in electrical output of 8.5% over a PV system, and a nanofluid-cooled PVT system has an increase in thermal output of 13% over a water-cooled PVT system. The yearly thermal and electrical increase of a hybrid PV using nanofluids was estimated by Bellos & Tzivanidis [8]. Cu/water, the investigated nanofluid, is compared to water as the working fluid under various operating circumstances. The final findings show that the annual improvement in thermal performance is roughly 4.35%, while improvements in electrical and energetic performance are 1.49% and 3.19%, respectively.
In terms of thermal efficiency, Sultan & Tso [9] investigated the PVT performance for the enhanced parallel flow and contrasted it with the traditional absorber. In the investigation, several mass flow rates were employed. In another study, the energy and exergy analysis of the photovoltaic thermal (PVT) water collector with a glass cover was done by Rawat & Sudhakar [10]. On a daily basis, the various metrics, including thermal efficiency, electrical efficiency, and exergy efficiency, were calculated for the May meteorological conditions in Bhopal, India. The maximum temperature of the hot water produced by the PVT system on that specific day was determined to be 47.5°C with a mass flow rate of 0.0025 kg/sec. The system's thermal, electrical, and energy-saving efficiencies were determined to be greater than 67%, 9%, and 67%, respectively. PVT systems provide both electrical and thermal energy from a single system, hence reducing the electrical load from conventional energy sources.
A PV/T numerical model was created by El Fouas et al. [11] to study the impacts of heat flux. The three-layer PV model and the NOCT model are compared to validate the numerical model, which is then put to the test in continental temperate climate operating conditions. Additionally, a numerical investigation is done to determine how crucial flow factors like velocity and water film thickness affect heat exchange and PV/T production. Outcomes uncovered that the PV model and the NOCT model have a good degree of agreement. Numerically, photovoltaic/thermal sheet and tube collector was conducted and studied by Rejeb et al. [12]. Based on their findings, the PVT collector's performance in the semi-arid climate has been optimized using this model.
The current work covers how to cool the PV panel utilizing three distinct nanofluids, including CuO, ZnO, and TiO2, in order to construct a hybrid collector. In this investigation, a copper tube that was linked to the PV panel's back and placed to cover as much of the back as possible was used to cool the PV panel. Additionally, three different flow cross sections— rectangular, square, and circular—were selected.
The electrical and thermal performances of the system are presented numerically by using COMSOL software, and a comparison of different parameter conditions has been provided in order to investigate the combined efficiency of the PVT system.
2.1 Physical model
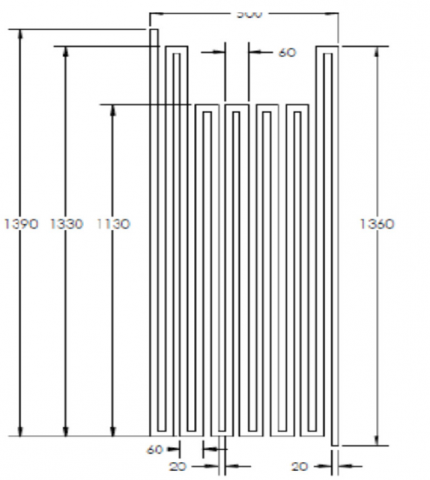
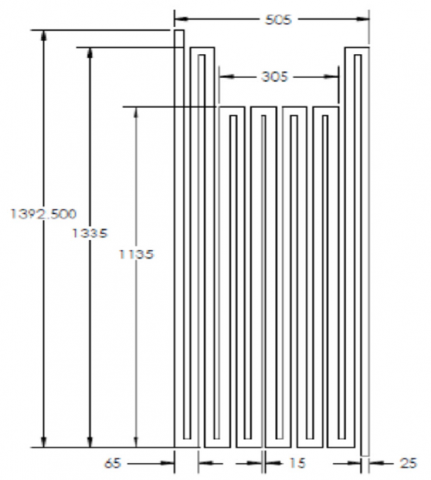
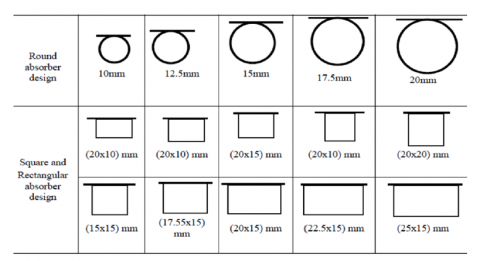
Schematics of PVT collectors were used for the geometrical model. The different absorber configurations represent the different water and nano fluids circulating through the absorber tube. For the analyses, some assumptions were made, such as that the system is operating in a quasi-steady state as well as that there is very little heat loss from the side of the system. Besides, the working fluids were incompressible and the flow was steady. Finally, the thermal- physical characteristics of absorber tubes, water, nanofluids, and PV panels are not temperature-dependent. Table 1 and Figure 1 show the configurations design of PVT absorber collectors under consideration. Figure 2 display cross section of photovoltaic absorber employed in current investigation.
Table 1. Dimensions design of PVT absorber collectors
|
Round |
Saquare |
Rectangular |
|||
|
Case 1 |
d |
Case 2 |
a |
Case 3 |
w |
|
Optimum Round |
10 |
Optimum d |
10 |
Optimum d |
15 |
|
12.5 |
2.5 |
17.5 |
|||
|
15 |
15 |
20 |
|||
|
17.5 |
17.5 |
22.5 |
|||
|
20 |
20 |
25 |
|||
Square tube [d=20mm]
Rectangular tube [w=25mm, d=15mm] Round tube [d=20mm]
Figure 1. Configurations design of PVT absorber collectors under consideration
Figure 2. Cross section of photovoltaic absorber under consideration
2.2 PVT model
In a solar thermal collector, complex fluid flow and heat transfer issues are examined using CFD. Fluid flow, heat transfer, and other physical processes are all simulated by the computer programme COMSOL. It resolves fluid flow equations over an area of interest using predetermined boundary conditions. Due to its ability to simultaneously solve several system configurations at a cheaper cost than experimental research, COMSOL is utilized in a wide range of sectors. The goal of the current study is to increase the thermal and electrical efficiencies of a PVT collector by investigating the impact of absorber designs employing Nano fluids as working fluids. The computational domain of the problems is the area of interest in this situation. The algorithm for the Semi- Implicit Method for Pressure-Linked Equations had an impact on the coupling of velocity and pressure [13]. For the solutions, second-order upwind schemes were chosen in the current study.
2.3 Governing equations and boundary conditions
The governing equations are adopted as shown below:
Continuity equation [14]:
$\rho \frac{\partial}{\partial x_i}\left(u_i\right)=0$ (1)
Momentum equation [15]:
$\begin{gathered}\frac{\rho \partial\left(u_i u_j\right)}{\partial x_i}=-\frac{\partial p}{\partial x_i}+\frac{\partial}{\partial x_j}\left[\mu\left(\frac{\partial u_i}{\partial x_j}+\frac{\partial u_j}{\partial x_i}\right)\right]+ \frac{\partial}{\partial x_j}\left(-\overline{\rho u_i u_j}\right)\end{gathered}$ (2)
Energy equation [15]:
$\rho \frac{\partial}{\partial x_i}(u, T)\left[\left(\Gamma+\Gamma_t\right) \frac{\partial T}{\partial x_j}\right]$ (3)
In the current study, the $\mathrm{k}-\varepsilon$ turbulence model is chosen as well as a common method that employs the Boussinesq hypothesis to relate the Reynolds stresses $\left(-\overline{\rho u_i u_j}\right)$ to the mean velocity gradients [16].
$-\overline{\rho u_i u_j}=\mu_t\left(\frac{\partial u_i}{\partial x_j}+\frac{\partial u_j}{\partial x_i}\right)$ (4)
Then, Turbulent viscosity is expressed as:
$\mu_t=\rho c_\mu \frac{k^2}{2}$ (5)
Also, the modeled equation of the TKE, k is written as:
$\rho \frac{\partial}{\partial x_i}\left(\rho k u_i\right)=\frac{\partial}{\partial x_j}\left[\left(\mu+\frac{\mu_t}{\sigma_k}\right) \frac{\partial k}{\partial x_j}\right]+G_k-\rho_{\varepsilon}$ (6)
And, the dissipation rate of TKE (ε):
$\rho \frac{\partial}{\partial x_i}\left(u_i\right)=\frac{\partial}{\partial x_j}\left[\left(\mu+\frac{\mu_t}{\sigma_{\varepsilon}}\right) \frac{\partial \varepsilon}{\partial x_j}\right]+C_{1 \varepsilon} \frac{\varepsilon}{k} G_k-C_{2 \varepsilon} \rho \frac{\varepsilon^2}{k}$ (7)
Besides:
$G_K=-\overline{\rho u_i u_j} \frac{\partial u_j}{\partial x_i}$ (8)
$G_K$ is the rate of generation of the TKE while $\rho \varepsilon$ is its destruction rate.
On the COMSOL domain, proper boundary conditions are stressed as the physics of the issue. While the outflow boundary condition is applied to the outlet, the intake boundary condition is given as the velocity inlet condition. In accordance with the no-slip and impermeability conditions contained in the viscous flow models, the velocity components at the wall were adjusted to zero. The wall has a coupled condition to conjugate heat exchange from the absorber tube to water, which is how the interface between the water and absorber tube is described. At the top surface of the PV panel, a fluctuating high temperature flux that is comparable to solar insolation is connected. The exterior of the absorber tube is described as having a wall with zero heat flux, which has an impact on the insulation conditions.
Herein, the system's total performance was assessed using the combined photovoltaic thermal (PVT) efficiency $\left(\eta_{\text {combined }}\right)$ [11, 12].
$\eta_{\text {combined }}=\eta_{\text {th }}+\eta_{\text {ele }}$ (9)
Also, the thermal efficiency $\left(\eta_{t h}\right)$
$\eta_{t h}=\frac{Q_U^{\circ}}{G A_{P V T}}$ (10)
Then, the collected heat $\left(Q_U\right)$ and the energy balance equation for the collector shown below:
$Q_U=m^{\circ} c_p\left(T_{f, \text { out }}-T_{f, \text { in }}\right)$ (11)
$Q_U=F_R b L\left[(\alpha \tau)_{e f f} G-U L\left(T_{f, i n}-T_a\right)\right]$ (12)
Solar irradiance (S):
$S=(\tau \alpha)_{P V} G_t$ (13)
The heat removal efficiency factor (FR):
$F_R=\frac{m^{\circ} c p}{U_L A_C}\left[1-\exp \left(\frac{U_L A_C F^{\prime}}{m^{\circ} c p}\right)\right]$ (14)
The corrected fin efficiency $\left(F^{\prime}\right)$ is:
$F^{\prime}=\left[\frac{\frac{1}{U_L}}{W\left[\frac{1}{U_L(D+(W-D)\,F}\,\,+\,\,\,\frac{1}{\,C_b}+\frac{1}{\pi D h}\right]}\,\right]$ (15)
The efficiency factor (F) [13]:
$F=\frac{\tanh [M(W-D) / 2]}{\frac{M(W-D)}{2}}$ (16)
where:
$M=\sqrt{\frac{U_L}{\left(K_{a b s} \,L_{a b s}\right)+\left(K_{P V} L_{P V}\right)}}$ (17)
Also, the temperature-dependent electrical efficiency [14]:
$\eta_{t h}=\frac{Q_U^{\circ}}{G A_{P V T}}=F_R\left[(\alpha \tau)_{e f f}-\frac{U_L\left(T_{f, i n}-T_a\right)}{G}\right]$ (18)
Finally, the electrical efficiency $\eta_{\mathrm{el}}$ :
$\eta_{e l}=\eta_{r\left(1-\beta\left(T_{p m}-T_r\right)\right.}$ (19)
2.4 Grid independent study
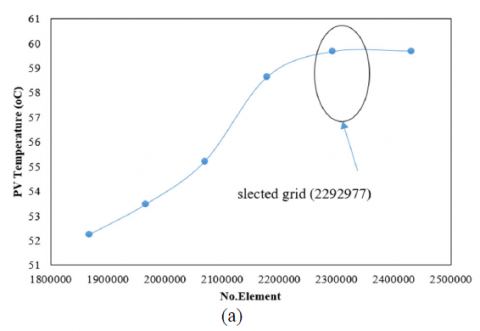
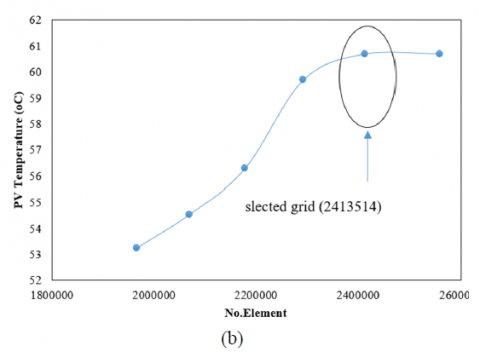
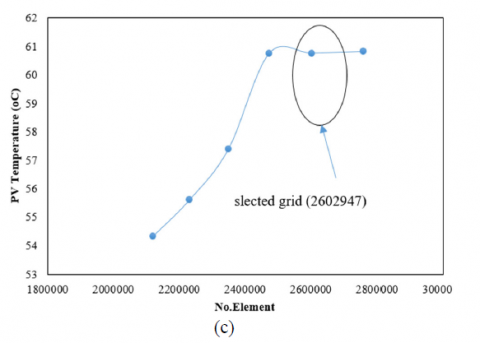
A grid-independent study was carried out to validate the mesh used in the current study. The Table 1 shows the number of elements that were tested, where six different grids were used for each type of solar collector (rectangle, square, and circular), and the mean PV/T temperature was chosen as a factor through which the appropriate grid was determined. As shown in Figure 3, boost in the number of elements leads to boost in the mean PV/T temperature until it appears stable. The required mesh is selected by calculating the error percentage through the following relationship.
Error $=\frac{T\left(G_{n+1}\right)-T\left(G_n\right)}{T\left(G_n\right)}$ (20)
where, $T\left(G_n\right)$ it's the mean PV/T temperature at old grid, and $T\left(G_{n+1}\right)$ it's the PV/T temperature at new grid.
As shown in Table 2, the number of elements equal to 2292977 for the collector with a rectangular cross section gave an error rate equal to $1.7 \%$, so the G5 will be selected for the rectangular section. In the same way, for square and circular sections, the appropriate number of elements is 2413514 and 2602947 , respectively.
Table 2. Grid independent test employed in the current study
|
Grid |
Rectangular Section |
Square Section |
Circular Section |
||||||
|
Domain elements |
Mean PV/T collector temperature |
Error |
Domain elements |
Mean PV/T collector temperature |
Error |
Domain elements |
Mean PV/T collector temperature |
Error |
|
|
G1 |
1867644 |
52.233 |
|
1965822 |
53.247 |
|
2120116 |
54.303 |
|
|
G2 |
1965941 |
53.458 |
0.023453 |
2069286 |
54.536 |
0.024208 |
2231701 |
55.592 |
0.023737178 |
|
G3 |
2069411 |
55.200 |
0.032586 |
2178196 |
56.278 |
0.031942 |
2349159 |
57.367 |
0.031929055 |
|
G4 |
2178328 |
58.630 |
0.062138 |
2292838 |
59.686 |
0.060557 |
2472799 |
60.731 |
0.058639985 |
|
G5 |
2292977 |
59.667 |
0.017687 |
2413514 |
60.681 |
0.016676 |
2602947 |
60.741 |
0.000164759 |
|
G6 |
2430555 |
59.689 |
0.000369 |
2558324 |
60.689 |
0.000126 |
2759123 |
60.8 |
0.000971238 |
3.1 Mean temperature photovoltaic panel
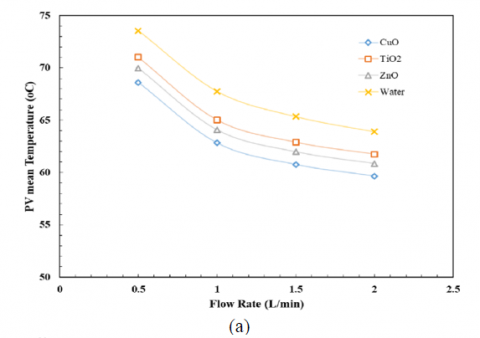
Figure 4 (a) shows the impact of mass flow rate on the mean TPM module temperature for a rectangular tube at constant solar irradiance (750 W/m2). From this figure, it can be noted that the mean TPM module temperature reduces with augmenting mass flow rate.
So, when the mass flow rate is equal to 2 L/min, the lower value of TPM is reached. On the other hand, it can be noted that at any mass flow rate, the effect of the addition of nano fluid is noticeable. A minimum value of TPM is noted for nanofluid CuO. Then nanofluid ZnO and finally TiO2. This returns to the higher thermal conductivity of the nano fluid CuO.
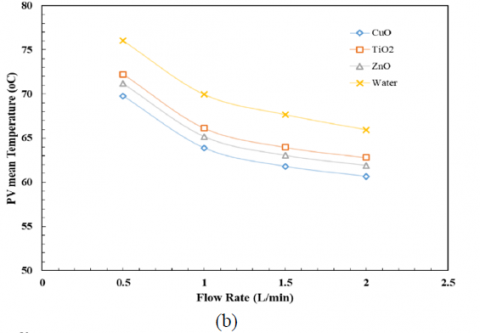
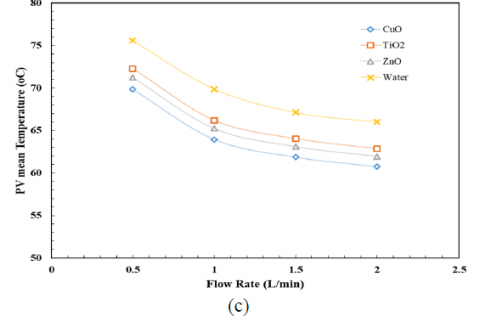
Figure 4 (b) and (c) show the effect of mass flow rate on the mean TPM module temperature for square tube and circular tube at constant solar irradiance (750 W/m2). But the difference from the previous figure for the rectangular shape of the tube is the TPM value, where the rectangular tube is better with the reduction in the TPM. This is due to the larger surface area of the rectangular tube.
Figure 3. Grid independent study for various types of photovoltaic absorber under consideration: a) Rectangular tube, (b) Square tube, and (c) Circular tube
Figure 4. Impact of mass flow rate on Tm at different nanofluid and constant solar Irradiance (750 W/m2): (a) Rectangular tube, (b) Square tube, and (c) Circular tube
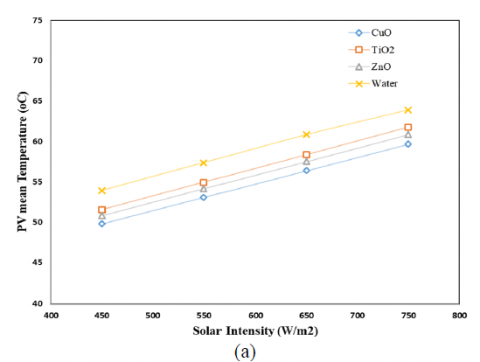
Figure 5 (a) shows the effect of solar irradiance on the mean TPM module temperature for a rectangular tube at constant solar irradiance (750 W/m2). From this figure, it can be noted that the mean TPM module temperature increases with solar irradiance. On the other hand, it can be noted that at any solar irradiance, the effect of the addition of Nano fluid is noticeable. A minimum value of TPM is noted for nanofluid CuO. Then nanofluid ZnO and finally TiO2. This is a return to the higher TPM of the collector.
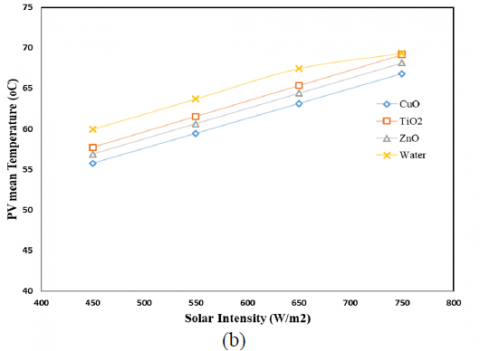
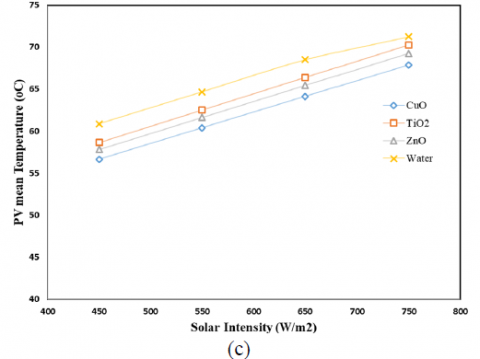
Figure 5 (b) and (c) show the effect of solar irradiance on the mean TPM module temperature for square tube and circular tube at a constant mass flow rate (2 L/min). But the difference from the previous figure for the rectangular shape of the tube is the TPM value, where the rectangular tube is better with the reduction in the TPM. This is due to the larger surface area of the rectangular tube.
The effect of varying percentages of nanofluid on mean TPM module temperature for rectangular tube under constant solar irradiation (750 W/m2) is shown in Figure 6. This graph shows that the mean TPM module temperature decreases as the percentage of Nanoluid increases.
Figure 5. Effect of Solar Irradiance on Tm at different nanofluid and constant flow rate (2L/min): (a) Rectangular tube, (b) Square tube, and (c) Circular tube
Figure 6. Effect of Solar Irradiance on Tm at different nanofluid and constant mass flow rate (2L/min)
3.2 Electrical efficiency
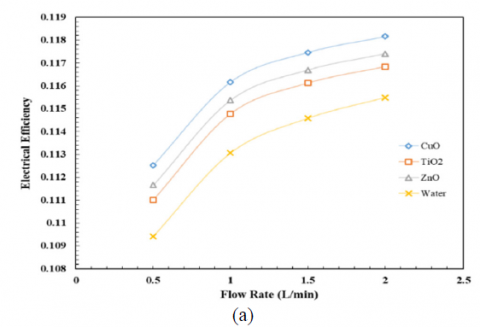
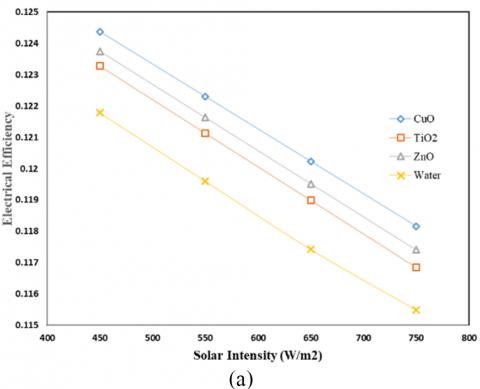
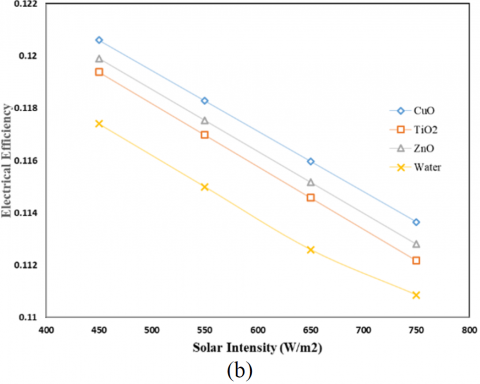
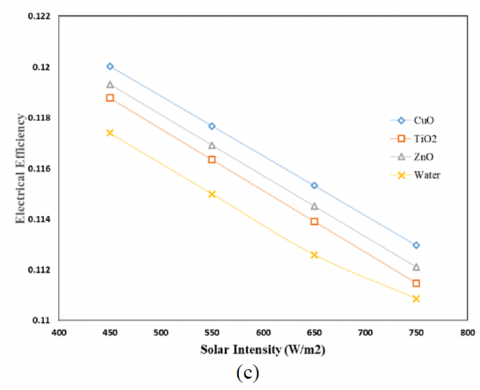
Electrical efficiency has been considered in this section. Consequently, Figure 7 (a) shows the influence of mass flow rate on electrical efficiency for rectangular tubes at constant solar irradiance (750 W/m2) and (b), (c) for square and circular tubes, respectively. From this figure, it can be noted that the electrical efficiency increases with an increased mass flow rate due to the decrease in Tpm in the collector. The effect of solar irradiance on electrical efficiency for a rectangular tube at a constant mass flow rate (2L/min) is shown in Figure 8 (a), and square and circular tubes are shown in Figure 8 (b) and (c), respectively. According to these figures, electrical efficiency declines with decreasing solar irradiation because to lower TPM in the collector.
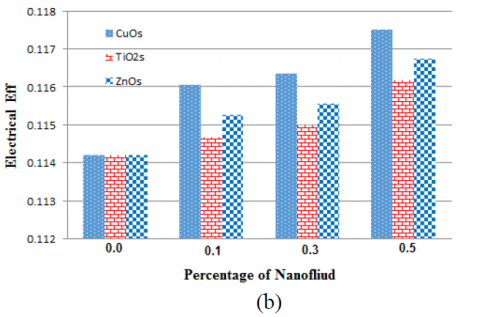
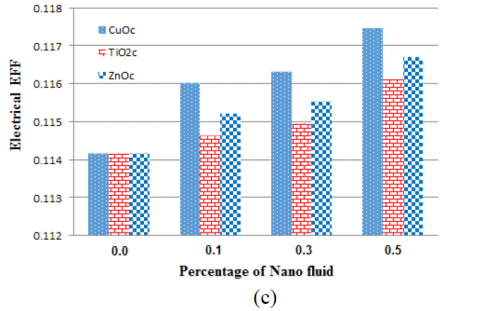
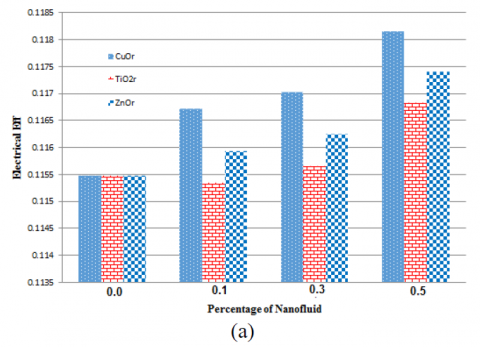
Compared with others types of nanofluid, it should be noted that the best electrical efficiency in the rectangular tube with CuO nanofluid was achieved. Figure 9 (a) shows the effect of different percentages of nanofluid on electrical efficiency for rectangular tubes at constant solar irradiance (750 W/m2) and (b) and (c) for square and circular tubes, respectively. Accordingly, the electrical efficiency increases with an increasing percentage of Nano fluid. Also, it should be noted that the best electrical efficiency in the rectangular tube with (50%) of CuO nanofluid was achieved.
Figure 7. Effect of Solar Irradiance on Tm at different nanofluid and constant mass flow rate (2L/min: (a) Rectangular tube, (b) Square tube, and (c) Circular tube
Figure 8. Effect of Solar irradiant on electrical efficiency: (a) Rectangular tube, (b) Square tube, and (c) Circular tube
Figure 9. Effect of different percentage of nanofluid on electrical efficiency at solar irradiance 750 W/m2: (a) Rectangular tube, (b) Square tube, and (c) Circular tube
3.3 Outlet temperature
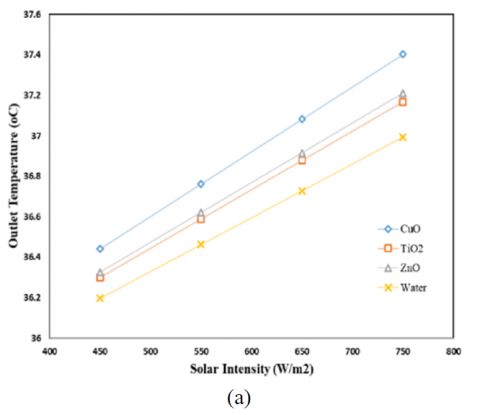
This section shows the outlet temperature of nanofluids and water at constant solar irradiance (750 W/m2). Figure 10 (a) shows the effect of mass flow rate on outlet temperature for a rectangular tube at constant solar irradiance (750 W/m2) and (b), (c) for square and circular tubes, respectively. From these figures, it can be observed that the outlet temperature declines with augmenting mass flow rate. Also, it should be reported that the best outlet temperature in the rectangular tube is for CuO nanofluid.
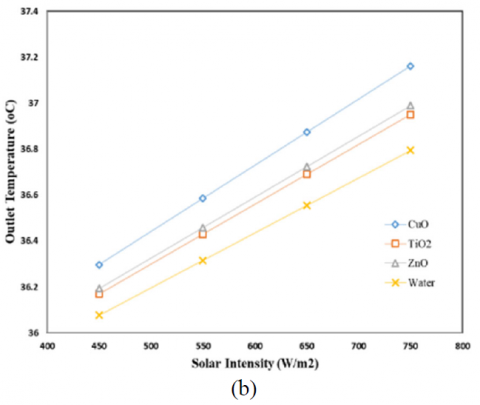
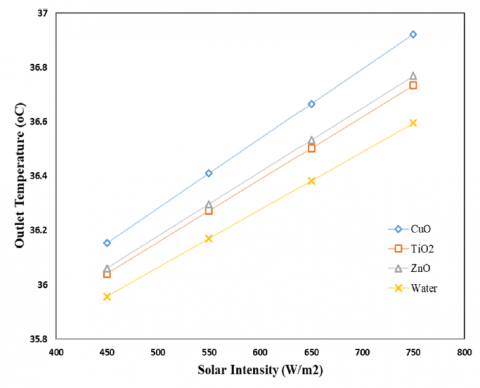
Moving to Figure 11 (a), which shows the Influence of solar irradiance on outlet temperature for a rectangular tube at a constant mass flow rate and (b) and (c) for square and circular tubes, respectively . From these figures, it can be remarked that the outlet temperature increases with increasing solar irradiance.
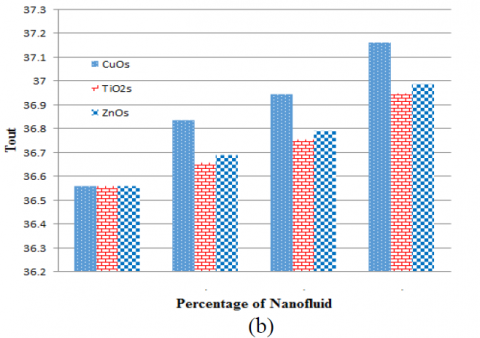
Figure 12 (a) shows the effect of the percentage of nanofluid on -outlet temperature for a rectangular tube at constant solar irradiance and (b) and (c) for-square and circular-tubes, respectively. Based on these figures, it can be reported that the outlet temperature goes up as the percentage of nanofluid goes up.
Figure 10. Influence of mass flow rate on outlet temperature for different tube at constant solar irradiance (750 W/m2): (a) Rectangular tube, (b) Square tube, and (c) Circular tube
(c)
Figure 11. Impact of solar Irradiance on outlet temperature for different tube at constant solar irradiance (750 W/m2): Rectangular tube, (b) Square tube, and (c) Circular tube
3.4 Thermal efficiency
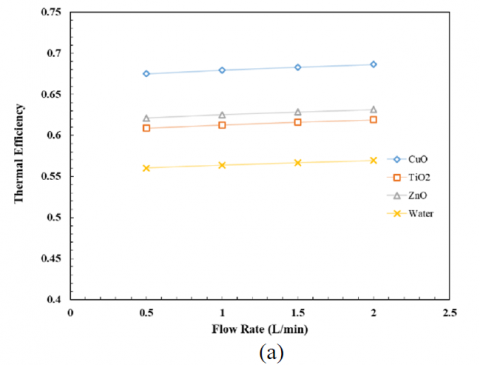
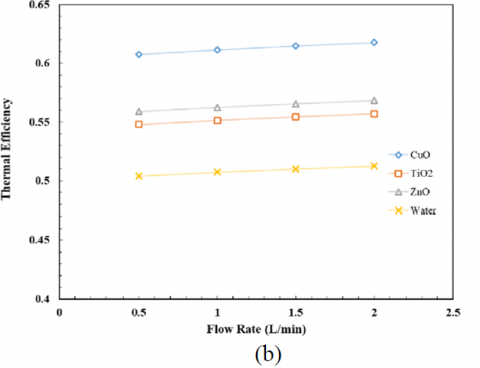
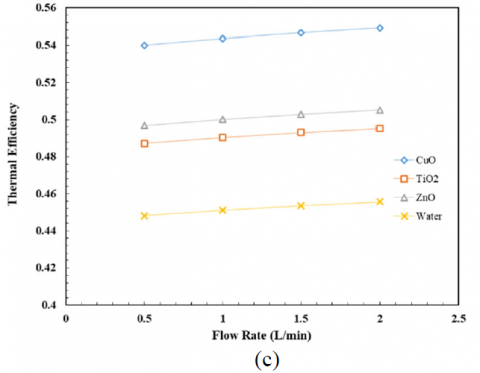
The thermal efficiency of the PVC system depends on several variables, the most important of which is the flow, the intensity of solar radiation, and the type of fluid used in the cooling process. Therefore and according to Figures 13 and 14, it can be observed that the thermal efficiency augments with a growth in the amount of flow, which is a linear relationship.
It can be seen that the thermal efficiency of the CuO/nanofluids is higher than the rest of the fluids used, reaching 0.675 at a flow of 0.5 L/min and rising to 0.6862 when increasing the flow to 2 L/min. This means that the use of CuO/nanofluids instead of water increases the thermal efficiency approximately by 0.1168. From Fig. 13a, it's clear that the rectangular section has a higher thermal efficiency than the square section in Figure 13 (b) and the circular section in Figure 13 (c).
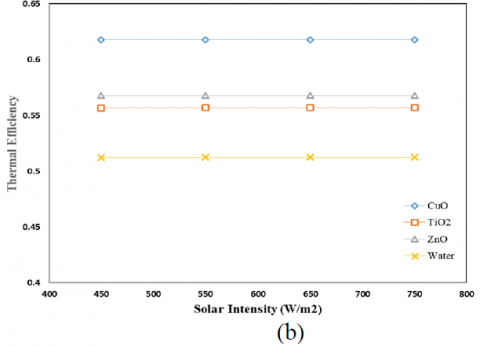
Figure 14 Illustrations the association between the intensity of solar radiation and the thermal efficiency of three different flow cross sections. It can be seen that solar radiation does not affect in a natural way the value of thermal efficiency, and this can be explained according to the following relationship:
$\eta=\frac{m c_p \Delta T}{I A}$ (21)
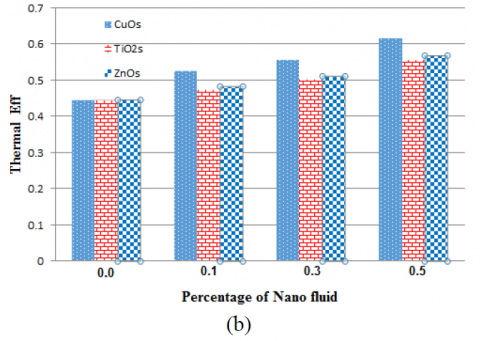
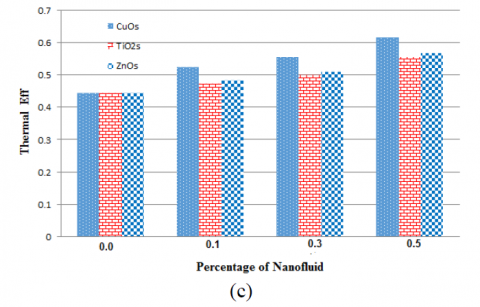
Figure 15 viewing the influence of the concentration of nanoparticles on the thermal efficiency, as the increase in the efficiency value can be observed with the increase in the nanoparticle percentage. Where the efficiency increased from 0.583 to 0.6863 when increasing the concentration of (CuO) from 0.1 % to 0.50%. This is because the increase in concentration leads to an improvement in the thermal properties of the fluid, and thus the heat absorbed by the fluid will increase, and then the temperature difference will increase due to the fact that there is less time between entry and exit, thermal efficiency increases between the two.
As the denominator in the above equation, solar radiation, goes up, the temperature difference will also go up. This means that the effect of radiation on the value of thermal efficiency won't be very noticeable.
Figure 15 viewing the influence of the concentration of nanoparticles on the thermal efficiency, as the increase in the efficiency value can be observed with the increase in the nanoparticle percentage. Where the efficiency increased from 0.583 to 0.6863 when increasing the concentration of (CuO) from 0.1 % to 0.50%. This is because the increase in concentration leads to an improvement in the thermal properties of the fluid, and thus the heat absorbed by the fluid will increase, and then the temperature difference will increase due to the fact that there is less time between entry and exit, thermal efficiency increases between the two.
Figure 12. Impact percentage of nanofluid on outlet temperature for different tube at constant solar irradiance (750 W/m2): (a) Rectangular tube, (b) Square tube, and (c) Circular tube
Figure 13. Impact of mass flow rate on thermal efficiency for different types tube at constant solar irradiance (750 W/m2): (a) Rectangular tube, (b) Square tube, and (c) Circular tube
Figure 14. Impact solar radiation on thermal efficiency for different types tube at constant solar irradiance (750 W/m2): (a) Rectangular tube, (b) Square tube, and (c) Circular tube
Figure 15. Impact of nanofluid Concentration on thermal efficiency for different types tube at constant solar irradiance (750 W/m2): (a) Rectangular tube, (b) Square tube, and (c) Circular tube
3.5 Temperature distribution
By using the COMSOL software to find a numerical solution, it is possible to find out how the temperature is distributed on the photovoltaic cell and in the cooling fluid. With this information, it is possible to place the cooling tube behind the cell in the most efficient way.
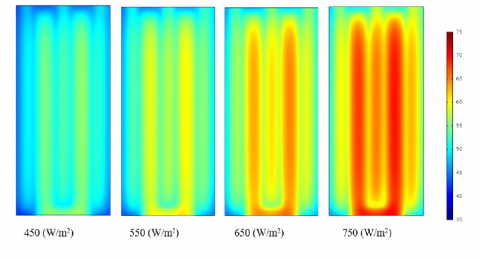
Figures 16 and 17 show the temperature distribution of PVC for different values of solar intensity. Where it can be observed that the cell surface temperature increases with an increase in the value of solar radiation and that the highest temperature of the cell surface appears through the spaces between the tubes and decreases gradually until it reaches the lowest value at the surface in contact with the tube, so the process of arranging the tube on the back of the cell must cover the largest possible area Taking into account the length of the tube used in this process.
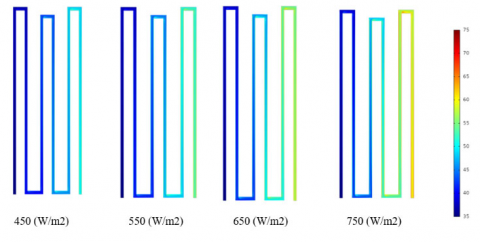
As for Figure 18, it shows the temperature distribution through the cooling fluid. The temperature of the fluid is seen to rise in the second half of the PV cell. Therefore, the half of the PV cell that is close to the inlet region may be cooler than the half adjacent to the fluid exit region. The amount of volume flow is an important factor in the temperature distribution on the cell surface, as it can be seen from Figure 19 that increasing the volumetric flow effectively reduces the cell temperature to make the cell temperature more uniform.
Figure 16. Front view of PVC for different value of solar intensity at 2 L/min
Figure 17. Temperature distribution of coolant fluid of PVC for different value of solar intensity at 2 L/min value of solar intensity at 2 L/min
Figure 18. Temperature distribution of front view of PVC for different value of flow rate at 750 W/m2 solar intensity
To develop a numerical model of the photovoltaic thermal collectors (PVT) with various absorber configurations and types of nanofluids, four PVT absorber collectors were designed and simulated using water and different types of nanofluids (CuO, ZnO, and TiO2).
Herein, the study investigated the optimal (absorber tube dimensions, absorber tube design, and type of nanofluid). Three types of tubes were used in these designs (round tube, square tube, and rectangular tube). The findings show that it was found that the rectangular tube [w=20mm, d=15mm] resulted in the highest efficiency compared to the round tubes, due to the flat surface being in contact underneath the PV module. Besides, nanofluids (CuO, ZnO, and TiO2) enhanced the electrical and thermal PVT efficiency as opposed to using water as a base fluid. CuO nanofluid showed the best heat transfer coefficients, followed by ZnO and TiO2. Furthermore, CuO nanofluid reduced the PV module temperature from 69.62°C to 56.65°C and increased the PV efficiency to 11.94%. This phenomenon can be attributed to the fact that the thermo-physical properties of CuO-water were higher compared to the thermo-physical properties of the other nanofluids and pure water.
|
Ac |
Function of the collector area (m2) |
|
Cb |
Conductance of the bond between the fin and tube |
|
Cp |
Specific heat of the collector cooling medium (J/kg K) |
|
Dh |
Hydraulic diameter |
|
EAC |
AC energy output at time t (min), h (hour), d (day), m (month) |
|
EDC,d |
Daily net DC energy output (kWh/d) |
|
F |
Fin efficiency factor |
|
F− |
Corrected fin efficiency |
|
FR |
Heat removal efficiency factor |
|
I(t) |
Solar irradiance (w/m2) |
|
hfi |
Heat transfer coefficient of fluid (W/m2 K) |
|
Ht |
Plane-of-Array (POA), solar irradiation (kwh/m2) |
|
Kabs |
Absorber thermal conductivity |
|
Kpv |
Photovoltaic module conductivity |
|
Labc |
Absorber thickness |
|
LPV |
Photovoltaic module thickness |
|
m• |
Mass flow rate (kg/s) |
|
PPV, rated |
PV array rated power (kw) |
|
Qu |
Actual useful heat gain (W) |
|
S |
Absorbed solar energy (W) |
|
Tp |
Photovoltaic collector temperature (℃) |
|
Ta |
Ambient temperature (℃) |
|
Tfi |
Inlet fluid temperature (℃) |
|
Tfo |
Outlet fluid temperature (℃) |
|
UL |
Overall collector heat loss coefficient (W/m2 K) |
|
W |
Tube spacing (m) |
|
YA |
The array yield (kWh/kWp) |
|
YF |
The final yield (kWh/kWp) |
|
B |
dimensionless heat source length |
|
CP |
specific heat, J. kg-1. K-1 |
|
g |
gravitational acceleration, m.s-2 |
|
k |
thermal conductivity, W.m-1. K-1 |
|
Nu |
local Nusselt number along the heat source |
|
$\alpha$ |
thermal diffusivity, m2. s-1 |
|
$\beta$ |
thermal expansion coefficient, K-1 |
|
$\phi$ |
solid volume fraction |
|
$\theta$ |
dimensionless temperature |
|
$\mu$ |
dynamic viscosity, kg. m-1.s-1 |
[1] Mohammed Hussein, H. A., Zulkifli, R., Mahmood, W. M. F. B. W., & Ajeel, R. K. (2022). Structure parameters and designs and their impact on performance of different heat exchangers: A review. Renewable and Sustainable Energy Reviews, 154, 111842. https://doi.org/10.1016/j.rser.2021.111842
[2] Ajeel, R. K., Sopian, K., & Zulkifli, R. (2021). Thermal-hydraulic performance and design parameters in a curved-corrugated channel with L-shaped baffles and nanofluid. Journal of Energy Storage, 34, 101996. https://doi.org/10.1016/j.est.2020.101996
[3] Ajeel, R. K., Salim, W. I., & Hasnan, K. (2019). Design characteristics of symmetrical semicircle-corrugated channel on heat transfer enhancement with nanofluid. International Journal of Mechanical Sciences, 151, 236- 250. https://doi.org/10.1016/j.ijmecsci.2018.11.022
[4] Rajaee, F., Kasaeian, A., Rad, M. A. V., & Aliyon, K. (2021). Energetic and exergetic evaluation of a photovoltaic thermal module cooled by hybrid nanofluids in the microchannel. Solar Energy Advances, 1, 100005. https://doi.org/10.1016/j.seja.2021.100005
[5] Mustafa, W., Othman, M. Y., & Fudholi, A. (2017). Numerical investigation for performance study of photovoltaic thermal nanofluids system. International Journal of Applied Engineering Research, 12(24), 14596-14602. http://www.ripublication.com/ijaer17/ijaerv12n24_86. pdf
[6] Khanjari, Y., Pourfayaz, F., & Kasaeian, A. B. (2016). Numerical investigation on using of nanofluid in a water-cooled photovoltaic thermal system. Energy Conversion and Management, 122, 263-278. https://doi.org/10.1016/j.enconman.2016.05.083
[7] Lari, M. O., & Sahin, A. Z. (2017). Design, performance and economic analysis of a nanofluid- based photovoltaic/thermal system for residential applications. Energy conversion and management, 149, 467-484. https://doi.org/10.1016/j.enconman.2017.07.045
[8] Bellos, E., & Tzivanidis, C. (2020). Yearly performance of a hybrid PV operating with nanofluid (vol 133, pg867, 2017). Renewable Energy, 155, 1444-1444. 10.1016/j.renene.2019.12.028
[9] Sultan, S. M., & Tso, C. P. (2018, November). A thermal performance study for different glazed water based photovoltaic thermal collectors. In AIP Conference Proceedings (Vol. 2030, No. 1, p. 020307). AIP Publishing LLC. https://doi.org/10.1063/1.5066948
[10] Rawat, P., & Sudhakar, K. (2016). Performance analysis of partially covered photovoltaic thermal (PVT) water collector. International Journal of Research in Engineering and Technology, 5(1), 15-20. https://d1wqtxts1xzle7.cloudfront.net/
[11] El Fouas, C., Cherecheș, N. C., Hudișteanu, S. V., Hajji, B., Țurcanu, E. F., & Cherecheș, M. L. (2022). Numerical and Parametric Analysis for Enhancing Performances of Water Photovoltaic/Thermal System. Applied Sciences, 12(2), 646. https://doi.org/10.3390/app12020646
[12] Rejeb, O., Dhaou, H., & Jemni, A. (2015). A numerical investigation of a photovoltaic thermal (PV/T) collector. Renewable Energy, 77, 43-50. https://doi.org/10.1016/j.renene.2014.12.012
[13] Ajeel, R. K., Sopian, K., & Zulkifli, R. (2021). A novel curved-corrugated channel model: Thermal-hydraulic performance and design parameters with nanofluid. International Communications in Heat and Mass Transfer, 120, 105037. https://doi.org/10.1016/j.renene.2014.12.012
[14] Ajeel, R. K., Salim, W. I., Sopian, K., Yusoff, M. Z., Hasnan, K., Ibrahim, A., & Al-Waeli, A. H. (2019). Turbulent convective heat transfer of silica oxide nanofluid through corrugated channels: An experimental and numerical study. International Journal of Heat and Mass Transfer, 145, 118806. https://doi.org/10.1016/j.ijheatmasstransfer.2019.1188 06
[15] Ajeel, R. K., Salim, W. I., & Hasnan, K. (2019). Influences of geometrical parameters on the heat transfer characteristics through symmetry trapezoidal- corrugated channel using SiO2-water nanofluid. International Communications in Heat and Mass Transfer, 101, 1-9. https://doi.org/10.1016/j.icheatmasstransfer.2018.12.0 16
[16] Ajeel, R. K., Salim, W. I., & Hasnan, K. (2018). Thermal and hydraulic characteristics of turbulent nanofluids flow in trapezoidal-corrugated channel: Symmetry and zigzag shaped. Case studies in thermal engineering, 12, 620-635. https://doi.org/10.1016/j.csite.2018.08.002