T. Rani | S. Suganya | S. Thanikaikarasan | P. Karpagavinayagam | C. Vedhi* | D. Kanagavel
© 2023 IIETA. This article is published by IIETA and is licensed under the CC BY 4.0 license (http://creativecommons.org/licenses/by/4.0/).
OPEN ACCESS
Determination of water quality is one of the most important aspects in groundwater studies. People around the world have used groundwater as a source of drinking water, and even today more than half the world’s population depends on groundwater for survival. Higher concentrations of heavy metals presentation is very serious problem as these metals leach into ground water or soil, which is detrimental to human health. Ground water pollution is a consequence of several activities like chemical manufacturing, painting and coating and mining. Metals exert a deleterious effect on fauna and flora of lakes and streams. The present studies, determination of metals were carried out from both well and borewell water of Neyveli of Cuddalore district in Tamil Nadu (India). Method was used as differential pulse anodic stripping voltammeter (DPASV) at glassy carbon electrode (GCE) vs Ag/AgCl. Determination of heavy metals was done in pH 4.0. The samples were subjected to analysis for elements like Zn, Cd, Pb, Fe, As and Cu by using electrochemical technique for determination of trace metal concentration up to 1 part per million (ppm). The concentrations of these metals in the study area were compared with drinking water quality limits given by the World Health Organization (WHO).
Heavy metals, Voltammetry, DPASV, GCE
Increased urbanization and industrialization are to be blamed for an increased level of trace metals, especially heavy metals, in our waterways. There are over 50 elements that can be classified as heavy metals, 17 of which are considered to be very toxic and relatively accessible. Toxicity level depends on the type of metal, its biological role and the type of organisms that are exposed to it [1, 2]. Many dangerous chemical elements if released into the environment accumulate in the soil and sediments of water bodies [3]. Characteristically, also the anions have its important role in drinking water; results also showed affecting the human health [4]. Heavy metals have a marked effect on the aquatic flora &fauna which through biomagnifications enters the food chain and ultimately affect the human beings as well [5]. The heavy metals in drinking water linked most often to human poisoning are lead, iron, cadmium copper, zinc, chromium etc. They are required by the body in small amounts, but can also be toxic in large doses. However, mining, pouring, casting, processing, and inappropriate disposal of heavy metals have made them hazardous pollutants to the environment. Heavy-metal pollution poses severe threat to ecological systems and presents a great challenge for global sustainability.
Numerous determine platforms, including colorimetric, fluorescent, and electrochemical methods, have already been adopted to fabricate miniaturized portable devices for heavy metal detections [6]. Among them, the electrochemical method has attracted intensive attention due to its capability for achieving better quantitative results, more rapid analysis, and higher sensitivity [7-9]. However, for the electrochemical determination of trace amounts of heavy metals, on the working electrode with active electrocatalysts, which are supposed to have high collection capacity of target metal ions.
The water samples were collected from Cuddalore district, Vadalur region, Tamilnadu state, India. The samples were collected from regions nearer to mining area. The samples were randomly collected within the mining region. Samples were collected from January 2016 to December 2016, in order to study the effects of seasonal variation in the concentration of heavy metals.
Water samples from borewell were collected and stored in polyethylene containers as per the standard protocols. The collected water samples were filtered with Whatman filter paper to remove any suspended particulate matter. After filtration, the water samples were maintained in laboratory and used as such.
Electrochemical experiments were performed using CHI 650C electrochemical workstation. A three-electrode system was used consisting of a glassy carbon electrode (GC) as a working electrode, an Ag/AgCl as a reference electrode and a Pt-wire as an auxiliary electrode. Metal concentration was studied and measured by CV and DPSV respectively. The anodic scan was initialised at -1.0V and stopped at 1.2V.
Physical parameters include temperature and colour of water while chemical parameters include TDS, pH, calcium, magnesium, sodium, chlorine, sulphate, nitrate, Iron, dissolved oxygen contents, BOD, COD and electrical conductivity.
All the water samples were found to be colourless except during Nov-Dec season due to rainfall. pH is the most important factor to determining the corrosive nature of water. The pH for all water samples was range between 6.7 and 7.7 indicating it is almost nearby neutral condition. DO is one of the most important parameter for water quality. It gives direct and indirect information about bacterial activity, photosynthesis, availability of nutrients, etc [9]. Dissolved oxygen decreased at first and gets increased due to increase in temperature in the summer and also due to increased microbial activity [10]. Dissolved oxygen content is within the range of 3.0 to 5.5 mg/L. The high DO in summer is due to increase in temperature and duration of bright sunlight has influence on the % of soluble gases (O2 & CO2).
BOD is a measure of organic material contamination in water, specified in mg/L. It is the amount of dissolved oxygen required for the biochemical decomposition of organic materials and the oxidation of certain inorganic materials (e.g., iron, sulphites). COD is another measure of organic material contamination in water specified in mg/L. COD is the amount of dissolved oxygen required to cause chemical oxidation of the organic material in water. Both these factors are key indicators of the environmental health.
It is measured by nephelometric method in which the concentration of turbidity is measured against the known concentration of synthetically prepared sulphate solution. Barium chloride is used for producing turbidity due to barium sulphate and a mixture of organic substance (Glycerol or Gum acetia) and sodium chloride is used to prevent the settling of turbidity.
3.1 Surface morphology
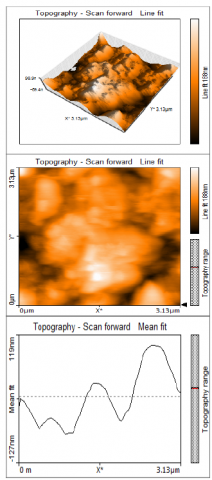
Surface characterization is very important for sensor of determination of environmental samples. Figure 1 shows the surface morphologies of GCE particle distribution graphs and surface roughness values. Bare glassy carbon electrode (GCE) showed a homogeneous surface with fine lines corresponding to mechanical alumina polishing.
Figure 1. AFM image of GCE
3.2 Electrochemical impedance spectroscopy
The electrical conductivity is the most important property for electrodes and impedance measurements were used for conductivity studies as well as to elucidate mechanism and kinetics of chemical and electrochemical reactions on surface. Figure 2 shows the typical Nyquist plots of GCE in 0.1M H2SO4. Electrochemical impedance spectroscopy was employed to obtain equivalent circuit parameters such as the charge transfer resistance and ohmic resistance. The impedance plots show a distorted semi-circle in the high-frequency region due to porosity of electrode and a vertically linear spike in the low-frequency region [11]. The diameter of the semi-circle gives an approximate value of the charge transfer resistance (Rct) of the electrodes.
Figure 2. Nyquist plots of GCE in 0.1M H2SO4
3.3 Electrochemical studies
The effect of pH was studied from 1.0 to 13.0 by voltammetrically. The potentials and currents were measured for the oxidation peaks and correlated with pH to understand the influence of pH. From the curve the maximum peak current was obtained at pH 4.0. This may be due to faster electron transfer rate at medium pH 4.0 and this indicates that the rate of the reaction is controlled only by electron transfer. From this study it is concluded that pH 4.0 was the best pH for further voltammetric studies and the development of electrochemical method for the determination of heavy metals.
Cyclic Voltammetric studies of 1 mL of water sample were performed for selected five different pHs. The CVs were obtained for GCE working electrode and scanned between -1.0 and 1.2 V at scanning rate 50 mV/s. The cyclic voltammetric behavior of water sample on bare glassy carbon electrode was studied at pH 4.0. Cyclic voltammogram shows four anodic oxidation peaks and four cathodic reduction peaks. The anodic peaks representing Zn, Pb, Cu and Fe around potential -0.65, -0.15, 0.45 and 0.7 V in the forward scan and the cathodic peaks representing Zn, Pb, Cu and Fe around potential -0.55, -0.10, 0.50 and 0.75 V in the backward scan (Fig. 3).
Figure 3. Cyclic voltammetric behaviour of water sample at pH 4.0 Effect of Scan rate
The plot of peak current versus scan rate exhibited straight line with good R - squared values. The R - squared values obtained from the straight line plot are found to be 0.983 (Fe) and 0.986 (Cu). The plot of peak current versus square root of scan rate resulted in straight line as depicted in Fig. 4. Hence it can be inferred that the oxidation at pH 4.0 was an adsorption controlled reaction.
Figure 4. Plot of peak current against scan rate on GCE at pH 4.0
3.4 Differential pulse stripping voltammetric (DPSV) analysis using GCE
The study of DPSV on glassy carbon electrode, a preliminary confirmation experiment was tried. The test solution of the individual metal ions (Zn, Pb, Cd, As, Cu and Fe) purged with nitrogen gas for 20 minutes and suitable accumulation potential was applied to the electrode. The solution was stirred throughout of 120 seconds of accumulation period. After a 10 seconds rest period, a differential pulse sweep under default conditions was run. All the metals exhibited very good stripping signals. A systematic study of various instrumental parameters that affect the stripping response has been carried out with 5-ppm concentration of metal ions to establish the optimum conditions.
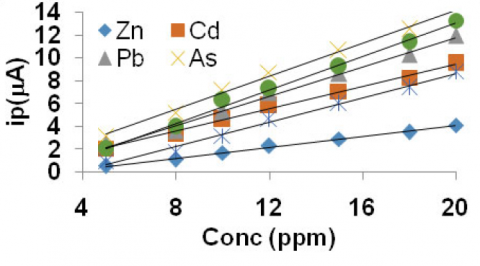
The calibration plot equations of Zn, Pb, Cd, As, Cu and Fe were obtained and used for quantification of amount in ground water. As discussed earlier, the peak current values for Zn, Pb, Cd, As, Cu, and Fe were found to be 0.5568, 0.3736, 0.8448, 2.217, 0.9234 and 3.451 ppm respectively (Fig. 6).
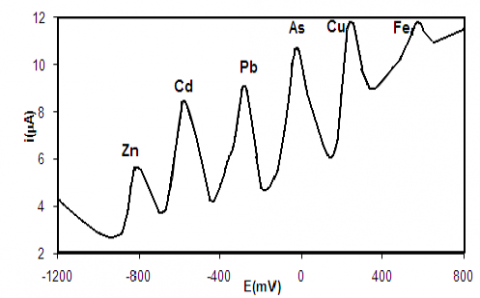
Figure 5. Differential pulse stripping voltammogram of 10 ppm metals solution on GCE under optimum experimental conditions
Figure 6. DPSV calibration plot of metals on GC electrode
After optimization of pH for ground water was analyed. The voltammetric behavior of water sample in pH 4.0 was selected for optimum pH of further electrochemical studies of heavy metals in ground water sample. Straight line plot of peak current versus scan rate by CV for glassy carbon electrodes suggested that the overall reaction was adsorption controlled. Differential pulse anodic voltammograms represented the heavy metals of Zn, Pb, Cd, As, Cu and Fe on bare GCE. From the calibration plots, of Zn, Pb, Cd, As, Cu and Fe in water were measured quantitatively. This made the system promising to be used in routine analytical applications.
The authors are extremely grateful to Department of Science and Technology (FAST TRACK and FIST) New Delhi, India for using CHI Electrochemical workstation and UGC New Delhi, INDIA for using FTIR spectrometer and AFM at V.O.Chidambaram College, Tuticorin-8. Tamilnadu, India.
[1] Seema Sing, Swati Lal, Jeena Harjit, Sulbha Amlathe, H.C.Kataria, 3(2011)239-246
[2] Yinxiu Zuo, Jingkun Xu, Xiaofei Zhu, Xuemin Duan, Limin Lu, Yongfang Yu, Microchimica Acta1, (2019)1-17
[3] Abida Begum, S. Harikrishna, Irfanullah Khan, International Journal of Chem Tech Research. CODEN(USA):IJCRGG ISSN:0974- 4290. 1(2009) 245-249.
[4] Sardar Khana, Maria Shahnaz, Noor Jahana, Shafiqur Rehmana, M.Tahir Shahc, Islamud Dind, Journal of cleaner Production xxx (2012)1-9.
[5] Ram S .Lokhande, Pravin. U.Singare, Deepali S.Pimple, Resources and Environment 1(2011)13-19
[6] G. Aragay, J.Pons, A. Merkoçi, Recent trends in macro-,micro-, and nanomaterial-based tools and strategies for heavy-metal detection. Chem. Rev. 111(2011) 3433−3458
[7] J.Li, S. Guo, Y. Zhai, E.Wang, High-sensitivity determination of lead and cadmium based on the Nafion-graphene composite film. Anal. Chim. Acta, 649(2009) 196−201.
[8] Z.Nie, C. A. Nijhuis, J. Gong, X. Chen, A. Kumachev, A. W.Martinez, M. Narovlyansky, G. M. Whitesides, surfactant." Talanta 68, no. 3 (2006): 686-692. Electrochemical sensing in paper-based microfluidic devices. Lab Chip 2010, 10, 477− 483.
[9] Liu-Liu Shen, Gui-Rong Zhang, Wei Li, Markus Biesalski, Bastian J. M. Etzold, ACS Omega 2017, 2, 4593−4603
[10] Radhakrishnan, R. Muthukannan, U. Kamatchi, Chepuri R K Rao and M. Vijayan, Indian Journal of Chemistry, 2011, 50A, 970.
[11] Manisankar, P., G. Selvanathan, and C. Vedhi. "Determination of pesticides using heteropolyacid montmorillonite clay-modified electrode with surfactant." Talanta 68, no. 3 (2006): 686-692.
[12] Manisankar, P., G. Selvanathan, and C. Vedhi. "Utilization of sodium montmorillonite clay-modified electrode for the determination of isoproturon and carbendazim in soil and water samples." Applied clay science 29, no. 3-4 (2005): 249-257.