Gong Chen* | Yan Wang | Yang Xu | Ying Zhu | Jieling Li | Wei Wang | Xuelian Li
© 2022 IIETA. This article is published by IIETA and is licensed under the CC BY 4.0 license (http://creativecommons.org/licenses/by/4.0/).
OPEN ACCESS
Flexibility makes output voltage-current curve of thin crystalline silicon solar cell’s photovoltaic (PV) array stair-stepping and corresponding power-voltage curve possessing non-uniform illumination characteristics, so existing conventional PV array model is no more suitable and it is necessary to build a new mathematical model of PV array that is suitable for flexibility condition. Based on engineering model of PV array and combining with series-parallel connection of electric circuit, the PV array under flexibility is analyzed in detail and it is derived theoretically that the mathematical model of PV array under flexibility can be expressed by piecewis function.
flexibility degree, photovoltaic array, array model
Flexible substrate thin-film solar battery [1-3] refers to a battery fabricated on a flexible material (such as stainless steel, polyester film), Using the polymer polyimide as a flexible substrate, the amorphous silicon solar battery prepared has a total thickness of about 1001Lm (including encapsulation layer), a power-mass ratio of more than 500W/kg, nearly ten times higher than stainless steel substrate amorphous silicon battery. So it is the world's lightest solar battery [4-7].
The research progress of flexible substrate thin film batteries in China is slow relatively. In the mid-1990s, Harbin Chroma Company developed an amorphous silicon single junction thin film battery on a flexible polyimide substrate. The initial efficiency of the battery was 4.63%, and the power to mass ratio was 231.5 W/kg [8]. Generally speaking, domestic research on flexible substrates is still in its infancy, and there is a big gap with foreign countries.
The papers about solar photovoltaic greenhouses showed that most of them were in the research stage of conventional monocrystalline silicon and polycrystalline silicon. The research data of photovoltaic greenhouse with flexible photovoltaic film is rare. They still concentrate on the research of computer simulation. Domestic and foreign researches on the characteristics of amorphous silicon flexible thin film solar cells include: Asano [9] studied the electrochemical performance of amorphous silicon flexible thin film solar batteries using PSE film as substrate, Weerasinghe studied the preparation process and electrical properties of flexible thin film solar battery based on plastic, Nagata [10] studied the bending resistance and durability of the flexible thin film solar battery based on aerospace plate under dynamic load.
In the field of array model research, a method of photovoltaic array modeling based on mathematical model is proposed in reference [11], but the influence of shading condition is not considered. In [12], the effects of shadow conditions and array structure on the output characteristics of the array are considered. The characteristic model of the photovoltaic array is established. The model can accurately reflect the output characteristics of the photovoltaic array under different conditions. In [13], the Lambert W function is used to express the U-I relationship of photovoltaic arrays. In the mathematical model and engineering model are used to model the array. The accuracy can be satisfied, but the model itself contains a large number of exponential operations and logarithm operations, so the model of the array has a larger amount of calculation and requires higher performance on the operating platform.
This paper is based on the actual flexible crystalline silicon solar cell’s photovoltaic (PV) array, as shown in Figure 1, in which 8*18 array are connected in series and parallel.
Figure 1. Flexible crystalline silicon solar cell’s photovoltaic (PV) array
$I_{p v}=I_{p h}-I_{0}\left\{\exp \left[\frac{q\left(V+I R_{s}\right.}{A K T}\right]-1\right\} -\frac{V+I R_{s}}{R_{s h}}$ (1)
In formula (1) of traditional model, V is the measured voltage from both ends of the photovoltaic cell. I is the current in the external loop of the photovoltaic cell.Rs is the series resistance. A is the quality factor of diode. K is the Boltzmann constant value. T is the standard temperature. I0 is the reverse saturation current of the diode. Idis the current through the diode. q is the charge of the electron.
Figure 2 is Nx2M photovoltaic array model. N modules are in series with 2M parallel modules. When the intensity of light decreases linearly, output current mathematical model from flexible photovoltaic array can be derived in formula (2). The biggest difference between proposed model and the traditional model is the representation of function. Piecewise function is used to describe light intensity in different regions of flexible photovoltaic array precisely.
Figure 2. Schematic diagram of flexible photovoltaic array model
$I=\sum_{i=1}^{m-1} I_{s c r e f} \frac{S_{i}}{S_{r e f}}(1+a \Delta T) N_{P}\{1-A\}$
$+I_{\text {scref }} \frac{S_{m}}{S_{r e f}}(1+a \Delta T) N_{P}\{1-A\}$
$+\sum_{i=m+1}^{2 m} I_{s c r e f} \frac{S_{i}}{S_{r e f}}(1+a \Delta T) N_{P}\{1-A\}$
$\left\{\begin{array}{l}A=\exp \frac{V_{\text {mref }}}{V_{\text {merf }}-V_{\text {ocref }}} \\ {\left[\exp \frac{U / N_{C}}{\left(\frac{V_{\text {mref }}}{V_{\text {ocref }}}\right)\left[\ln \left(1-\frac{I_{\text {mref }}}{I_{\text {scref }}}\right)\right]^{-1} V_{o c}}-1\right]} \end{array}\right\}$ (2)
From formula (2), NC is the number of serials batteries. NP is the number of parallel batteries. Iscref is the short-circuit current. Siis light intensity under different conditions. $S_{\text {ref }}=1000 \mathrm{~W} / \mathrm{m}^{2}$ is standard light intensity, $\Delta T=T-T_{r e f}, \quad T_{r e f}$=25℃, Vmref is maximum power point voltage, Vocref is the open circuit voltage, Imref is current for maximum power point, $I_{\text {scref }}$ is the short-circuit current, $V_{o c}=V_{\text {ocref }} \ln (e+ b \Delta T)(1-c \Delta T), a=0.0025 /{ }^{\circ} \mathrm{C}, \mathrm{b}=0.5 \mathrm{~m}^{2} / \mathrm{w}, \mathrm{c}=0.00288$.
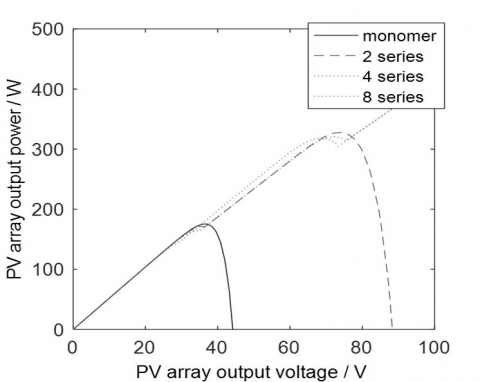
The initial light intensity was set at 1000.The interval is100.The temperature was set at 25 degrees. Figures 3-4 shows a 1*4 model. The voltage-current and voltage-power waveform diagrams are obtained by simulation.
The light intensity of the above four photovoltaic cells is fixed at 1000, which was the traditional model parameter. Same condition as above, the U-I and U-P waveforms are obtained by simulation.
The contrasts show that the U-I curve of traditional photovoltaic array is smooth. The reason is that the traditional mathematical model isn’t associated with the bending of photovoltaic panels.
(a)
(b)
Figure 3. Comparison of series output waveforms for flexible photovoltaic array ((a) U-I, (b) U-P)
(a)
(b)
Figure 4. Comparison of series output waveforms for traditional photovoltaic array ((a) U-I, (b) U-P)
It is considered that the light intensity on surface of the photovolaic array at any position is consistent. However, the mathematical model proposed in this paper considers the linear variation of light intensity during bending. It can be seen from Figure 5 that the trend of the flexible photovoltaic curve is consistent with that of the traditional curve. The emergence of the inflection point comes from two or more bending series and parallel photovolaic array. The reason is that the intensity of light received by the series and parallel photovoltaic array is different.
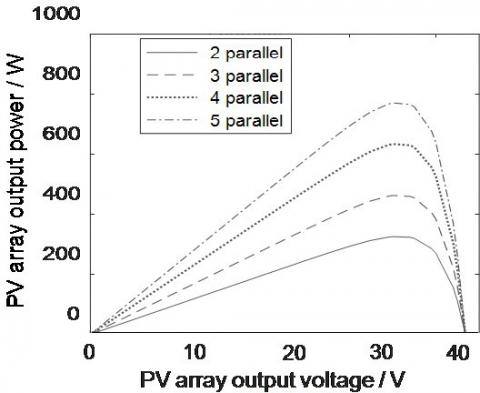
The figure below is the parallel diagram of three photovoltaic array, which is a simulation model diagram formed by the parallel structure diagram of photovoltaic array in theory. Meanwhile, light intensity is set 1000 to decline and the temperature is 25℃.
(a)
(b)
Figure 5. Comparison of waveform for flexible parallel array ((a) U-I, (b) U-P)
From the figure above, whether U-I or U-P waveform, the trend is roughly the same. There is little difference between flexible and traditional model. The voltage is always the same. In addition, when more photovolytaic cells are connected in parallel, the output current will also increase and decrease under a certain voltage. The output power shows linear in change. There is not too different between flexible and traditional model.
Figure 6 shows U-I or U-P waveforms of flexible parallel arrays and traditional parallel arrays.
(a)
(b)
(c)
(d)
Figure 6. Comparison of flexible parallel arrays and traditional parallel arrays ((a) U-I in series and parallel, (b) U-P in series and parallel, (c) U-I in series and parallel, (d) U-P in series and parallel)
By simulation, we find that there may be multiple peak points with different parameters. At this time, the voltage and current of the traditional formula will have some deviation, which is not applicable to the calculation of flexible photovoltaic array. Therefore, it is necessary to study the mathematical model of flexible photovoltaic array.
The circuit was built based on metal halide lamp, single crystal silicon flexible thin film photovoltaic panel, two adjustable potentiometers and two multimeters. Two parallel ground. The center of the light source could be guaranteed during the experiment. Then, a flexible photovoltaic panel was placed in the front of lamp. Finally, a wire from photovoltaic panel was connected to the circuit.
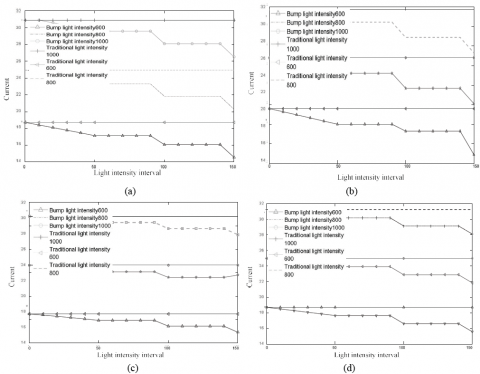
The bending degree is in proportion to h. When h shows zero, it means the traditional photovoltaic panel whose illumination interval decreases to zero. As the bending degree increases, the illumination interval also increases gradually. In order to compare, this paper simulates 3*3, 4*4 and 6*6 flexible photovoltaic panel models. By changing the illumination interval among batteries, illumination intensity is adjusted to simulate the change of the distance between the ends of the photovoltaic thin film panel. The comparison of simulation figures is as follows:
Figure 7. (a) Comparison of 6*6 models under three different light intensities, (b) Comparison of 5*5 models under three different light intensities, (c) Comparison of 4*4 models under three different light intensities, (d) Comparison of 3*3 models under three different light intensities
It can be clearly seen from the Figure 7 that when the light intensity is constant, the larger the bending degree is, the smaller the current will be. While the current of the traditional photovoltaic panel will not change. In the case of a certain bending degree, the greater the light intensity is, the greater the current will be. It can be seen that the current calculation of traditional photovoltaic panels is not suitable to flexible photovoltaic panels.
The luminous intensity is set as 1200 candela (cd) according to the empirical value, and the measured distance is 0.9m. Take the illumination intensity of 1000 as an example. In Figure 8, if the illumination interval is 10, E is set as 990; if the illumination interval is 20, E is set as 980, and so on. As curvature rises, the intensity of light E decreases. The illumination intensity of the point light source is 1000, 800 and 600, respectively.
By contrast, As the curvature of the photovoltaic panel increases, the current curve generally decreases. The farther the source is from the bump, the smaller the current, and the simulation results are basically consistent with the measured data.
Figure 8. (a) The light intensity is 1000, (b) The light intensity is 800, (c) The light intensity is 600, (d) Measured bending and current curves
4.2 Measurement
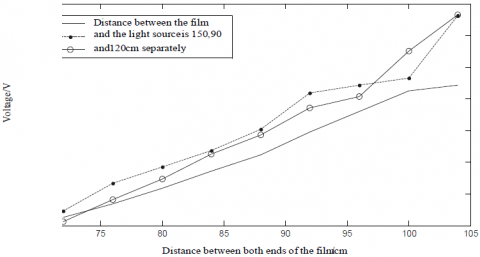
Set the distance between the film and the light source, change the distance between both ends of the film (i.e. curvature), and measure voltage and current of the photovoltaic film.
The distance between the light source and the center point of the film remains unchanged, when the film is convex and bent outward, the voltage and current will decrease with the decrease of the distance between the two ends of the film.
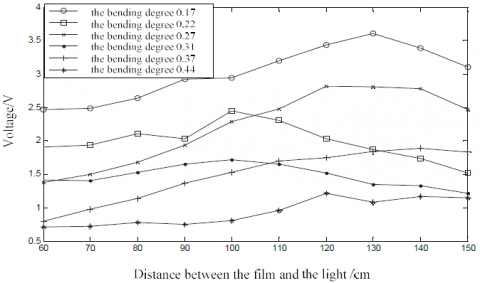
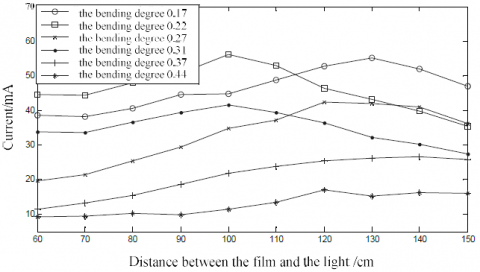
The bending degree of the film is fixed, and the influence of the distance between the light source and the film on the electrical parameters of the flexible photovoltaic panel is studied. Keep the film convex bending, set the bending degrees 0.17, 0.22, 0.27, 0.31, 0.37 and 0.44, change the distance between the film and the metal halide lamp light source, and measure the output voltage and current.
Figure 9. The distance between the light source and the convex point of the film is fixed, and the voltage change curve when the bending degree is changed
Figure 10. The distance between the light source and the convex point of the film is fixed, and the current change curve when the bending degree is changed
Figure 11. Keep the film bending constant, change the voltage curve when the distance between the film and the light source
Figure 12. Keep the film bending constant and change the current curve when changing the distance between the film and the light source
It can be seen from the Figures 9-12 that when the curvature of the convex curved film is constant, the farther the film center is from the light source, the lower the current and voltage; At the same distance, the greater the curvature, the smaller the electrical parameters of the film. It shows a nonlinear decreasing trend.
Therefore, the traditional electrical parameter method of rigid photovoltaic panel cannot describe the flexible photovoltaic panel accurately, which verifies the feasibility and practicability of this model.
The simulation shows that multiple peak points may appear depending on different parameters, at this time, the traditional calculation formula of the voltage and current of rigid photovoltaic array will have some deviation. It is not conducive to the accuracy of the results and is not applicable to the calculation of flexible photovoltaic array. It is necessary to study the mathematical model of flexible photovoltaic.
This work was financially supported by Key Laboratory of Nondestructive Testing (Nanchang Hangkong University), Ministry of Education (EW201980089).
[1] Green, M.A., Emery, K.H.Y., Warta, W., Dunlop, E.D. (2016). Solar cell efficiency tables (Version 47), Prog. Photovolt. Res. Appl., 24(1): 3-11.
[2] Bhattacharya, T., Chakraborty, A. K., & Pal, K. (2017). Computer simulation of the influence of shading on a solar photovoltaic array. International Journal of Ambient Energy, 38(5), 525-533. https://doi.org/10.1080/01430750.2016.1155484
[3] Asano, T., Kubo, T., & Nishikitani, Y. (2004). Electrochemical properties of dye-sensitized solar cells fabricated with PVDF-type polymeric solid electrolytes. Journal of Photochemistry and Photobiology A: Chemistry, 164(1-3), 111-115. https://doi.org/10.1016/j.jphotochem.2003.12.021
[4] Sun, X., Zhang, Q., Liu, Y., Huang, N., Sun, P., Peng, T., Zhao, X.Z. (2014). Photovoltaic performance improvement of dye-sensitized solar cells through introducing In-doped TiO2 film at conducting glass and mesoporous TiO2 interface as an efficient compact layer. Electrochimica Acta, 129: 276-282. https://doi.org/10.1016/j.electacta.2014.02.110
[5] Weerasinghe, H. C., Huang, F., & Cheng, Y. B. (2013). Fabrication of flexible dye sensitized solar cells on plastic substrates. Nano Energy, 2(2), 174-189. https://doi.org/10.1016/j.nanoen.2012.10.004
[6] Nagata, M., Baldwin, E., Kim, S., & Taya, M. (2013). Design of dye-sensitized solar cells integrated in composite panel subjected to bending. Journal of composite materials, 47(1), 27-32. https://doi.org/10.1177/0021998312459779
[7] Pascual, C., De Castro, J., Schueler, A., & Keller, T. (2017). Integration of dye solar cells in load-bearing translucent glass fiber-reinforced polymer laminates. Journal of Composite Materials, 51(7), 939-953. https://doi.org/10.1177/0021998316656393
[8] Shaoyan Li, (2008). Study on dye sensitized solar cells. Beijing Jiaotong University.
[9] Asano, T., Kubo, T., & Nishikitani, Y. (2004). Electrochemical properties of dye-sensitized solar cells fabricated with PVDF-type polymeric solid electrolytes. Journal of Photochemistry and Photobiology A: Chemistry, 164(1-3), 111-115. https://doi.org/10.1016/j.jphotochem.2003.12.021
[10] Nagata, M., Baldwin, E., Kim, S., & Taya, M. (2013). Design of dye-sensitized solar cells integrated in composite panel subjected to bending. Journal of composite materials, 47(1), 27-32. https://doi.org/10.1177/0021998312459779
[11] Wirth, G., Schroedter-Homscheidt, M., Zehner, M., Becker, G. (2010). Satellite-based snow identification and its impact on monitoring photovoltaic systems. Solar energy, 84(2): 215-226. https://doi.org/10.1016/j.solener.2009.10.023
[12] Ma, J., Wang, H., Zhang, P. (2011). Renewed investigation on power system stabilizer design. Science China Technological Sciences, 54(10): 2687-2693. https://doi.org/10.1007/s11431-011-4520-z
[13] Song, Z., Zhang, C., Yang, G., Feng, Y., Ren, G., Han, X. (2014). Comparison of biogas development from households and medium and large-scale biogas plants in rural China. Renewable and Sustainable Energy Reviews, 33: 204-213. https://doi.org/10.1016/j.rser.2014.01.084