Samson Isaac J* | Dhiviyalakshmi L | Anantha Christu Raj P | Sreepadmini R | Siva Sakthi A
© 2022 IIETA. This article is published by IIETA and is licensed under the CC BY 4.0 license (http://creativecommons.org/licenses/by/4.0/).
OPEN ACCESS
Injuries caused by falls are common among athletes. The field of sports mechanics and training are moving towards implementing green technology to evaluate the performance and training of the athletes. There is a need to understand the gait pattern of an individual for better understanding and planning. Gait analyses performed within a laboratory imposes restriction over an individual’s performance, which can influence the gait pattern intended to study. A shoe-integrated sensor system provides the freedom to move the subject freely, while at the same time provides information related to the gait pattern and fall events occur. MEMS sensors integrated shoes are developed to study the gait pattern for wellness monitoring among elders. The fall is detected by comparing the amount of the pressure distribution in the respective sensors with the accelerometer placed around the ankle. In this work, the presence of the abnormality in the gait pattern and the abnormal point are analysed. A shoe system with sensor design and interface with LabVIEW are developed. In case 1, the heel pressure is 35mV, the toe pressure is 9.2mV, acceleration value is 1.3mV and fall is no fall.
gait analysis, pressure sensors, MEMS accelerometer, falldetection, LabVIEW
Green technology is introduced in healthcare for monitoring the health of elders and sustainable product developments for gait assessment. Gait pattern of geriatric persons are highly influenced by the posture changes when they try to move from one state to other [1]. Gait analysis is an effective approach for understanding the characteristics of a person’s locomotion, especially in geriatric care [2]. In general people who are more concerned towards dynamics are people who engage in sports and physicians who plan and research in dynamics of human motion. Sports injury commonly causes ligament and tendon tear, which takes several months to heal and regain original strength, so avoiding injury is essential in sports. Physicians should have a better idea about the etiology of movements in the process of prediction and treatment for movement related abnormalities [3]. Timed up and Go (TUG) test are used to understand the neuro-motor signalling in patients with neurological disorder, which influences gait behaviour [4]. In diabetic neuropathy the studies show that the affected elderly show heterogeneous results in gait pattern. The common finding is that they spend longer duration of time in stance phase. Elders suffering neurological disorders like multiple sclerosis, Parkinson’s diseases show a predominant difference in their gait pattern [5]. Also the gait disturbance is affected and modified for individuals undergone total knee replacement and osteoarthritis and there is a need to study the gait individually to plan for the treatment and rehabilitation [6]. Gait disturbances can have various causes there are still unexplored reasons such as gait differs not only among individuals but the same individual who cannot manage similar gait pattern between successive steps is influenced by the ground force interaction [7]. Often, they arise due to neurological or orthopedic illnesses and require the use of atherapeutic attendance. There is already a multiplicity of Gait analysis systems on the market. Nevertheless, the gait analysis is not applied everywhere, but gait therapy is utilized [8-11].
Objectives and Contribution
Several works were previously presented in the literarure depending on gait analysis, utilizing multiple perspectives with features, there was previously a lot of research work in the literature. Some of them were reviewed here.
Faragó et al., [12] have explained a wearable smart system to monitor and intention assessment of foot biomechanics through gait. Kim et al., [13] have demonstrated to remove free features as spatiotemporal data of post stroke gait. Dostál et al., [14] have illustrated to recognition of features linked to accelerometric data obtained with 31 time-synchronized sensors positioned at dissimilar kinds of body. Kanko et al., [15] have provided 2 studies were executed for determining whether gait parameters scaled with marker less motion capture reveal synchronized authority using scaled marker based motion capture with pressure sensitive gait mat.
Gorst et al., [16] have presented new measures of lower limb somatosensory discrimination to determine whether they were psychometrically robust and whether they were identified with development results in individuals utilizing PD.Lower limb somatosensation asses 2 occasions at 3 to 7 days of intervals, utilizing, 3 novel tests such as the discrimination of gradient , roughness and step height. Also the static, dynamic balance (Testing the brief balance evaluations systems), falls incidence and confidence (falls efficiency scale) , gait (speed and step length) were attained. 27 members having PD with 27 healthy controls. Chen et al., [17] have explained robotic devices like knee exoskeletons in gait-rehabilitation provides proficient gait-training to patients, from the intensive labor, the physical therapists released. Additionally, knee exo-skeletons enhance the performance of humans by improving an ordinary as well as assigned walking and the strength of the wearer's knee joints.systematic examination such as the knee exo- skeletons were provided. Firstly, it presented the bio- mechanics of human knee joint. Subsequently, design concepts for knee exo-skeletons including actuators and sensors were presented, then, introduction of associated control techniques. Mouzo et al., [18] have elucidated a process to estimate certain contact forces from easy gait analyses. It generates building computational multi- dimensional methods of subject, devices, directs forward dynamics analysis of the orthoses given the object as the captured motion. At least one force/torque sensor must be involved for an orthosis. For a specific purpose, the extensometry based load cell were utilized. Miyake et al., [19] have illustrated a new algorithm for detecting heel contact and toe-off using the inter joint co-ordination of the hip, knee, ankle joints with low-dimensional structure. The presented method gets 4 planes in the angle space, finds the switching points to the planes. There are 7 participants walked on force plates that which measures the force of the foot against the floor. The error was low at 0.035seconds, when gait events were perceived, the first flight datum of calculating planes were used. The change in patterns of inter joint co-ordination reflects the changes in the gait phases. Although, the data were calculated offline, the outcome specifies that, once the planes were received, the angles were perceived, heel contact, toe- off were detected.
Ojeda and Mayo [20] have portrayed a method for estimating the normal with tangential contact parameters in foot ground contact through the human gait. Forecast accurate assessment of contact parameters was vital for solving the forward dynamic issues. A normal contact forces were assessed in the literature. But, the exact tangential forces did not reach for estimation. The presented work suggests a new process for exactly estimated frictional forces. The modulus of tangential force was deemed instead of its components. The normal contact force together with 2 related moments were taken in optimizing approach, to reaches the contact forces. The reverse dynamic issue was handled in the prior optimization approach. Ezati et al., [21] have introduced a novel method to classify the recent predictive simulation methods for human gait analysis. The introduced method based upon 3 strategies: (1) the human models(skeletal, musculoskeletal, neuromusculoskeletal models) (2) problem formulation, (3) solvers of simulation. Human dynamic methods were categorized depending on muscle processing and / or contraction dynamics or joint torsions (instead of muscle dynamics) were used in analysis. Various formulas utilize the integration, differentiation/implicit declartion of dynamic equations. Various simulation solutions ( semi- and fully-predictive simulation modes) were examined. At last, the pros and cons of various formulas and simulation solutions were analysed. Veerkamp et al., [22] have studied how lowering several physical based criteria such as cost of transport, muscular activity, stableness in head, foot ground effect, use of knee ligaments these will impact the predicted gait that was developed along with evaluated combined weighted cost function were tuned for the healthy gait prediction. Generally, planar musculo skeletal techniques along with eighteen Hill type muscles were implemented by utilizing the reflex based as well as the controller of parameter. Firstly, basic simulation platform were used as an individual criteria . Gait patterns were calculated based on minimizing every criteria were related with the experimental data for the healthy gait by utilizing the determination coefficients (R2), root mean square errors (RMSE) calculated all over the bio-mechanical variables. Secondly by gradual additions, the optimal weight related cost function were created. Thirdly, eficacy outcomes linked process were evaluated through mixing the predicted gait with the simulation which were optimal for monitoring the experimental data.
2.1 Background of the Research Work
Human gait depends on the difficult interaction of more important parts of the nervous, which was musculoskeletal, and cardio respiratory systems. Technology supports the analysis of human motion was dramatically advanced. Locomotion research over the past various decades have provided , that utilizes significant knowledge of the accuracy of the tests performed, understand human locomotion process, and how clinical test can be used for evaluating the medical disorders and their treatment. Gait analysis was presently recognized as clinically supportive and monetarily reimbursable for certain medical conditions. In any case , the routine of clinical use such as the gait analysis have been utilized only through the restricted growth. The problems of the clinical value depends on the variables including the materialness of existing methods to tackle the clinical issues; restricted utilization of specific tests to address a wide various clinical problems; the way wherein step labs coordinated, tests performed, reports produced with the clinical understanding, assumptions for research center results. Clinical use was graetly hampered when the time, costs were expected to play the review and interpret it. A "gait" report was extended because its data were not yet known well ,which undergoes a clinical interpretation, also, it not utilize another clinical tests. Present bio-technology research seeks to solve these issues by creating methods such as for frequentlycapturing the data, accurately, efficiently,also, it interpret with some of the assortment of modelling, statistical, wave interpretation, artificial intelligence strategies. The success of certain efforts depends on both technical abilities, communication amid engineers , clinicians, isorders of the gait due to deformities, weakness or other impairments that alters the gait pattern, For instance : loss of motor control/pain. The prevalence maximizes the age, the number of people involved will maximize significantly in the forthcoming a very long time because of the normal population changes. Careful history and physical, neurological and orthopedic examinations focusing on the complete clinical observation, gait and fall of the gait serve as a guide to the basic steps in classifying gait disorders and ancillary investigations and therapeutic interventions. These drawbacks were motivated to do this research work.
Green technology includes design of sensor system and integration with modern techniques for wellness monitoring and assessment. Development of gait system is one of the vital methods for analysis of foot-ground interaction. GAIT is done using Flexi Force sensors and accelerometers are used to detect the fall. The reflective marker method [23] is less sensitive to acquire foot pressure distribution. where it is position in the toe region and the second sensor in the heel region. During normal gait, the pressure distribution will be even and uniform in the Heel region [24] as the subject completes the gait cycles with appreciable foot ground force exchange as given in Figure 1.
Figure 1. Schematic of Foot-Ground Interaction
When there is abnormality in the gait pattern of the subject then the pressure is unevenly distributed in the Heel and toe region sensors. Also, when there is fall it is detected by the three-axis accelerometer connected in the ankle [25]. The pressure distribution information and the accelerometer data are conveyed to the LabVIEW platform through Data acquisition unit such as my DAQ which is a standard interfacing device. The gait analysis system consists of two
Flexi force sensors placed in the inner sole at the feet and heel region of the shoe as shown in Figure 2.
Figure 2. Positioning of Flexiforce sensor in-sole
Flexiforce sensors are resistive sensors in which the output is inversely proportional to the applied load. The flexiforce sensors are placed in-shoe [26] at desired location. When the sensors are at rest the resistance is about 3 MΩ of range. As the load is applied the resistance decreases as per the sensor property. The output is calculated using the formula,
Vout= -Vi (Rf/Rs)
where Vout is the output voltage, Vi is the input voltage, Rf is the feedback resistance and Rs is the sensor. Output from the sensor is to be amplified and hence we use quad amplifiers.
Figure 3. Circuit Diagram of Shoe Integrated Sensor System
The amplified sensor output and the accelerometer single-axis output are given to the data acquisition card, which is interfaced with the PC. Figure 3 shows the overall circuit implementation of the hardware unit. The main principle of the device is:
All natural gaits are designed to complete a person forward, it also suitable for lateral movement.
Because natural gait all have the same purpose, they generally distinguished when the leg muscles are used as gait cycle and it was categorized into 2 primary phases such as the stance and swing phases, which is a substitute for all the lower limb. Stance phase is the total time where foot is on the ground.Swing phase is the total time where the foot is on the air. During stance phase of gait, the foot persists in stationary contact utilize the ground while the body needs to continue forward progression.A balance between progress and maintenance of stability is required to facilitate the body’s progress.Phases of the gait cycle are,
3.1 Season analysis
This is necessary to build up support in warm ups, stretches, practices that emphasis on the major muscle bunches usually utilized in sports of interest. Participating in these occasions will diminishes the muscle cramps, torn muscles, stress breaks. One of the beneficial reviews is season analysis, that prevents injuries while playing sports.Also, it is one of the endeavor for detecting the risks, by reviewing training techniques, schedules for the competition, travelling, past injuries. Assuming injurie that happens previously, season analysis surveys checks whether it is identified with a particular training/event/ competition program.For instance, a stress fracture injury in a soccer/cross country team, might be related to concurrent changes in stream and changes in the running climate from soft to the hard surface. Seasonal analysis might be called as a group based outcomes/individual athletic outcomes. Another important events associated with injury events include changes in the amount of training, changes in climate, choosing time to play significant matches, poor sleep due to tight chaotic scheduling. It is significant for the team program chiefs, staffs are involved in testing, to guarantee that they are healthy, competitive, confident athletes for the forthcoming seasons.
3.2 Preseason screening
It is one of the another player sports injuries. Study shows, the greatest injury rate in the 15th Division I, II and III training of NCAA sports is similar to in-season or post-season.For preparing an athlete, a sport pre-participation examinations are conducted regularly with hundreds of thousands of athletes every year. Physical exam is uniquely main , in order to restrict the risks of injury, also diagnosing in the begining stage for possible injury.Preseason screenings consists of mobility joint testing (ankles, wrists, hips, etc.), stability in the joint test (knees, neck, etc.), muscle strength testing and power, breathing patterns.Main purpose of preseason screening is to identifying the participations of athletes clearly and maintain that there is no signs of injury or illness, otherwise , it will become a risk to the athlete (risk liability for the organization of the sports). Furthermore, physical test, fluidity in joint movements, pre-season screenings are considered nutritional aspect. It is essential to keep up the appropriate iron levels, pulse levels, liquid equilibrium, sufficient complete energy intake and typical glycogen levels.When a nutrition aid the body's daily intake needs, nutrition can helps to prevent injury and rehabilitation. Achieving the adequate measure in calories, starches, liquids, protein, nutrients and minerals is a essential one for the competitor are all limits the risks of the potential injuries.For instance , the male as well as the female athletes of about 60% of female college athletes suffer from iron deficiency. Different factors, for instance, monthly cycle, gastrointestinal dying, insufficient iron admission from the eating regimen, general exhaustion, shortcoming is because of the above mentioned iron loss. If an effect of iron loss is not solved, that leads to impaired athletic eficacy , immune , cognitive function decay.
3.3 Functional movement screen
Methods that utilized the preseason screening processis functional movement screen (FMS). It utilized for assessing operating modes and asymmetry, that provides insights into mechanical restrictions and likely danger of injury. Also, it has 7 basic fundamental movements that needs mobility and stability balance. The basic fundamental movements of patterns provides the visible performance of the basic locomotor, manipulative, stabilizing movements. Tests makes an individual athlete into an extreme positions such as weakness and imbalance, this clearly shows that the proper stability , mobility are not functioning properly.Some of the 7 fundamental movements of patterns like deep squat, hurdle step, inline lung, shoulder mobility, active straightleg raise, trunk stability push-up, rotary stability. For instance, deep squat is one of the difficulties to overcome the whole body parts. It utilizes gauge bilateral, symmetrical , functional mobility such as hips, knees, ankles.The dowel measures such as overhead gauges of bilateral , symmetrical mobility of the shoulders, the thoracic spine. This deep squat approach needs an exact pelvic rhythm, closed kinetic chain dorsiflexion ankles, flexion in knees , hips, extention of thoracic spine, flexion, shoulders abduction. A score framework is applied to every development such as the score of 3 is given to the competitor assuming they can play out the development with no pay, a score of 2 is given to the athelete on the off chance that they can play out the development, yet work on helpless mechanics, compensatory examples accomplish this development, a score 1 is given to the athelete on the off chance that they can't play out the development design even with pay, lastly, a 0 is given to the athelete assuming one has torment during any piece of the development or test.From the seven basics 3 are includes shoulder mobility, push-up in trunk stability , rotary stability which gives a scoring clearance in pass/ fail score. Suppose, if they fails in the test, an overall scores of 0 is given. Finally, the score part finishes, the competitor and clinical expert verify the documentation together, assign an anticipation program for helping the target as well as to boost up the shortcomings, to restrict the dangers of potential injuries.
Due to ultra-thin and flexible nature flexi force sensors find more application in pressure measurements. It is thin made of double layered laminated substrate made of polyester film. The active sensing area specifies 0.375 inches in diameter circle. Flexiforce sensors are concluded using solder able male square pin connector that permits integrated circuit [26]. The Standard A201 sensor is available in the force ranging from (0 to 250) Lbs is preferred for its linearity and reliability.
Figure 4. Flexiforce SensorsCircuit Design
Force-to-voltage circuit is the commonly used method of design for flexiforce sensor preferred for in-shoe sensor [27]. One way is to integrate into a given in Figure 4. A calibration device should found for converting the output into suitable engineering units. The Figure 5 shows that standard calibration characteristics of the sensor used for compression loading. In this case, 5 volts DC excitation voltage with data acquisition circuit having an inverter operational amplifier configuration create an analog output with high amplifier gain and sensitivity [28]. Ananalog-to-digital converter may utilize for changing this voltage in the direction of the digital output.. The Rf resistance must be changed by changing the sensitivity of the sensor in this circuit. The Figure 5 shows the sensor characteristics for the input load and change in resistance. Low resistance and higher drive voltage VT will create that sensor high sensitive and enlarge their active power range.
Figure 5. Characteristics of Flexiforce Sensors
The accelerometer is used to detect fall of the patient in this project. The sensor used is ADXL335.It is an 3-axis sensor is less, profile package is also less, 4 mm × 4 mm × 1.45 mm, Less power: 350 μA (usual),Single supply of operation: 1.8 V to 3.6 V, ±3g accelerometer with 10,000g impact force, good temperature stability, bandwidth can be adjusted to a single capacitor per axis.
6.1 Circuit Description
The ADXL335 is a tri axial accelerometer in which the measure and is converted into voltage output. The range of operation of the sensor is ±3g and it can measure even a very small deflection in the measuring parameter. Static and dynamic acceleration such as foot ground interaction during the phases of walk can be effectively studied using this sensor. So, it can measure movement and fall. The bandwidth of the accelerometer can be user specified by selecting CX, CY, CZ capacitors at XOUT, YOUT, ZOUT pins. The bandwidth is between 0.5Hz to 1600 Hz for X , Y axis, for Z-axis, the range attains 0.5 Hz to 550 Hz. The size and the sensor dimension is 4 mm × 4 mm × 1.45 mm, sixteen lead and plastic lead frame. These functional block diagram of accelerometer used in circuit development is shown in the Figure 6.
Figure 6. Functional Block Diagram of Accelerometer
Accelerometer has two circuitry namely: (1) 3-axis sensor (2) signal conditioning circuit for amplification and demodulation takes place. The voltage output is obtained. The three-axis measurement is done using the accelerometer. The three different axes are sensed using the sensor can determine spatiotemporal patterns of gait. The output from the sensor is given to the AC amplifying circuit. Thus, the output is amplified and is driven to the demodulator built-in the IC. Here the output is demodulated and is amplified again by three separate amplifiers for three different axes respectively. Hence the required axis output is derived.
Analysis of foot-ground interactions is determined using LabVIEW based software design. LabVIEW programs are named Virtual Instruments (VI), since its look and operation emulate physical instruments, like oscilloscopes along with multimeter. Each VI utilizes works, which control input as user interface/other sources, exhibit that information. The front panel in the VI consists of two components that act as user interface and block diagram contains the graphical source code of VI describes their functionality.
Front panel consists of waveform graphs to display pressure distribution, array indicators to display amplitudes and separate provisions to enter patient data. The desired sampling rate and number of samples are to be set here else the program uses the default rates.
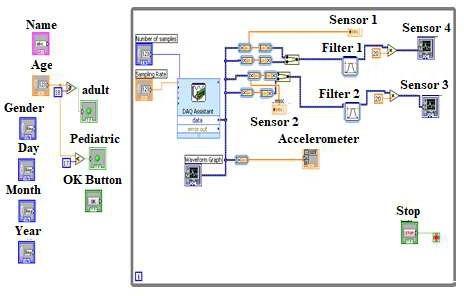
The co-ordinates of the detected points are stored in blocksand is shown in the right side of the figure. Processingthe gait image is in the 2nd and 3rd tabs. In 2nd tab, real gait image is enabled and in the 3rd tab saved, reloaded gait image is enabled . As per the tests, 4th degree (quadratic) polynomial function is the most accurate fit. For the quarter degree polynomials, 3rd, 4th coefficients considersonly smaller values (up to 10-10), also the second order (quadratic) function follows the curve drawn points, so the 4thdegree polynomials usage is inessential. The front panel as represented in Fig. 7 that means for the user to run the block diagram to the developer which accompany the program developed for the front panel. With the help of graphical environment, every modules have been created. Randomization processes are inbuilt in software, these are investigated to the development of virtual experiment codes and to make slightly variant data as seen in real lab experiment.
Figure 7. LabVIEW Block Diagram of the Software Design
Table 1. Accuracy comparison of proposed and conventional method
|
Solution techniques |
Accuracy (%) |
|
Proposed |
99.143% |
|
Conventional |
87.10348% |
A configured DAQ Assistant is used to get the inputs and display them in LabVIEW. The number of samples and the sample rate are given to the DAQ Assistant. The output data from the DAQ are divided into different channels. The split data are displayed in different Waveform graphs. A single waveform graph depicts the pressure variation in one foot i.e., it displays two waveforms corresponding to the pressure distribution in heel and toe respectively by using Merge signal function [24]. Two separate filters are used with soothing to filter the output voltage signals and the signals are software amplified by a scalar of 20.The amplified signals are then displayed in the appropriate graphs. The output of Accelerometer is displayed using an array indicator. The patient details section in block diagram just gets the primary details of the patient such as name, age, gender and date of birth. That section has nothing to do with the analysis. Table 1 displays the efficiency comparison of the proposed and conventional method. Here, the efficiency of proposed methodattains 99.143% and the conventional method is 87.10348%.
The resulting waveforms of the flexiforce sensors and accelerometer are acquired and displayed using LabVIEW indicate the applied pressure and fallevents. Pressure variation during gait was sensed by the flexiforce sensors are displayed using waveform graphs in LabVIEW. The accelerometer output was displayed using array indicator where set of values of varied axes was displayed in the LabVIEW [29]. Flexiforce sensors and accelerometer outputs have different voltages ranges. Hence different cases are studied and viewed for various results. Using DAQ the outputs of four flexiforce sensors and one accelerometer are first split into five different output channels. Then the 1st and 2nd channel indicating the outputs of a single leg placed in heel and toe region are displayed as waveforms 1 and 2. The 3rd and 4th channel indicating the outputs of the other leg placed in heel and toe region are displayed as waveforms 3 and 4. The accelerometer output is obtained from channel 5 is indicated using array indicator in the output figures.
Figure 8. LabVIEW Display of Normal Gait
Figure 9. LabVIEW Display of Abnormal Gait Indicating Slight Pronation
Figure 10. LabVIEW Display of Abnormal Gait Indicating Over Pronation
Normally the pressure distribution in the foot is high in the heel region compared to the toe region. In this project during gait, the normal gait pattern of a single leg was ranging around 0V to 40V in the heel region and in the toe region the voltage range was around 0V to 10V. When there is no fall the voltage range indicated by accelerometer was around 1.3V to 1.4V. Thus, the different abnormal gait patterns the voltage ranges above the normal voltage ranges either in heel or toe region. In the figure8 indicates the output of pressure in the heel region and output of pressure in the toe region. The array indicator in the figure8 indicates the accelerometer output. Thus, the pressure ranges around 2mV to 35mV in heel region and 0.8 to 9.2mV in the toe region. The accelerometer indicates a voltage range of 1.3V, which means there is no fall during gait [30]. Thus, the result obtained in this case was analyzed to be normal.The unit millivolts are indicated as mV.
In the figure 9 the waveform graph 1 indicates the output of pressure in the heel region and waveform graph 2 indicates the output of pressure in the toe region. The array indicator in the fig 9 indicates the accelerometer output. Thus, the pressure ranges around 0.5mV to 53mV in heel region and 5mV to 19mV in the toe region. The accelerometer indicates a voltage range of 1.8V which means there is fall during gait. Thus, the result obtained in this case was analyzed to be slightly pronated with fall of the subject.
In the figure 10, the waveform graph 1 indicates the output of pressure in the heel region and waveform graph 2 indicates the output of pressure in the toe region. The array indicator in the figure 10, indicates the accelerometer output. Thus, the pressure ranges around 70mV to 74mV in heel region and 4mV to 6mV in the toe region. The accelerometer indicates a voltage range of 1.6V which means there is fall during gait [31, 32]. Thus, the result obtained in this case was analyzed to be over-pronated where pressure abruptly distributed in foot with slight fall of the subject.
Hence from the below table 2 it becomes evidence that even a small forward lean by less than one degree can cause a deflection in the accelerometer voltage by 0.1 V – 0.2 V which will help in the prediction of fall in the respective plane. Also, the difference in the pressure distribution in the heel and toe region helps in understanding the abnormality of the foot ground contact during gait by displaying the rate of pronation. In case 1, the heel pressure is 35mV, the toe pressure is 9.2mV, acceleration value is 1.3mV and fall is no fall. In case 2, the heel pressure is 53mV, the toe pressure is 19mV, acceleration value is 1.8mV and fall is fall. In case 3, the heel pressure is 74mV, the toe pressure is 6mV, acceleration value is 1.6mV and fall is fall. In case 4, the heel pressure is 42mV, the toe pressure is 10mV, acceleration value is 1.2mV and fall is no fall. In case 5, the heel pressure is 26mV, the toe pressure is 6mV, acceleration value is 1.4mV and fall is no fall. In case 6, the heel pressure is 50mV, the toe pressure is 10mV, acceleration value is 1.6mV and fall is fall. In case 7, the heel pressure is 82mV, the toe pressure is 18mV, acceleration value is 1.7mV and fall is fall. In case 8, the heel pressure is 70mV, the toe pressure is 9mV, acceleration value is 1.9mV and fall is fall. In case 9, the heel pressure is 48mV, the toe pressure is 8mV, acceleration value is 1.2mV and fall is no fall. In case 10, the heel pressure is 77mV, the toe pressure is 17mV, acceleration value is 1.3mV and fall is fall.
Table 2. Pressure distribution and acceleration value during various gait pattern.
|
Case |
Heel pressure |
Toe pressure |
Acc. value |
Fall |
|
1 |
35mV |
9.2 mV |
1.3V |
No fall |
|
2 |
53mV |
19mV |
1.8V |
Fall |
|
3 |
74mV |
6mV |
1.6V |
Fall |
|
4 |
42mV |
10mV |
1.2 V |
No fall |
|
5 |
26 mV |
6mV |
1.4 V |
No fall |
|
6 |
50mV |
10mV |
1.6V |
Fall |
|
7 |
82mV |
18mV |
1.7V |
Fall |
|
8 |
70mV |
9mV |
1.9V |
Fall |
|
9 |
48mV |
8 mV |
1.2 V |
No fall |
|
10 |
77mV |
17mV |
1.3V |
Fall |
Abnormal gait analysis is a major research in biomedical engineering and the green technology integration helps in sustainable developments in healthcare field. The present work exhibits the accurate determination of abnormal gait pattern that helps in diagnosis of fall in elders and sports person. Additionally, a fall of a person during gait is detected using the analysis from different patterns of gait from normal gait. Normally the analysis of proper gait is analyzed by the distribution of the pressure in foot. In-shoe sensor system reveals the pressure distribution in foot in the toe and heel region for a small change in the gait pattern. This information can be used for analysing the cause of abnormality, treatment plan and surgical selection. The system determines point of abnormality and can be made into a special footware are the scope for future work. Future models will combine the 3-D feature of musculoskeletal geometry, as well as exact parameters of the subjects. The future of gait analysis has the capability to quickly process future data and recognized effects in the patient's functioning. At future, neural networks may be employed for differentiating normal along with pathologic gait. The future of gait-driven analysis will need that capability for recognizing critical tests, interpret data more quickly, forecast the result of different clinical procedures, and enumerate the outcomes.
[1] Bernad-Elazari, H., Herman, T., Mirelman, A., Gazit, E., Giladi, N. and Hausdorff, J.M., (2016), Objective characterization of daily living transitions in patients with Parkinson’s disease using a single body-fixed sensor. Journal of neurology, 263(8):1544-1551.
[2] Haji Ghassemi, N., Hannink, J., Roth, N., Gaßner, H., Marxreiter, F., Klucken, J. and Eskofier, B.M., (2019), Turning analysis during standardized test using on-shoe wearable sensors in Parkinson’s disease.Sensors, 19(14): 3103.
[3] Alam, U., Riley, D.R., Jugdey, R.S., Azmi, S., Rajbhandari, S., D’Août, K. and Malik, R.A., (2017), “Diabetic neuropathy and gait: a review.” Diabetes therapy, 8(6): 1253-1264.
[4] Sasani, K., Catanese, H.N., Ghods, A., Rokni, S.A., Ghasemzadeh, H., Downey, R.J. and Shahrokni, A., (2019), Gait speed and survival of older surgical patient with cancer: prediction after machine learning. Journal of geriatric oncology, 10(1): 120-125.
[5] Inzitari, M., Metti, A., Rosano, C., Udina, C., Pérez,
L.M., Carrizo, G., Verghese, J., Newman, A.B., Studenski, S. and Rosso, A.L., (2019) Qualitative neurological gait abnormalities, cardiovascular risk factors and functional status in older community- dwellers without neurological diseases: the healthy brain project. Experimental gerontology, 124: 110652.
[6] Kumar, P., Kumar, A., Racic, V. and Erlicher, S., (2018), Modelling vertical human walking forces using self-sustained oscillator. Mechanical Systems and Signal Processing, 99: 345-363.
[7] Roeing, K.L., Moon, Y. and Sosnoff, J.J., (2017), Unplanned gait termination in individuals with multiple sclerosis. Gait & posture, 53: 168-172.
[8] Mythili, S., Thiyagarajah, K., Rajesh, P., and Shajin, F.H. (2020). Ideal position and size selection of unified power flow controllers (UPFCs) to upgrade the dynamic stability of systems: an antlion optimiser and invasive weed optimisation algorithm. HKIE Trans, 27(1): 25-37.
[9] Rajesh, P., and Shajin, F., (2020). A Multi-Objective Hybrid Algorithm for Planning Electrical Distribution System. European Journal of Electrical Engineering 22(4-5): 224-509.
[10] Shajin, F. H., and Rajesh, P. (2020). Trusted secure geographic routing protocol: outsider attack detection in mobile ad hoc networks by adopting trusted secure geographic routing protocol. International Journal of Pervasive Computing and Communications.
[11] Thota, M. K., Shajin, F. H., and Rajesh, P. (2020). Survey on software defect prediction techniques. International Journal of Applied Science and Engineering, 17(4): 331-344.
[12] Faragó, P., Grama, L., Farago, M.A. and Hintea, S., (2021), A novel wearable foot and ankle monitoring system for the assessment of gait biomechanics.Applied Sciences, 11(1): 268.
[13] Kim, W.S., Choi, H., Jung, J.W., Yoon, J.S. and Jeoung, J.H., (2021),Asymmetry and Variability Should Be Included in the Assessment of Gait Function in Poststroke Hemiplegia With Independent Ambulation During Early Rehabilitation. Archives of Physical Medicine and Rehabilitation, 102(4): 611-618.
[14] Dostál, O., Procházka, A., Vyšata, O., Ťupa, O., Cejnar, P. and Vališ, M., (2021), Recognition of motion patterns using accelerometers for ataxic gait assessment. Neural Computing and Applications, 33(7): 2207-2215.
[15] Kanko, R.M., Laende, E.K., Strutzenberger, G., Brown, M., Selbie, W.S., DePaul, V., Scott, S.H. and Deluzio, K.J., (2021), Assessment of spatiotemporal gait parameters using a deep learning algorithm-based markerless motion capture system. Journal of Biomechanics, 122: 110414.
[16] Gorst, T., Marsden, J. and Freeman, J., 2019, “Lower limb somatosensory discrimination is impaired in people with Parkinson's disease: novel assessment and associations with balance, gait, and falls.” Movement disorders clinical practice, 6(7): 593-600.
[17] Chen, B., Zi, B., Wang, Z., Qin, L. and Liao, W.H., (2019), Knee exoskeletons for gait rehabilitation and human performance augmentation: A state-of-the-art. Mechanism and Machine Theory, 134: 499-511.
[18] Mouzo, F., Michaud, F., Lugris, U. and Cuadrado, J., (2020), Leg-orthosis contact force estimation from gait analysis. Mechanism and Machine Theory, 148: 103800.
[19] Miyake, T., Kobayashi, Y., Fujie, M.G. and Sugano, S., (2020), Gait event detection based on inter-joint coordination using only angular information. Advanced Robotics, 34(18): 1190-1200.
[20] Ojeda, J. and Mayo, J., (2019). A procedure to estimate normal and friction contact parameters in the stance phase of the human gait. Computer methods in biomechanics and biomedical engineering, 22(8): 840-852.
[21] Ezati, M., Ghannadi, B. and McPhee, J., (2019), A review of simulation methods for human movement dynamics with emphasis on gait. Multibody System Dynamics, 47(3): 265-292.
[22] Veerkamp, K., Waterval, N.F.J., Geijtenbeek, T., Carty, C.P., Lloyd, D.G., Harlaar, J. and van der Krogt, M.M., (2021). Evaluating cost function criteria in predicting healthy gait. Journal of Biomechanics, 123: 110530.
[23] Labanca, L., Iovine, R., Bragonzoni, L., Barone, G., Farella, G.M. and Benedetti, M.G., (2020), “Instrumented platforms for balance and proprioceptive assessment in patients with total knee replacement: A systematic review and meta-analysis.” Gait & Posture.
[24] Ota, S., Ohko, H., Fujita, R. and Imai, A., (2017), Preliminary study of modifications of gait and ADL to reduce knee pain and improve knee joint function. Osteoarthritis and Cartilage, 25: S410-S411.
[25] Ota, S., Ohko, H. (2019), Maximal velocity and amplitude decrement angle: a novel parameter for finger tapping instrumental evaluation in Parkinson disease", Gait & Posture, 73: 474-475.
[26] Wang S., and Cheung, R., (2019), Comments on “Unsupervised gait retraining using a wireless pressure- detecting shoe insole”, Gait & Posture.
[27] Bogen, B., Aaslund, M.K., Ranhoff, A.H. and Moe- Nilssen, R., (2019), Two-year changes in gait variability in community-living older adults. Gait & posture, 72: 142-147.
[28] Lin, Z.H. (2017), Design Of Digital Circuits For Ecg Data Acquisition System, International Journal of Recent Trends in Engineering and Research, 3(3): 89- 92.
[29] Wu, H.S. (2016), Spatiotemporal gait variables in the six-minute walk test in elderly women, Gait & Posture, 49: 47.
[30] Wang S., and Cheung, R., (2019), Comments on “Unsupervised gait retraining using a wireless pressure- detecting shoe insole, Gait & Posture.
[31] Yeh, C., Wu, H.S. and Lin, Z.H., (2020), A Biomechanical Energy Based Wearable Sensor System for Real Time Human Gait Phase Detection and Postoperative Trauma Monitoring, ECS Transactions, 97(6): 65. -70.
[32] Petcu, D. and Rosculet, V., (2018), Practical aspects of implementation of quality management system requirements for the medical footwear design. Revista de Pielarie Incaltaminte, 18(1): 39.