M. Karthikeyan* | S. Vijayachitra
© 2021 IIETA. This article is published by IIETA and is licensed under the CC BY 4.0 license (http://creativecommons.org/licenses/by/4.0/).
OPEN ACCESS
One of the basic requirements of living beings is water. Due to globalization, industries consume large amount of water and creates shortage of pure water. In addition, they pollute the existing fresh water resources. Therefore, it is essential to design an effective wastewater purification system. Electrochemical method namely, electrocoagulation paves the way for an effective wastewater purification system. This research focuses on the study and analysis of the textile wastewater purification, using electrocoagulation process. This novel experimental study and analysis was carried out using iron, aluminium and mild steel electrodes for batch, modified batch and continuous process respectively. In these electrocoagulation processes, three major parameters such as colour, turbidity and pH were sensed and monitored using IoT. Colour and Turbidity Removal efficiency were also calculated, which gives satisfying results.
electrocoagulation, electrode, colour, turbidity, pH, sensors and IoT
Textile wastewater has high turbidity due to its strong colour and high dissolved solid components. It is crucial to remove these properties from the textile wastewater as it affects the ecological system of nature. One of the promising methods for purification of the textile wastewater is electrochemical treatment based on electrocoagulation [1-5]. It is a broad-spectrum of treatment technology that removes total suspended solids, colour, heavy metals, emulsified oils, bacteria and other contaminants from wastewater. Electrocoagulation, the passing of electric current through water has proven very effective in the removal of contaminants from that are generally more difficult to remove by filtration or chemical treatment systems. In this research, the experiment is performed in batch, modified batch and continuous mode [6-11]. The study and analysis focuses on colour, turbidity and pH and these parameters are smartly monitored using IoT.
2.1 Real Time Review
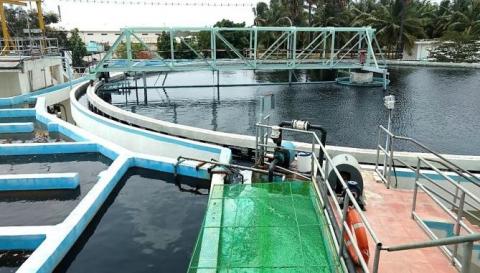
Normally, the Common Effluent Treatment Plant uses chlorine for colour removal, during the phase separation. Figure 1 shows the phase separation.
2.1.1 Problem Identification from Real Time Review
Continuous chlorination can be used only in the pH range between 3.5and 6.5
Cellulose Acetate (CA) membranes can be damaged by chlorination
RO membranes are badly affected by chlorine
Figure 1. Phase Separation
2.2 Literature Review
Akansha, Roopashree et al (2013) suggested a comparative study of electrode material for treatment of textile industry wastewater. Aoudj. S et al (2010) recommended electrocoagulation process applied to wastewater containing dyes from textile industry. Chen-lu Yang et al (2005) proposed electrochemical coagulation for textile effluent decolorization. Kabdash. I et al (2012) offered electrocoagulation application for industrial wastewater, which is a critical review. Inoussa Zongo et al (2009) put forward electrocoagulation for the treatment of textile wastewater with Al or Fe electrodes. They have compared the variations of COD levels, turbidity and absorbance.
Inoussa Zongo et al (2012) observed that electrocoagulation is being more cost-efficiency and EC allows the total elimination of chromium found in the sludge and can be recycled. Jackson Rodriguez et al (2007) proposed that electrocoagulation is being more environment-friendly with higher outstanding cost-efficiency potentials while running on continuous operation. Erick Butler et al (2011) examined that electrocoagulation treatment is effective than conventional methods. EC is capable of having high removal efficiencies of color, COD and BOD. Marco Di Luccio et al (2015) discovered that the impact of voltage and the distance between electrodes. EC continuous process could be applied as a primary treatment of dairy effluents. Salman Hussein Abbas et al (2018) proposed that EC is an effective treatment technique for the removal of wastes from wastewater. EC is an attractive method for the treatement of various kinds of wastewater. Neha Tyagi et al (2014) examined the result variation due to the excessive addition of coagulant.
2.2.1 Methodology Identification from Literature Review
Electrocoagulation process, in the batch and continuous mode are suitable for the experimental study and analysis of Textile Wastewater Treatment. It also overcomes the drawbacks of conventional mechanical treatment, biological treatment and chemical treatment systems.
The major materials used for Electrocoagulation process, in the batch and continuous mode is shown in the Table 1.
Table 1. Major Materials Used for Electrocoagulation Process
|
S. No |
Major Materials Used |
S. No |
Major Materials Used |
S. No |
Major Materials Used |
|
1. |
DC Power Source |
5. |
Colour Sensor |
9. |
Smart Phone |
|
2. |
Rectifier Circuit |
6. |
Turbidity Sensor |
10. |
Laptop |
|
3. |
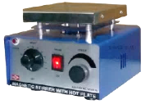
Magnetic Stirrer |
7. |
pH Sensor |
|
|
|
4. |
Electrode Plate [Iron, Aluminium, Mild Steel] |
8. |
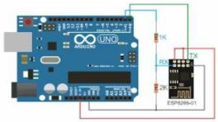
ARDUINO ESP 8266 |
||
In this research, the experimental study is performed in batch, modified batch and continuous mode. It emphases on colour, turbidity and pH and these parameters are vigorously monitored using IoT for analysing the performance.
The following expression indicates the general electrocoagulation process.
$\begin{aligned} \mathrm{M} \rightarrow \mathrm{M}^{+}+& \mathrm{ne}^{-} 2 \mathrm{H}_{2} \mathrm{O}(\mathrm{l}) \rightarrow \mathrm{OH}^{-}+\mathrm{H}_{2}(\mathrm{~g}) \end{aligned}$
4.1 Electrocoagulation Process in Batch Mode:
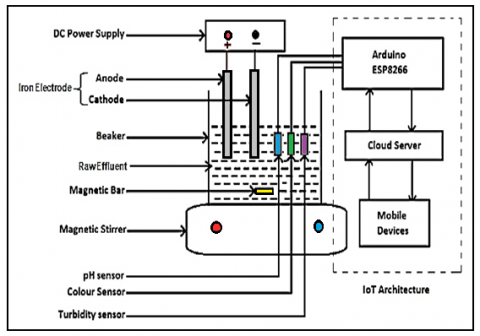
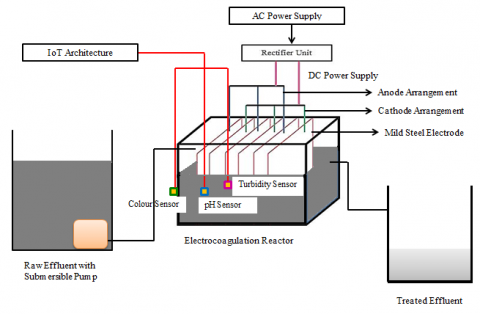
The textile wastewater was collected from SIPCOT, Perundurai and the electrocoagulation process in batch mode was carried out using the iron electrodes. The block diagram of electrocoagulation process in batch mode using IoT is shown in Figure 2.
The Specification table for Electrocoagulation Process in Batch Mode is shown in Table 2.
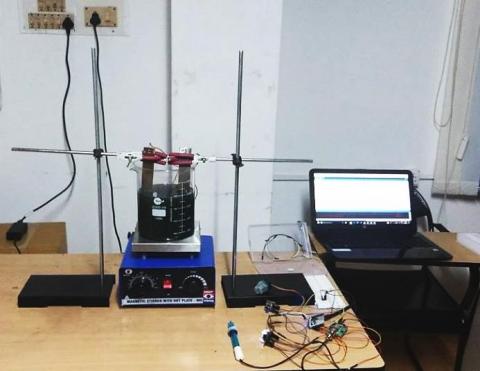
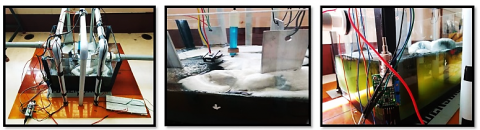
The experimental setup for Electrocoagulation Process in Batch Mode is shown in Figure 3.
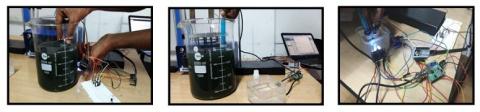
The DC power supply of 19 V is given to the iron electrodes immersed in a 2 litre beaker containing 1.4 litres of raw textile wastewater. The electrocoagulation process is continued for 126 minutes. After that, the sludge is filtered. The colour, turbidity and pH values are measured through respective sensors and monitored through IoT using Firebase Cloud as shown in the Figure 4.
Figure 2. Block Diagram of Electrocoagulation Process in Batch Mode using IoT
Table 2. Specification table for Electrocoagulation Process in Batch Mode
|
Components |
Dimensions/Quantity |
|
Iron Electrodes |
18.6cm X 2.5cm X 0.3cm [Length X Breadth X Thickness] |
|
Number of Electrodes |
2 |
|
Beaker Capacity |
2L (1.4 L of Textile Wastewater in 2L Beaker) |
|
Sensors |
3 (Color, Turbidity, pH) |
Figure 3. Experimental Setup for Electrocoagulation Process in Batch Mode using IoT
Figure 4. Measurement of Colour, Turbidity and pH during Electrocoagulation Process in Batch Mode using IoT
4.2 Electrocoagulation Process in Modified Batch Mode:
The textile wastewater was collected from Akshara Water Treatment, Perundurai and the electrocoagulation process in modified batch mode was carried out using the aluminium electrodes. The block diagram of electrocoagulation process in modified batch mode using IoT is shown in Figure 5.
Figure 5. Block Diagram of Electrocoagulation Process in Modified Batch Mode using IoT
The Specification table for Electrocoagulation Process in Modified Batch Mode is shown in Table 3.
The experimental setup for Electrocoagulation Process in Modified Batch Mode is shown in Figure 6.
The DC power supply of 19V is given to the aluminium electrodes immersed in an 8 litre tank containing 5 litres of raw textile wastewater. The electrocoagulation process is continued for 120 minutes. The treated effluent is filtered and collected. The colour, turbidity and pH values are measured through respective sensors and monitored through IoT using Blynk Server as shown in the Figure 7.
Table 3. Specification table for Electrocoagulation Process in Modified Batch Mode
|
Components |
Dimensions/Quantity |
|
Aluminium Electrodes |
17cm X 5cm X 0.2cm [Length X Breadth X Thickness] |
|
Number of Electrodes |
4 |
|
Tank Capacity |
8L (5L of Textile Wastewater in 8L tank) |
|
Sensors |
3 (Color, Turbidity, pH) |
Figure 6. Experimental Setup for Electrocoagulation Process in Modified Batch Mode using IoT
Figure 7. Measurement of Colour, Turbidity and pH during Electrocoagulation Process in Modified Batch Mode using IoT
4.3 Electrocoagulation Process in Continuous Mode:
The raw textile wastewater was collected from Akshara Water Treatment, Perundurai and the electrocoagulation process in continuous mode was carried out using the mild steel electrodes. The block diagram of electrocoagulation process in continuous mode using IoT is shown in Figure 8.
Figure 8. Block Diagram of Electrocoagulation Process in Continuous Mode using IoT
The Specification table for Electrocoagulation Process in Continuous Mode is shown in Table 4.
Table 4. Specification table for Electrocoagulation Process in Continuous Mode
|
Components |
Dimensions/Quantity/Rating |
|
Mild Steel Electrodes |
19cm X 19cm X 0.5cm [Length X Breadth X Thickness] |
|
Number of Electrodes |
6 |
|
Tank Capacity |
12L (8L of Textile Wastewater in 12L tank) |
|
Sensors |
3 (Color, Turbidity, pH) |
|
Submersible Pump |
14W |
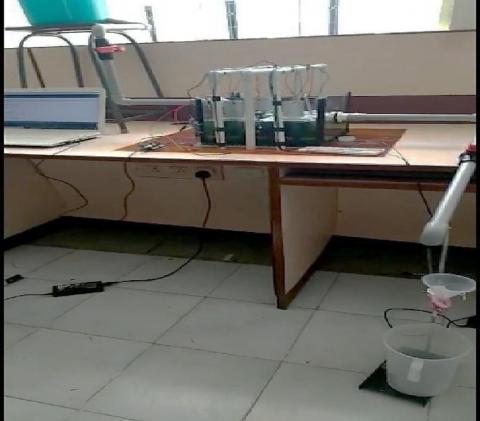
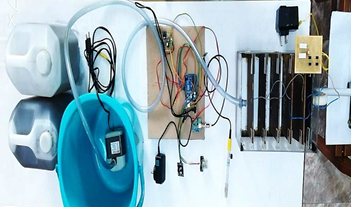
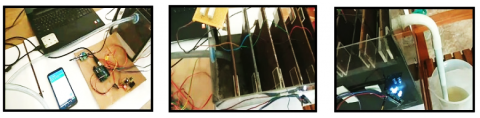
The experimental setup for Electrocoagulation Process in Continuous Mode is shown in Figure 9.
Figure 9. Experimental Setup for Electrocoagulation Process in Continuous Mode using IoT
The DC power supply of 110V is given to the mild steel electrodes immersed in a 12 litre tank containing 8 litres of raw textile wastewater. The electrocoagulation process is continued for 80 minutes. Then the treated effluent is collected. The colour, turbidity and pH values are measured through respective sensors and monitored through IoT using Thing Speak Server as shown in the Figure 10.
Figure 10. Measurement of Colour, Turbidity and pH during Electrocoagulation Process in Continuous Mode using IoT
The colour and turbidity removal efficiency after electrocoagulation process, are calculated using the following formula.
$R(\%)=\left(\frac{C 0-C}{C 0}\right) X(100)$
where, Co and C are the concentrations of textile wastewater before and after electrocoagulation.
5.1 Electrocoagulation Process in Batch Mode
The measurement of Colour, Turbidity and pH values in batch mode is shown in the Table 5.
Table 5. Measurement of Colour, Turbidity and pH values
|
|
Colour (Sampled in Frequency, Hz) |
Turbidity (NTU) |
pH |
Time in Mins |
||
|
Red |
Green |
Blue |
||||
|
Before Electrocoagulation |
||||||
|
Raw Effluent |
75179 |
72173 |
64537 |
641 |
13.861 |
- |
|
During Electrocoagulation |
||||||
|
Initial Value |
59003 |
68785 |
61046 |
638 |
13.835 |
6 |
|
Final Value |
1194 |
2227 |
1351 |
17 |
9.484 |
126 |
|
After Electrocoagulation |
||||||
|
Treated Effluent |
1194 |
2227 |
1351 |
17 |
9.484 |
- |
|
Standard Values |
235 |
244 |
250 |
< 0.5 |
7 |
- |
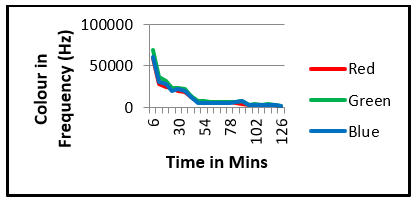
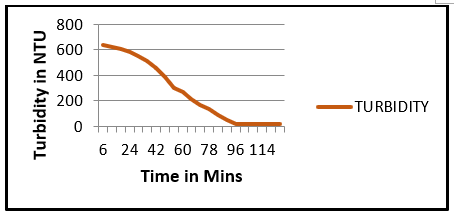
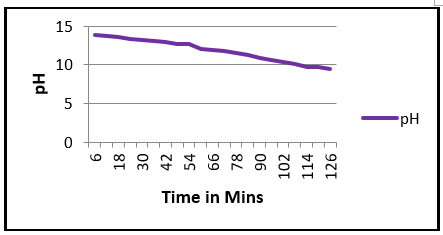
The graphical representation of the measurement of the parameter values with respect to time is shown in the Figure 11, 12 and 13.
Figure 11. Colour Measurement
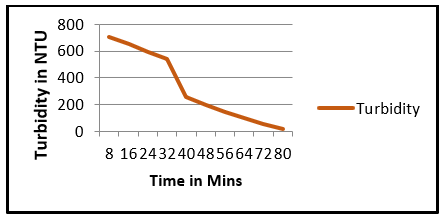
Figure 12. Turbidity Measurement
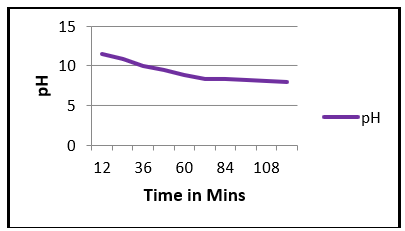
Figure 13. pH Measurement
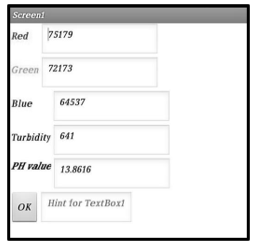
Figure 14 shows the online screenshot of measurement of Colour (RGB), Turbidity and pH during electrocoagulation.
Figure 14. Online screenshot of Measurement during Electrocoagulation
The Colour Removal and Turbidity Removal efficiency are calculated as follows.
$C R(\%)=\left(\frac{C 0-C}{C 0}\right) X(100)=\left(\frac{211889-4772}{211889}\right) X(100)=97.7 \%$
$T R(\%)=\left(\frac{C 0-C}{C 0}\right) X(100)=\left(\frac{641-17}{641}\right) X(100)=97.3 \%$
5.2 Electrocoagulation Process in Modified Batch Mode
The measurement of Colour, Turbidity and pH values in modified batch mode is shown in the Table 6.
Table 6. Measurement of Colour, Turbidity and pH values
|
|
Colour (Sampled in Frequency, Hz) |
Turbidity (NTU) |
pH |
Time in Mins |
||
|
Red |
Green |
Blue |
||||
|
Before Electrocoagulation |
||||||
|
Raw Effluent |
90125 |
93506 |
83667 |
725 |
12.413 |
- |
|
During Electrocoagulation |
||||||
|
Initial Value |
70675 |
68785 |
65046 |
627 |
11.455 |
12 |
|
Final Value |
1115 |
1570 |
1329 |
54 |
8.03 |
120 |
|
After Electrocoagulation |
||||||
|
Treated Effluent |
1115 |
1570 |
1329 |
54 |
8.03 |
- |
|
Standard Values |
235 |
244 |
250 |
< 0.5 |
7 |
- |
The graphical representation of the measurement of the parameter values with respect to time is shown in the Figure 15, 16 and 17.
Figure 18 shows the online screenshot of measurement of Colour (RGB), Turbidity and pH during electrocoagulation.
Figure 15. Colour Measurement
Figure 16. Turbidity Measurement
Figure 17. pH Measurement
Figure 18. Online screenshot of Measurement during Electrocoagulation
The Colour Removal and Turbidity Removal efficiency are calculated as follows.
$\begin{aligned} C R(\%)=\left(\frac{C 0-C}{C 0}\right) & X(100) =\left(\frac{267298-4014}{267298}\right) X(100) =98.4 \% \end{aligned}$
$T R(\%)=\left(\frac{C 0-C}{C 0}\right) X(100)=\left(\frac{725-54}{725}\right) \times(100)=92.5 \%$
5.3 Electrocoagulation Process in Continuous Mode
The measurement of Colour, Turbidity and pH values in continuous mode is shown in the Table 7.
Table 7. Measurement of Colour, Turbidity and pH values
|
|
Colour (Sampled in Frequency, Hz) |
Turbidity (NTU) |
pH |
Time in Mins |
||
|
Red |
Green |
Blue |
||||
|
Before Electrocoagulation |
||||||
|
Raw Effluent |
94840 |
95221 |
94890 |
768
|
13.635
|
- |
|
During Electrocoagulation |
||||||
|
Initial Value |
57561 |
57302 |
56905 |
704
|
13.017
|
8
|
|
Final Value |
367 |
322 |
343 |
16
|
8.45
|
80
|
|
After Electrocoagulation |
||||||
|
Treated Effluent |
367 |
322 |
343 |
16 |
8.45 |
- |
|
Standard Values |
235 |
244 |
250 |
< 0.5 |
7 |
- |
The graphical representation of the measurement of the parameter values with respect to time is shown in the Figure 19, 20 and 21.
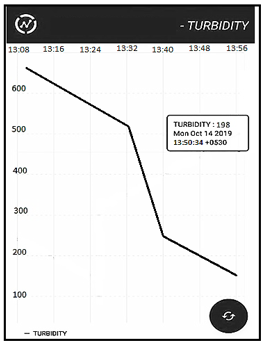
Figure 22 shows the online screenshot of measurement of Turbidity during electrocoagulation.
Figure 19. Colour Measurement
Figure 20. Turbidity Measurement
Figure 21. pH Measurement
Figure 22. Online screenshot of Measurement during Electrocoagulation
The Colour Removal and Turbidity Removal efficiency are calculated as follows.
$C R(\%)=\left(\frac{C 0-C}{C 0}\right) \times(100)=\left(\frac{284951-1032}{284951}\right) X(100)=99.6 \%$
$T R(\%)=\left(\frac{C 0-C}{C 0}\right) X(100)=\left(\frac{704-16}{704}\right) X(100)=97.7 \%$
The novel experimental study and analysis was carried out using iron, aluminium and mild steel electrodes for batch, modified batch and continuous process respectively. In these electrocoagulation processes, three major parameters such as colour, turbidity and pH were sensed and monitored using IoT. From the calculation of Colour and Turbidity Removal efficiency, continuous mode gives better and satisfying results. From this study and analysis of the parameters, optimization can be carried out using LoRaWAN Technology through necessary control mechanism. It also reveals the technical feasibility of electrocoagulation as a reliable technique for optimizing the colour, turbidity and pH from aqueous environments as per the standards.
This research work was kindly supported by Kongu Engineering College, SIPCOT and Akshara Water Treatment, Perundurai.
[1] Roopashree, G.B., Lokesh, K.S. (2014). Comparative study of electrode material (iron, aluminium and stainless steel) for treatment of textile industry wastewater. International journal of environmental sciences, 4(4): 519.
[2] Aoudj, S., Khelifa, A., Drouiche, N., Hecini, M., Hamitouche, H. (2010). Electrocoagulation process applied to wastewater containing dyes from textile industry. Chemical Engineering and Processing: Process Intensification, 49(11): 1176-1182. https://doi.org/10.1016/j.cep.2010.08.019
[3] Yang, C.L., McGarrahan, J. (2005). Electrochemical coagulation for textile effluent decolorization. Journal of hazardous materials, 127(1-3): 40-47. https://doi.org/10.1016/j.jhazmat.2005.05.050
[4] Kabdaşlı, I., Arslan-Alaton, I., Ölmez-Hancı, T., Tünay, O. (2012). Electrocoagulation applications for industrial wastewaters: A critical review. Environmental Technology Reviews, 1(1): 2-45. https://doi.org/10.1080/21622515.2012.715390
[5] Zongo, I., Maiga, A.H., Wéthé, J., Valentin, G., Leclerc, J. P., Paternotte, G., Lapicque, F. (2009). Electrocoagulation for the treatment of textile wastewaters with Al or Fe electrodes: Compared variations of COD levels, turbidity and absorbance. Journal of Hazardous Materials, 169(1-3): 70-76.
[6] Ongo, I., Merzouk, B., Palm, K., Wethe, J., Maiga, A.H., Leclerc, J.P., Lapicque, F. (2012). Study of an electrocoagulation (EC) unit for the treatment of industrial effluent of Ouagadougou, Burkina Faso. Advances in applied science research, 3(1): 572-582.
[7] Rodriguez, J., Stopić, S., Friedrich, B. (2007). Continuous electrocoagulation treatment of wastewater from copper production. World Mettall: Erzmetall, 60(2): 81-87.
[8] Butler, E., Hung, Y.T., Yeh, R.Y.L., Suleiman Al Ahmad, M. (2011). Electrocoagulation in wastewater treatment. Water, 3(2): 495-525. https://doi.org/10.3390/w3020495
[9] Benazzi, T.L., Di Luccio, M., Dallago, R.M., Steffens, J., Mores, R., Do Nascimento, M.S., Ceni, G. (2016). Continuous flow electrocoagulation in the treatment of wastewater from dairy industries. Water Science and Technology, 73(6): 1418-1425. https://doi.org/10.2166/wst.2015.620
[10] Abbas, S.H., Ali, W.H. (2018). Electrocoagulation technique used to treat wastewater: a review. American Journal of Engineering Research, 7(10), 74-88.
[11] Tyagi, N., Mathur, S., Kumar, D. (2014). Electrocoagulation process for textile wastewater treatment in continuous up flow reactor. Journal of Scientific & Industrial Research, 73: 195-198.
[12] Karthikeyan Muthusamy, Vijayachitra Senniappan, Sathish Kumar Shanmugam, (2019). Analysis and design of a novel hybrid topology for power quality improvement using multilevel inverter fed induction motor by reducing vibration for textile wastewater treatment applications. Journal of Vibroengineering, 21(3): 665-683.
[13] Sathish Kumar Shanmugam, Senthilkumar Arumugam, Gowtham Palanirajan, Meenakumari Ramachandran, Krishna Kumar Kanagaraj (2018). Implementation of solar photovoltaic array and battery powered enhanced DC-DC converter using B4-inverter fed brushless DC motor drive system for agricultural water pumping applications. Journal of Vibroengineering, 20: 1214-1233.
[14] Sathishkumar, S., Karthikeyan, M., Vijayachitra, S., Suresh, B., Sampathkumar, R., Saravanan, S. (2019). Modelling of solar photovoltaic array fed brushless dc motor drive using enhanced dc-dc converter. The Publishing House - Proceedings of the Romanian Academy, Series A, 169-178.
[15] Vijayachitra, S., Tamilarasi, A. (2008). Fuzzy System Modeling and its applications- Qualitative and Quantitative Approaches. International Transactions on Computer Science and Engineering, 46: 31- 44.
[16] Ramesh Kumar, M., Saravanan, K., Shanmugam, R. (2009). Recycling of Woven Fabric Dyeing Wastewater Practiced in Perundurai Common Effluent Treatment Plant. Modern Applied Science, 3:146-160.
[17] Md. Nazmul Hassan, Md. Moniruzzaman, Hamidul Kabir, A.N.M, Md. Moshikur Rahman, Md. Rafiqul Islam (2014). Treatment of Textile Wastewater by Electro-coagulation and Activated Sludge Process. International Journal of Chemical Studies, 1: 58-63.
[18] Ibraheem M. Khalil, Hazem Noori Abdulrazzak (2019). Monitoring of Water Purification Process Based on IoT. Journal of Electronics and Communication Engineering, 8: 56-62.
[19] Manoharan, S., Sathiyaraj, G., Thiruvenkadakrishnan, K., Vetriselvan, G.V, Praveenkishor (2019). Water Quality Analyzer using IoT. International Journal of Innovative Technology and Exploring Engineering, 8: 34-37.
[20] Amutha, B., Christy Jeba Malar, A., Karthick Nanmaran, Mansoor Hussain, D., Jeyakrishnan, V., Karthikeyan, M. (2020). Enhanced Development of Communication between the Network and the End User by Eliminating the Interference Signals in MIMO Channel. Transactions on Emerging Telecommunications Technologies, 1 - 13.