Alfonso Flores Meza* | Jose Campos | N. Rayón López | L. Contreras Romero | P.J. Sebastian | S.Thanikaikarasan
OPEN ACCESS
Graphite electrodes are the most commonly used electrodes for microbial fuel cells, though there are other materials, which are used for the electrode to allow a better conductivity, the most important idea is based on the size of these electrodes: the larger the surface of the anode and of the cathode in any situation, the greater the power density. Emerging nanomaterials such as graphene offer a high surface area and high electrical conductivity, which provides the opportunity to increase the power density in the cells. This article shows the characterization of a new electrode made with a conductive glue, graphene powder and silver paint.
microbial fuel cell, graphene, wireglue, electrodes
The need for a less expensive source of energy coupled with wastewater treatment has increased considerably in developing countries. The Technology of microbial fuel cells (MFC) has pro-vided the solution for this problem, but in small-scale applications. This technology uses certain types of micro-organisms to convert bioelectrochemical compounds into electrical energy[1].MFC uses microorganisms to oxidize the fuel, the organic matter, and trans-fer the electrons to an anode, which migrate through an external circuit that is connected to a cathode through a conductive materi-al.The chambers that house these electrodes, the anodic (anaerobic) and the cathodic (aerobic) environments, are commu-nicated by a proton exchange membrane (PEM).The protons gen-erated in oxidation are usually combined with oxygen and with the electrons that reach the cathode to form water. The graphite elec-trodes at the anode are the most commonly used in MFCs[2]. The most important thing is the surface area of these electrodes: the greater the anode and cathode surface area in any situation, higher the power density [3,4].There will also be room for microorgan-isms or mediators to transfer electrons through direct or indirect contact. The selection of the appropriate electrode material is cru-cial for the performance of MFCs in terms of bacterial adhesion, electron transfer and electrochemical efficiency. The output power of MFCs is strongly limited by the surface of the electrodes.The theoretical losses are directly proportional to the resistance of the electrode. The easiest way to decrease resistance is to increase the effective surface area while keeping the cell volume equal, thus increasing the efficiency of the MFC. In addition, a high surface area provides more sites for reactions, improving electrode kinet-ics[5].
The carbonaceous materials are the most suitable for their large surface area, their high resistance to corrosion and their low price[6]. To address these issues, a variety of materials and modifi-cations, including carbon / graphite materials, carbon nanotubes (CNT), nano-structured materials and non-precious metals, have been studied[7,8].While some traditional materials have shown adequate characteristics in MFCs, their applications are still lim-ited by their intrinsic problems, such as low surface area, low con-ductivity, poor biocompatibility, and / or complicated synthesis procedures. For example, the synthesis of multi-walled carbon nanotubes (MWCNTs) is usually carried out at a temperature high-er than 500 ° C, in this perspective, graphene is a desired alterna-tive to MWCNTs for application in MFCs [9].
Since the isolation of graphene in 2004, researchers have found a variety of unique and desirable properties for electrochemical applications such as: high electrical conductivity, large surfacearea (theoretically a value of 2630 m2/g), applicable electrocatalytic activities and low production costs[10, 11, 12].
As a result, graphene is studied as an electrode material in many electrochemical applications, such as solar cells, rechargeable batteries based on lithium, and ultra capacitors. Recent studies show that the maximum power density of MFCs has improved significantly through the use of graphene as the catalyst support[13, 14].However, the development of electrodes with graphene uses elaborate techniques, so in the present work it is use a conductive glue based on carbon and water called WireglueTM Anders Products (USA), which allows to fix the graphene to the carbonaceous support simply by contact with the glue, making the elaboration easier and less expensive. In general, anodic materials are expected to have the following properties: high electrical conductivity, biocompatibility, chemical and corrosion stability, large surface area, mechanical strength and adequate hardness[15]. In the present work, the characterization of an electrode formed with graphene powder/ conductive glue / silver paint was carried out in order to verify compliance with the aforementioned characteristics.
WireglueTM (conductive adhesive carbon-based and water) Anders Products (USA) and Dupont Silver paint was acquired. The graphene powder acquired in ID-nano Research and development of nanomaterials S.A de C.V was characterized by scanning elec- tron microscopy (SEM) in a Hitachi S5500 FE-SEM / EDS device. The specific surface area was obtained by N2 adsorption / desorp- tion measurements, the surface area analyzer and NOVA 2200e pore size analyzer from Quantachrome instruments was used. The X-ray diffraction analysis was carried out with a diffractometer- RigakuUltima IV.
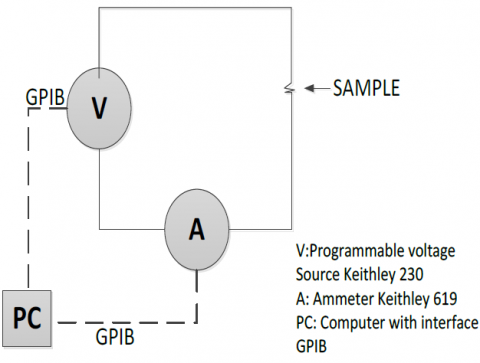
For the conductivity measurements, a Keithley 230 programma- ble voltage source was used, to measure the current a Keithley 619 equipment coupled to a triaxial cable measurement chamber and a computer to automate the measurements with the GPIB interface. A program was developed in Pascal for the acquisition and processing of data for the Ohm method. For the Kelvin method a Keithley 2400 current-voltage measuring source was used, the thickness measurement was done with a micrometer.
The conductive glue was measured as received, dispersing it in Corning glass (2.4 cm long, 2.5 cm wide). To make a good ohmic contact, silver paint was applied on the ends of the dispersed glue, then a heat treatment of 80°C was applied for half an hour.The resistance was determined by the Ohm method.A 1:1 wireglue / silver paint composite was prepared. Given the low resistance of the formed mixture Kelvin method for determining the conductivity was used.An electrode was developed without graphene which is a glass tube of 5mm inside diameter where the wireglue / silver sup- port is inserted connecting it internally to a copper wire for its con- nection to the circuit, the glass tube avoids the contact of the cop- per with the solutions to be used, then 5mg of graphene powder was added to the support at the end of the tube, and then taken to oven drying at 100 °C for 20 min.
$\mathrm{K}_{3}\left[\mathrm{Fe}(\mathrm{CN})_{6}\right]+\mathrm{K}^{+}+1 \mathrm{e}^{-} \leftrightarrow \mathrm{K}_{4}\left[\mathrm{Fe}(\mathrm{CN})_{6}\right]$ (1)
To determine the electroactive area it was necessary to first de- termine potassium ferrocyanide diffusion coefficient (1X10⁻⁶ mol/cm3) by using an electrochemical cell built out of three elec- trodes: working electrode (platinum/0.031416 cm2 area), reference electrode (saturated Ag/AgCl /KCl) and an auxiliary electrode (graphite rod). First a cyclic voltammetry was performed in a po- tential window of -0.3 to 0.9 V starting at the open circuit potential. Then a chronoamperometry was done as follows: 5s with open circuit potential, 30s for oxidation starting at 0.3V and 30s for re- duction starting at -0.3V. This was repeated by working electrode (graphene/wireglue/silver paint), reference electrode (saturated Ag/AgCl /KCl) and auxiliary electrode (graphite rod). For the elec- trochemical determination reversible reaction of potassium ferrocy- anide and a solution of potassium chloride was used (supporting electrolyte).It was used Cottrell equation that describes the case for a planar electrode.
$i=\frac{n F A c \sqrt{D}}{\sqrt{\pi t}}$ (2)
where, i is the current in amperes (A), n the number of electrons (to reduce/oxidize one molecule of analyte ), F the Faraday con- stant, 96,485 C/mol, A the area of the (planar) electrode in cm2, c the initial concentration of the reducible analyte in mol/cm3, D the diffusion coefficient in cm2/s and t the time in s.
Experiment was also carried out to determine the polarization curve, which allows defining the performance of the cell with the use of an anode formed by a wireglue / silver paint / graphene pow- der composite of 5mm diameter (1.963 x 10⁻⁵ m2).
The substrate source was synthetic wastewater whose carbon source was reactive grade glucose. The synthetic wastewater had a pH between 6 and 6.5, and the following composition (per liter):
4g glucose; 310mg NH4Cl; 130mg KCl; 4,97g NaH2PO4; y 2,75g Na2HPO4H2O [16].
The inoculation of the graphene powder/ wireglue/silver paint electrode was carried out using a passive technique introducing the anode with synthetic waste water and anaerobic sludge in solution for 10 days in the absence of oxygen, then a microbial fuel cell was started up, synthetic waste water described above was used as an anolyte and the electrode was introduced with the biofilm formed. It was bubbled with N2 to displace the O2 present prior to the anode closure. A graphite bar was used as the cathode. To perform the polarization curve, it was allowed to operate open circuit for 2 days to allow the acclimatization of the microorganisms. The curves were plotted with the obtained measurements of potential difference with a DUINOMITE card and an elaborate program allows to take measurements every 30 seconds by reading 200 times and delivering the average of these 200 measurements. The voltages registered every 2 minutes were plotted when the external resistance was varied from 5000 Ω to 3700Ω, passing through several intermediate external resistances.
3.1. Characterization of graphene
The graphene was characterized by the following elemental anal- ysis by energy dispersive X-ray (EDX):
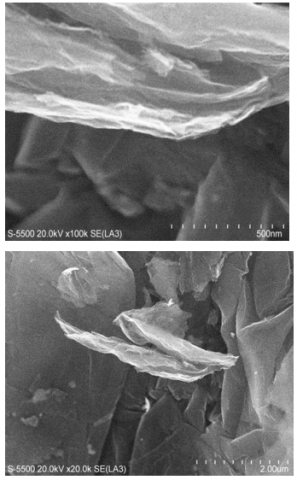
Graphene powder is often mixed with other materials to form composites. Figure 1 shows the SEM micrograph of powdered graphene, the leaf-like structure was observed with an approximate size of 1μm width. Average graphene leaf aggregates are known as what is called multilayer graphene, this is due to the reduction method in graphene formation. Graphene powder has ease, speed of application, reduced weight (0.005 g/cm3) and its high adherence due to its sandy surface. Li Xiao [17] called crumpled grafene to this sheets; the crumpled particles are remarkably aggregation- resistant in both solution and solid state and have amuch more sta-ble consistently higher surface area.
Figure 1. SEM micrograph of graphene powder
The analysis of the specific surface area was performed in a bath of liquid nitrogen and gaseous nitrogen (Ultra high purity 99.999% INFRA) as adsorbate, previously the samples were degassed at 120° C for 16 hours. The results are shown in figure 2.
The measurement of adsorption / desorption of nitrogen presents a V-type isotherm. According to the classification of the IUPAC 2015 [18], it presents a phenomenon of hysteresis at high pressures P/Po, which indicates a mesoporous structure of graphene. The specific surface area obtained with the BET equation is 910.482 m2/g and with the equation BJH it is 432.38 m2/g.
X-ray diffraction analyses were performed, obtaining a trigonal crystalline system with a crystal size of 3 nm at 26.03 ̊ (2$\theta$) (see Figure 3) corresponding to a spacingof 3.38 Åthat can be attributed to the high degree of exfoliation.
This analysis is important since it is expected that in the diffrac- togram a peak between 10 and 20 ̊ will not appear in 2$\theta$, this would indicate the presence of graphene oxide due to incomplete reduc-tion. Graphite has a characteristic peak in 26.37 ,̊ when the XRD of graphene approaches that of graphite, it means that it is structurally ordered and is approaching its structures.
Figure 2. Adsorption / desorptionisotherm
Figure 3. Diffractogram of graphene powder
3.2. Conductivity of glue and composite
Figure 4 shows the diagram of the experimental assembly for the measurement of conductivity by the Ohm method.
Table 2 shows the details of the experiments (test piece 1 con- ductive glue, test piece 2 composite glue / silver paint).
It can be seen in table 2 that the conductivity of wireglue glue was improved with silver paint, forming a stable composition, to which graphene was added, which will be responsible for housing the microorganisms to be used in the cell microbial.
Figure 4. Equipment for the determination of resistivities by Ohm procedure.
Table 1. Graphene chemical composition
|
CHEMICAL ELEMENT |
WEIGHT % |
ATOMIC% |
|
C (K) |
87 |
91 |
|
O (K) |
9 |
7 |
|
S (K) |
4 |
2 |
Table 2. Sample data
|
Sample |
Resistance (Ohm) |
Resistivity (ohm m) |
Conductivity (ohm-1 m-1) |
|
1 |
567.8205 |
0.124 |
8.051 |
|
2 |
0.0039 |
0.000645 |
1550.38759 |
3.3. Electrochemical Stability Analysis
Figures 5 and 6 show the voltammograms obtained at a scanning speed of 0.1V/s., both for the support and for the electrode with graphene. You can observe a faradaic behavior (load transfer) where the oxidation and reduction peaks are clearly shown, which indicates that the support is suitable for its use, complementing the conductivity analysis performed by the Kelvin method.
When performing the measurements, the open-circuit potential (OCP) was determined, from which voltammetry was initiated. These values are found in the corresponding graphs. A shift in the reduction potential of - 0.1 to - 0.06 and another of 0.2394 to 0.2375 in the anodic peak were obtained. But in the same way the response to the ferrocyanide electrochemical reaction is well defined, concluding that the electrode is apt to continue with the tests and verify its proper behavior as an anode in a microbial fuel cell.
Figure 5. Voltammetrogram of the pair [Fe(CN63-)]/[Fe(CN64-)] with wireglue working electrode / silver paint.
Figure 6. Voltammetrogram of the pair [Fe(CN63-)]/[Fe(CN64-)] with wireglue working electrode / silver paint / graphene.
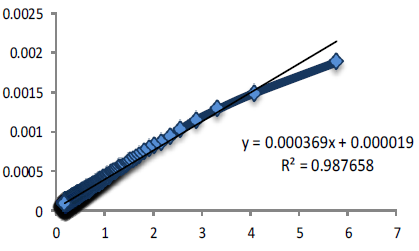
Fig. 7 shows adjustment of data to the Cottrell equation, potassi- um ferrocyanide diffusion coefficient and electroactive surface for prepared electrode.
Table 3 shows the results obtained in the determination of the electroactive area for graphene/wireglue/silver electrode whit Cot- trell equation analysis.
To verify that the electrodes have an adequate behavior against pH variations, they were submerged in buffer solutions of pH 4 and 9 at a temperature of 40°C. No modification was observed, detach- ment of the support or impregnated graphene.
Figure 7. Data fitted to the Cottrell equation
Table 3. Results obtained
|
Data |
|
|
n |
1.0000000 |
|
F |
96484.5561000 |
|
A |
0.3555720 |
|
D |
0.0003634 |
|
c |
0.0000010 |
3.4. Polarization curve
Figure 8 shows the microbial fuel cell used in this work, for chamber separation, a nafion membrane was used.
Figure 8. Design of the microbial fuel cell
The following figure shows the results obtained from the polari- zation curve:
Figure 9. Polarization curve
The open circuit voltage was 218 mV, the resistance was worked in that interval because if the resistance was lowered more the tension tended to zero, that is to say a phenomenon known as overshoot, which is an unexpected decrease in the electric current. By using small external resistors, the demand for electrons exceeds the speed with which electrons can be supplied by microorganisms (because the circuit becomes more conductive) and as a result the anolyte lacks electrons and ions.
The electrode made with conductive glue / silver paint / graphene presented suitable characteristics for its application in a microbial fuel cell. The conductivity obtained from the support (1550.39 ohm-1m-1) was optimized with the silver paint and it is expected to improve the electron transfer. The analysis used to characterize graphene allowed us to know its morphology, surface area, which are expected to improve the kinetics that takes place in the anode electrode.Withpolarization curve, we can conclude that the voltage surpassing is due to the resistance of the anode-respiratory microor- ganisms to the use of substrate and to the resistance to electron transfer towards the anode.
[1] N. G. Nwogu, “Microbial Fuel Cells and Parameters Affecting Performance When Generating Electricity”, 73, (2007).
[2] B. E. Logan, Nat. Rev. Microbiol., 7, 375 (2009).
[3] J. Liu, Y. Qiao, C. X. Guo, S. Lim, H. Song, y C. M. Li, Biore-sour. Technol., 114, 275 (2012).
[4] G. Mohanakrishna, S. K. Mohan, y S. V. Mohan, Appl. Energy, 95, 31 (2012).
[5] Y. P. Wang et al., Appl. Energy, 98, 230 (2012).
[6] S. Ci, P. Cai, Z. Wen, y J. Li, Sci. China Mater., 58(6), 496 (2015).
[7] Y. Qiao, S.-J. Bao, y C. M. Li, Energy Environ. Sci., 3(5), 544 (2010).
[8] M. Zhou, M. Chi, J. Luo, H. He, y T. Jin, J. Power Sources, 196(10), 4427 (2011).
[9] E. Flahaut, M. C. Durrieu, M. Remy-Zolghadri, R. Bareille, y C. Baquey, Carbon N.Y., 44(6), 1093 (2006).
[10] S. M. Paek, E. Yoo, y I. Honma, Nano Lett., 9()1, 72 (2009).
[11] X. Wang, L. Zhi, y K. Müllen, Nano Lett., 8(1), 323 (2008).
[12] L. L. Zhang, R. Zhou, y X. S. Zhao, J. Mater. Chem., 38(29), 2520 (2009).
[13] G. Gnana, C. J. Kirubaharan, S. Udhayakumar, C. Karthikeyan, y K. S. Nahm, “Conductive Polymer / Graphene Supported Platinum Nanoparticles as Anode Catalysts for the Extended Power Generation of Microbial Fuel Cells”, 2014.
[14] C. J. Kirubaharan, K. Santhakumar, G. Gnana kumar, N. Sent-hilkumar, y J.-H. Jang, Int. J. Hydrogen Energy, 40(38), 13061 (2015).
[15] B. E. Logan et al., Environ. Sci. Technol., 40(17), 5181 (2006).
[16] L. Alzate-Gaviria, C. Fuentes-Albarrán, A. ÁLvarez-Gallegos, y P. J. Sebastian, Interciencia, 33, 503 (2008).
[17] L. Xiao, J. Damien, J. Luo, H. D. Jang, J. Huang, y Z. He, J. Power Sources, 208, 187 (2012).
[18] M. Thommes et al., Physisorption of gases, with special refe-rence to the evaluation of surface area and pore size distribu-tion (IUPAC Technical Report), vol. 87. 2015.