Rana R. Ghanim* | Ahmed Khazal Younis | Nor Athiyah Abdullah
© 2026 The authors. This article is published by IIETA and is licensed under the CC BY 4.0 license (http://creativecommons.org/licenses/by/4.0/).
OPEN ACCESS
The increasing demand for efficient crop monitoring and timely plant-health assessment has fostered the adoption of artificial intelligence (AI) and edge computing in precision agriculture. Lightweight deep learning models hold specific promise for real-time visual monitoring on resource-constrained edge devices. This paper proposes an Edge AI framework for real-time monitoring of lettuce health through a comparative assessment of four lightweight deep learning models: MobileNetV2, EfficientNet-V2B0, YOLOv8n, and SqueezeNet1.1. A custom dataset composed of 6,107 images of lettuce acquired in the field for the binary classification of Healthy/Unhealthy was used. A common input resolution of 224 × 224 pixels was used to provide a common ground for the experiments. The models were evaluated in terms of classification performance, computational complexity (GFLOPs), and inference efficiency and were then deployed on a Raspberry Pi 4 using TensorFlow Lite. The highest classification accuracy (99.02%) was obtained by EfficientNet-V2B0, followed by MobileNetV2 (98.53%), YOLOv8n (95.42%), and SqueezeNet1.1 (93.00%). The fastest inference was obtained using YOLOv8n on the Raspberry Pi 4, with an inference speed of 18.05 frames per second (FPS) (55.4 ms/image). SqueezeNet1.1, MobileNetV2, and EfficientNet-V2B0 were the next fastest, with 8.10, 7.40, and 4.55 FPS, respectively. Our findings demonstrate a trade-off between predictive accuracy and edge-inference efficiency, with EfficientNet-V2B0 attaining the best classification performance and YOLOv8n the fastest edge inference. The evaluation is limited to image-level classification on a held-out subset of the custom dataset and deployment on the Raspberry Pi, so external cross-domain validation and closed-loop irrigation-control evaluation are left for future work.
Edge AI, smart irrigation, precision agriculture, lightweight deep learning, lettuce health monitoring, Raspberry Pi 4, Internet of Things
The rapid increase of the world’s population, combined with increasing food demands and water shortages, has created the need for sustainable agricultural practices that can increase crop productivity with fewer resources [1]. Agriculture accounts for almost 70% of the world’s freshwater withdrawals, and efficient irrigation management is a key component of sustainable food production [2]. Recently, the integration of Internet of Things (IoT), artificial intelligence (AI), and edge computing has been considered as a promising paradigm for precision agriculture by facilitating continuous environmental monitoring, automated decision-making, and intelligent resource management [3]. These technologies provide real-time crop assessment and irrigation control leading to reduced water wastage, better crop quality and reduced operational costs [4].
Deep learning has achieved significant success in agricultural image analysis, especially in crop disease detection, plant health assessment and yield prediction [5]. Lightweight convolutional neural networks (CNNs), including MobileNet, EfficientNet, YOLO, and SqueezeNet1.1, have received much attention because of their high recognition accuracy and low computational complexity (GFLOPs), which is beneficial for resource-constrained edge devices [6]. Edge AI, as opposed to traditional cloud-based solutions, performs inferences on embedded hardware locally, dramatically reducing communication latency, bandwidth requirements, and privacy concerns [7]. Therefore, edge computing is an attractive solution to realize intelligent agricultural monitoring systems that operate in remote farm environments with limited internet connectivity [8].
The combination of lightweight deep learning models and IoT sensing technologies makes the development of autonomous smart irrigation systems possible, which can monitor plant conditions and environmental parameters at the same time [9]. The information from the cameras, along with the measurements of soil moisture and climate, can be combined to enable smart irrigation systems to make irrigation decisions in a timely manner based on the actual health status of the crops, instead of on fixed moisture thresholds. These integrated systems help to enhance water-use efficiency, early stress detection and sustainable precision agriculture [10].
Despite promising progress made in AI-based precision agriculture, some limitations are still present in current edge-based crop monitoring systems. Previous studies mostly evaluate only one deep learning model or focus only on classification accuracy, frames per second (FPS), memory consumption and GFLOPs, which are important factors in real-time edge deployment [11]. Furthermore, many existing systems are predominantly based on cloud computing, leading to increased latency, higher communication costs and dependence on stable internet connectivity. Moreover, comparative evaluations of lightweight deep learning models under the same experimental conditions on embedded platforms are still scarce, making it hard to determine the most appropriate model for practical agricultural applications [12].
Despite the rapid advances in AI, IoT technologies, and edge computing, several challenges still remain for the development of efficient and practical crop monitoring systems in precision agriculture [13]. A large number of studies have been performed on intelligent irrigation, plant health assessment, and decision support with AI using different sensing technologies and machine learning algorithms. However, due to variations in experimental setting, deployment platforms, and evaluation methodologies, it is difficult to identify the most suitable lightweight deep learning model for real-time edge deployment [14]. Thus, to identify the research gaps and justify the proposed framework. The relevant studies include AI-based smart irrigation, crop health monitoring, and edge-based deep learning systems.
Recent progress in precision agriculture has shown that incorporating AI, the IoT, and sensor networks can greatly enhance irrigation efficiency and crop management. Reginald [15] presented an IoT-based precision irrigation system that integrates environmental sensors and AI techniques to enhance irrigation scheduling and nutrient management. The study reported improvements in water-use efficiency and fertilizer utilization, but did not specify the machine learning algorithms used, or provide quantitative performance metrics, making it difficult to evaluate the system’s effectiveness. Likewise, Shaukat [16] proposed a conceptual model that combines AI, IoT and environmental science for real-time monitoring of agriculture and predictive decision-making. However, the proposed framework does not have experimental implementation and field validation, and issues such as deployment cost, rural connectivity, scalability, and data security still need to be addressed. Thakur et al. [17] recently presented a smart farming advisory system that combines IoT sensor networks with Generative AI models to provide dynamic crop management recommendations. Despite the model’s potential in precision agriculture, the architecture is still conceptual, and no prototype is implemented or experimentally validated, nor are computational requirements evaluated for edge deployment.
Many researchers have been studying the use of machine learning techniques for irrigation prediction and water management. Peeriga et al. [18] suggested a bi-directional long short-term memory (Bi-LSTM) model for rainfall prediction with weather information from IoT sensors. Their model showed an average prediction accuracy of 92%, which is better than the traditional LSTM (85%) and ARIMA (80%) models. But the proposed model is highly dependent on the historical climate data, and it may not generalize well to regions with different environmental conditions. Benhmad et al. [19] proposed a smart irrigation system based on IoT devices and enhanced gradient boosting tree algorithm and Isolation Forest for anomaly detection. The system resulted in 35% water savings and a 25% increase in palm productivity under arid agricultural conditions. In a similar vein, Arlanova et al. [20] applied Random Forest and Artificial Neural Network models for predictive irrigation, leading to a reduction in irrigation water from 6000 m3/ha to about 5100 m3/ha while maintaining the crop yields at 3500–3600 kg/ha. Martelli et al. [21] developed a decision support system based on machine learning and a genetic algorithm for optimizing deficit irrigation in tomato crops, with a 32.66% water saving without a significant impact on crop yield. However, most of these studies use only environmental sensor data and do not include real-time visual crop health analysis with lightweight deep learning models, although these studies show the capability of AI in irrigation management.
Recently, low-cost embedded systems have been explored for practical agricultural deployment. Pandey and Agarwal [22] developed a smart irrigation system using ESP32 with soil-moisture sensing and threshold-based control, which uses about 25% less water than traditional irrigation. But the system was rule-based rather than using intelligent visual analysis and was tested on a single crop and limited environmental conditions. Moreover, most prior studies assess individual AI models, rather than systematically investigating the trade-offs among classification accuracy, FPS, memory consumption and GFLOPs for real-time edge computing. There is a lack of exhaustive comparative analyzes of lightweight deep learning models applied to Raspberry Pi platforms [23].
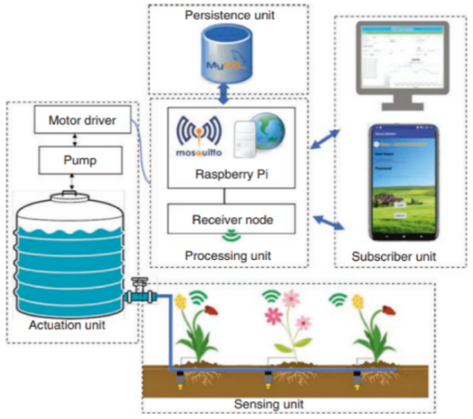
To address these limitations, this work proposes an Edge AI framework for real-time lettuce health monitoring based on MobileNetV2 [24], EfficientNet-V2B0 [25], YOLOv8n [26] and SqueezeNet1.1 [27] on a custom dataset of 6,107 field-acquired lettuce images for binary Healthy/Unhealthy classification. The models were comparatively evaluated for accuracy, F1-score, recall, FPS, model size and GFLOPs. The TensorFlow Lite deployment was performed on a Raspberry Pi 4 to evaluate the trade-off between classification performance and edge-inference efficiency. The overall architecture, as shown in Figure 1, includes IoT sensing, edge computing, and lightweight deep learning [28]; however, this experimentally demonstrated work is limited to image-based lettuce health classification and edge deployment, while environmental sensing, closed-loop irrigation control, and water-use evaluation are potential future expansions.
Figure 1. Overview of the smart irrigation system [28]
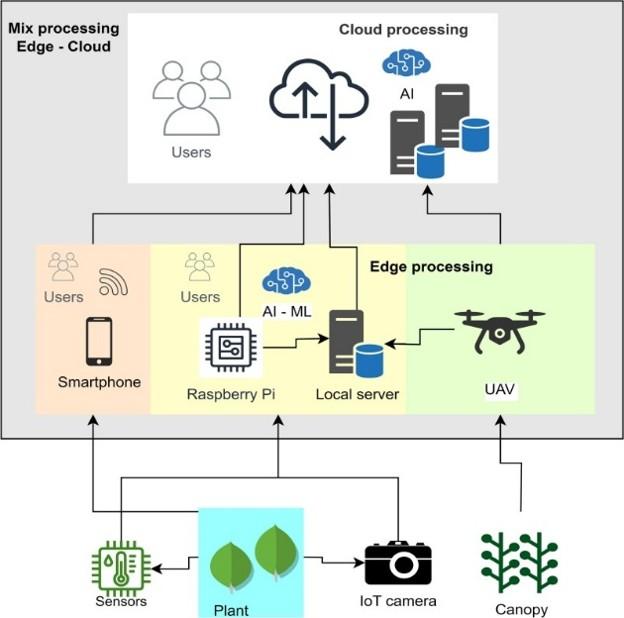
The rapid evolution of AI, IoT, and edge computing has revolutionized traditional agricultural practices into intelligent precision farming systems. Precision agriculture is based on continuous monitoring of crop and environmental conditions, enabling optimization of irrigation scheduling, improved resource utilization and increased crop productivity [29]. IoT sensor networks measure soil moisture, temperature, and humidity in real time, while imaging devices continuously capture visual information describing the condition of the plants. Such heterogeneous data sources allow intelligent decision-making systems that can detect early stage of plant stress and support automated irrigation management. The overall architecture of the Edge AI-based precision agriculture system is shown in Figure 2 [30].
Figure 2. General architecture of an Edge AI-based precision agriculture system [30]
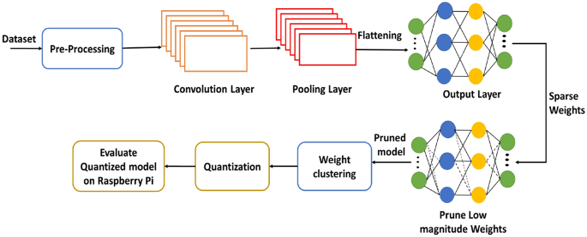
Deep learning is one of the most powerful methods for agricultural image analysis, which can automatically learn discriminative visual features from large image datasets. Lightweight CNNs such as MobileNetV2, EfficientNet, YOLOv8n and SqueezeNet1.1 are specially designed to reduce the GFLOPs while maintaining a high classification accuracy. These models exploit optimized convolution operations, parameter reduction techniques and efficient feature extraction mechanisms that enable their deployment on embedded edge devices with limited computational resources. Edge computing is well-suited for real-time agricultural monitoring applications as it performs inference locally, greatly reducing communication latency, bandwidth consumption and reliance on cloud infrastructure. Figure 3 shows the general workflow of lightweight deep learning inference on an edge computing platform [31].
Figure 3. Flowchart of lightweight deep learning inference on an edge computing platform [31]
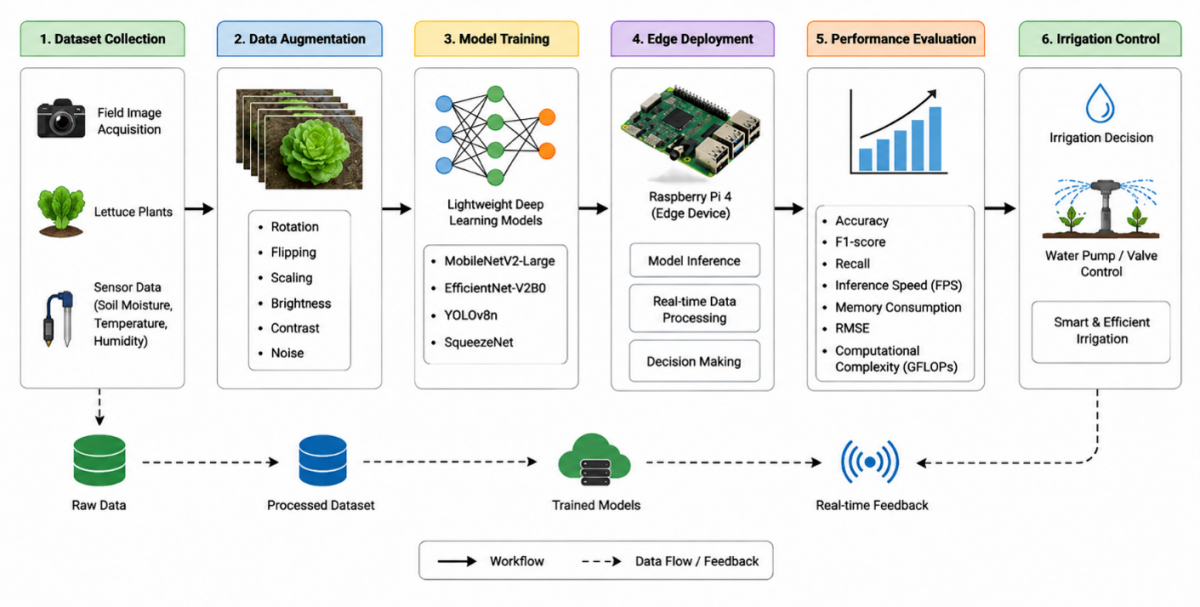
The proposed methodology experimentally targets image-based lettuce health monitoring with lightweight deep learning and Edge AI. Four lightweight architectures are used to preprocess and analyze field-acquired lettuce images in an effort to classify plants as Healthy or Unhealthy. The trained models are comparatively evaluated in terms of classification performance and computational efficiency, and they are further deployed in TensorFlow Lite on a Raspberry Pi 4 for the assessment of edge inference. Note that the environmental sensing and irrigation-control components depicted in the broader architecture are a possible application-level extension of the monitoring framework, and not experimentally validated components of the present work. The entire workflow from image acquisition and preprocessing to model evaluation and edge deployment is shown in Figure 4.
The environmental sensing and irrigation-control components presented in the system architecture are included only to demonstrate a potential application-level extension of the presented Edge AI monitoring framework. These components are not implemented or experimentally evaluated in the present study. Hence, sensor-specific parameters, such as sensor models, measurement ranges, accuracy, calibration procedures, and sampling intervals, and irrigation-control parameters, such as soil moisture thresholds, pump activation rules, conflict resolution mechanisms, and sensor failure handling, are out of the scope of this work that has been experimentally validated. Hence, the experimental evaluation is restricted to image based Healthy/Unhealthy lettuce classification and edge inference on the Raspberry Pi 4. Future work will explore a full closed-loop irrigation-control implementation that combines environmental sensing with image-classification outputs.
Figure 4. Proposed Edge AI framework for lettuce health monitoring and potential integration with agricultural sensing and control systems
The performance of deep learning models is highly reliant on the quality of the training dataset and the effectiveness of the model training strategy. Developing a reliable crop health monitoring system requires a representative image dataset acquired under realistic field conditions, and appropriate preprocessing and optimization techniques to enhance model generalization. In addition, suitable lightweight deep learning architectures and a good training procedure have to be selected to achieve high classification accuracy and the required computational efficiency for real-time deployment [32]. The complete data acquisition and model training pipeline used in this study is described in this section. It starts with the gathering and preparation of a custom lettuce image dataset and then proceeds to the preprocessing and data augmentation techniques applied to improve the model’s robustness. Then, the lightweight deep learning models used in this work are introduced, along with their training strategy, hyperparameter setting and deployment procedure on the Raspberry platform. Finally, the evaluation methodology and the performance metrics used for the assessment of the classification performance and the computational efficiency are described.
3.1 Dataset acquisition and preparation
To develop reliable deep learning models for crop health assessment, a quality and representative image dataset is a must. In this work, we acquired field images of lettuce (Lactuca sativa) in natural agricultural conditions and constructed a custom dataset. Lettuce was chosen as the target crop due to its economic importance, short growth cycle and clearly visible symptoms of water stress and deterioration of plant health. The images were acquired with a digital camera under different environmental conditions to capture natural variations in illumination, viewing angles and plant appearance to improve the robustness and generalization capability of the trained models.
Custom lettuce data were collected under field conditions from several locations in Nineveh Governorate, Iraq, including agricultural fields and small garden plots, from early September to early November. The images were taken with mobile phone cameras and webcams connected to a computer under natural varying field conditions. The samples were collected with multiple imaging sources, instead of being fixed to a single acquisition configuration. Thus, the image resolutions, camera-to-plant distances, viewpoints, backgrounds and illumination conditions varied. The dataset included three primary growth stages of lettuce plants: seedling, vegetative and mature/harvest stages.
The dataset was created for visual plant-health assessment, and not for the diagnosis of a specific disease or individual stress mechanism. The Healthy class was characterized by uniform leaf color, compact plant structure and normal visible growth, while the Unhealthy class included samples with observable abnormalities such as leaf discoloration, wilting, decay or irregular growth associated with environmental stress. The Unhealthy label is a generic visual indicator of plant health, and cannot differentiate between disease, water stress, nutrient deficiency or physical damage. The image annotation was carried out manually by the researcher on the basis of the predefined visual criteria from the relevant literature and was applied systematically across the dataset. The annotation was based on observable plant-health status and not on the identification of the underlying physiological cause. As the dataset was annotated by one researcher, inter-annotator disagreement and resolution were not applicable.
The dataset includes 6,107 images that were manually labeled into two classes: healthy and unhealthy lettuce plants. To avoid any bias in model development, the dataset was divided into three mutually exclusive subsets, 70% for training, 15% for validation and 15% for testing. We trained discriminative visual features on the training set, performed hyperparameter optimization and model selection on the validation set and evaluated the final performance on the test set on previously unseen images. The distribution of the dataset in the three subsets is detailed in Table 1, providing a balanced view of the healthy and unhealthy classes.
Table 1. Distribution of the lettuce image dataset used for training, validation, and testing
|
Dividing the Data |
Healthy |
Unhealthy |
Total |
|
Training (70%) |
2173 |
2102 |
4275 |
|
Validation (15%) |
466 |
450 |
916 |
|
Test (15%) |
466 |
450 |
916 |
|
Total |
3105 |
3002 |
6107 |
To reduce the risk of data leakage, the 6,107 field-acquired lettuce images were split into mutually exclusive training, validation and test sets at a 70:15:15 ratio, which consists of 4,275, 916 and 916 images respectively. Only the training set was augmented with additional data; the validation and test sets were left as-is. In some cases reliable plant- or acquisition-session identifiers were not available for all images, thus partitioning was done at the image level and the numbers of independent plants and images per plant could not be retrospectively determined. Thus, the potential correlations between the images of the same plant, acquisition session or similar background cannot be entirely excluded. Therefore, the reported test results should be interpreted as the performance at image level on the collected dataset, rather than as conclusive evidence of generalization to independent plants. In future data collection and external validation, we will use plant or session-level splitting to better assess model generalizability.
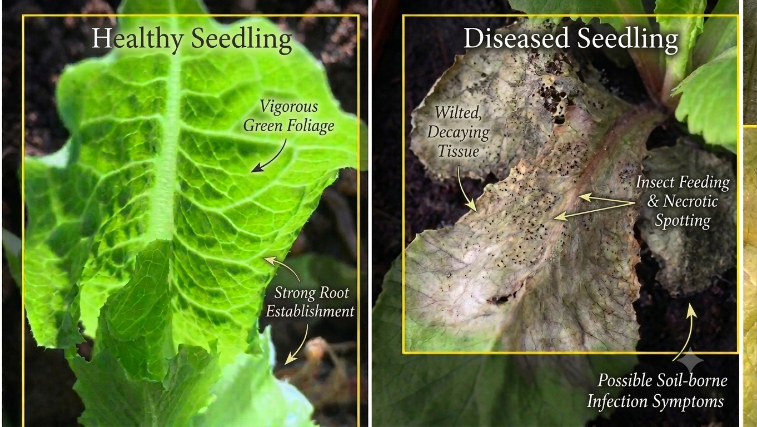
Figure 5 shows the field data collection of healthy and unhealthy lettuce samples. Healthy plants have uniform leaf color, compact morphology and normal growth. Unhealthy plants are discolored, wilted and grow unevenly, stressed by the environment. These visual changes give discriminative features for classification of Healthy/Unhealthy using tested lightweight deep learning model.
Figure 5. Representative samples of healthy and unhealthy lettuce plants collected under field conditions
3.2 Preprocessing and data augmentation
Image preprocessing is an important step to improve the performance and generalization ability of deep learning models by reducing input-data variations and providing consistent image representations prior to training. Field-acquired agricultural images were preprocessed by a unified preprocessing workflow before model training and evaluation [33], due to the variations in illumination, camera viewpoint, background complexity, and environmental conditions.
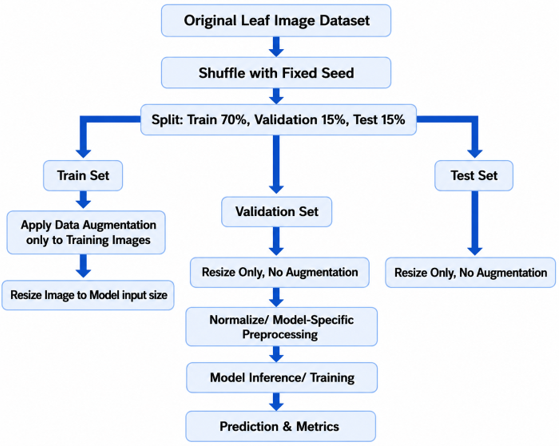
The images were randomly shuffled with a fixed seed and then divided into training, validation, and testing sets at the image level with a ratio of 70:15:15. All images were resized to the same input resolution of 224 × 224 pixels for MobileNetV2, EfficientNet-V2B0, YOLOv8n and SqueezeNet1.1. This combined input configuration provided a stable experimental platform to compare the classification performance and computational efficiency of the lightweight models that were evaluated. Input normalization was performed following the preprocessing requirements of the respective ImageNet-pretrained architectures, while YOLOv8n maintained its native preprocessing pipeline.
Data augmentation was only applied to the training subset to reduce overfitting and to improve robustness to variations encountered under field conditions. The augmentation strategy included random horizontal and vertical flips, rotation of ±15°, ±20% brightness and contrast adjustment, Gaussian blur and random resized cropping. Such transformations imitate realistic variations in the acquisition of agricultural images while maintaining the semantic characteristics of lettuce plants [34]. To evaluate the performance of the model in an unbiased way, the validation and test sets were not augmented. An overview of the whole preprocessing pipeline is shown in Figure 6, which includes dataset partitioning, resizing, normalization, augmentation, and input preparation for the model before training.
Figure 6. Flowchart of the image preprocessing and data augmentation pipeline for a lightweight deep learning model
3.3 Model development and training
Four lightweight deep learning models, MobileNetV2, EfficientNet-V2B0, YOLOv8n, and SqueezeNet1.1, were trained and comparatively tested for binary classification of lettuce images into Healthy and Unhealthy classes. To have a consistent experimental comparison, all models were trained and evaluated with a common input resolution of 224 × 224 pixels and a batch size of 32. This single input configuration removes the bias associated with the input resolution and lets us relate the differences in classification and computational performance primarily to the architectural properties of the models assessed.
For the architectures pre-trained on ImageNet, transfer learning was used to improve convergence and feature extraction from the custom lettuce dataset. MobileNetV2 was implemented with the standard (TensorFlow.keras.applications.MobileNetV2) architecture with ImageNet-pretrained weights, width multiplier α = 1.0, input size 224 × 224 pixels and (include_top = False). The convolutional backbone was followed by a task-specific classification head composed of global average pooling, a fully connected layer with 128 units and ReLU activation, dropout of 0.5 and a final two-unit softmax for Healthy/Unhealthy classification. The implemented MobileNetV2 configuration had an order of 2.42 M parameters.
EfficientNet-V2B0 and SqueezeNet1.1 were also configured similarly for binary image classification with the same input resolution of 224 × 224 pixels, and YOLOv8n was used in classification mode only and not as an object detection model. The models were trained using their respective optimization setups and the best weights were retained based on the validation performance. The classification performance was then assessed on the independent test subset by means of accuracy, precision, recall, F1-score, and complementary class-wise metrics, and the computational efficiency was assessed by means of model complexity and inference-speed measurements [35]. The main training configurations and hyperparameters used for the four evaluated models are outlined in Table 2. The input resolution of 224 × 224 pixels and batch size 32 were used as a common setting to provide a fair experimental basis for comparison.
Table 2. Training configurations and hyperparameters of the evaluated lightweight deep learning models
|
Model |
Input Size |
Batch Size |
Epochs |
Optimizer |
Learning Rate |
|
MobileNetV2 |
224 × 224 |
32 |
10 |
Adam |
1 × 10⁻⁴ |
|
EfficientNet-V2B0 |
224 × 224 |
32 |
10 |
Adam |
1 × 10⁻⁴ |
|
YOLOv8n (Classification) |
224 × 224 |
32 |
10 |
Adam |
1.67 × 10⁻³ |
|
SqueezeNet1.1 |
224 × 224 |
32 |
10 |
Adam |
1 × 10⁻⁴ |
Lightweight deep learning models have emerged as a key enabling technology for real-time edge computing applications by providing high classification performance with fewer computational and memory requirements. In precision agriculture, these models enable efficient monitoring of crop health on embedded platforms with limited processing resources and thus are suitable for autonomous deployment in the field. In this work, four representative lightweight architectures, MobileNetV2, EfficientNet-V2B0, YOLOv8n, and SqueezeNet1.1, are selected based on their different architectural designs and computational features. Each model employs a different optimization approach to balance feature extraction ability, FPS, model complexity, and memory efficiency. The next subsections describe the architectural principles, computational properties, and implementation details of each model, providing the basis for their comparative assessment in real-time lettuce health monitoring and intelligent irrigation applications.
4.1 MobileNetV2
A lightweight CNN, MobileNetV2, was used to perform binary classification on the lettuce images into Healthy and Unhealthy classes. The model was implemented with the standard architecture (TensorFlow.keras.applications.MobileNetV2) with ImageNet pre-trained weights, default width multiplier α = 1.0, input size 224 × 224 and (include_top = False). Its efficient architecture utilizes inverted residual blocks and depthwise separable convolutions to reduce the GFLOPs and extract effective features. The convolutional backbone was followed by a task-specific classification head, consisting of GlobalAveragePooling2D, a fully connected layer with 128 ReLU units, Dropout (0.5) and a final two-unit softmax layer for Healthy/Unhealthy prediction, with around 2.42 million parameters for the present task. The backbone was unfrozen for fine-tuning with end-to-end optimization using Adam optimizer with a learning rate of 1 × 10⁻⁴, categorical cross-entropy loss and batch size of 32. This configuration provides a reproducible definition of the evaluated MobileNetV2 model and distinguishes it from other variants with different width-multipliers and input resolutions, as shown in Table 3.
Table 3. Architectural and computational characteristics of MobileNetV2
|
Category |
Item/Layer Type |
Value |
|
Model Specifications |
Top-1 Accuracy (ImageNet) |
75.3% |
|
Kernel Size |
3 × 3 |
|
|
Architecture (Layer Composition) |
Conv2D Layers |
35 |
|
DepthwiseConv2D Layers |
17 |
|
|
Batch Normalization Layers |
52 |
|
|
ReLU Layers |
35 |
|
|
Residual Add(Skip Connection) Layers |
10 |
|
|
ZeroPadding2D Layers |
4 |
|
|
Global Average Pooling Layers |
1 |
|
|
Dense Layers |
2 |
4.2 EfficientNet-V2B0
EfficientNet-V2B0 is an efficient CNN architecture that aims to find a compromise between classification accuracy and computational cost. Unlike traditional CNN scaling methods that only increase one dimension, such as network depth, width, or input resolution, EfficientNet employs a compound scaling method that uniformly scales all dimensions of depth/width/resolution using a fixed set of scaling coefficients [36]. This approach allows the model to achieve better accuracy-efficiency trade-offs with low GFLOPs. EfficientNet-V2B0 is constructed with mobile inverted bottleneck convolution blocks and squeeze-and-excitation mechanisms to enhance the channel-wise feature representation and improve the classification performance. In this work, EfficientNet-V2B0 was selected because it has a high classification accuracy of 82.8% Top-1 accuracy on ImageNet with approximately 19.35 million parameters and 4.2 GFLOPs, and is powerful in feature extraction. These attributes make it suitable for accurate assessment of lettuce health, but its computational requirements should be considered for real-time edge deployment. Table 4 shows the architectural components and computational specifications of EfficientNet-V2B0, consisting of convolutional layers, normalization layers, activation layers, squeeze-and-excitation blocks, and residual connections.
Table 4. Architectural layers and computational characteristics of EfficientNet-V2B0
|
Category |
Item/Layer Type |
Value |
|
Model Specifications |
Top-1 Accuracy (ImageNet) |
82.8% |
|
Architecture (Layer Composition) |
Conv2D Layers |
75 |
|
Batch Normalization Layers |
59 |
|
|
Activation Layers |
39 |
|
|
DepthwiseConv2D Layers |
16 |
|
|
Global Average Pooling Layers |
17 |
|
|
Multiply Layers (SE Blocks) |
16 |
|
|
Reshape Layers |
16 |
|
|
Residual Add Layers |
15 |
|
|
Normalization Layer |
1 |
|
|
Rescaling Layer |
1 |
4.3 YOLOv8n
In this work, YOLOv8n was used solely in the image-classification mode, for the binary classification of the lettuce images into the Healthy and Unhealthy classes, not for object detection. A common input resolution of 224 × 224 pixels was used to be consistent with the other evaluated lightweight models and to provide a uniform basis for comparative analysis. The classification architecture of YOLOv8n uses a lightweight convolutional backbone to extract features in a hierarchical way, with feature aggregation and a classification head that makes the last prediction of two classes [37]. Its compactness and computational efficiency make it a strong candidate for deployment on resource-constrained edge platforms. Table 5 presents the main architecture configuration of the deployed YOLOv8n classification model. Thus, YOLOv8n is explored and discussed in this work as a classification model, and its performance and computational features are explained particularly when considering the binary classification of lettuce health [38].
Table 5. YOLOv8n architecture for binary classification
|
Component |
Configuration |
|
Model |
YOLOv8n |
|
Task |
Binary image classification |
|
Input size |
224 × 224 |
|
Classes |
Healthy, Unhealthy |
|
Backbone |
Lightweight convolutional feature extractor |
|
Feature extraction |
Hierarchical multi-scale features |
|
Feature aggregation |
Global feature aggregation |
|
Classification head |
Two-class prediction head |
|
Output |
Healthy/Unhealthy |
|
Operating mode |
Classification |
|
Deployment |
TensorFlow Lite on Raspberry Pi 4 |
4.4 SqueezeNet1.1
SqueezeNet1.1 is a small CNN that has been designed to obtain reasonable classification performance with a very small number of parameters, allowing it to be deployed on memory-constrained edge devices [39]. Its architecture is mostly based on the Fire module, which consists of a squeeze layer, using 1 × 1 convolutions to reduce the number of input channels, followed by an expand layer that combines parallel 1 × 1 and 3 × 3 convolutions for feature extraction. This design reduces the computational cost by replacing many 3 × 3 filters with 1 × 1 filters, limiting the number of channels entering the expensive convolutional layers and delaying the downsampling to preserve useful spatial information. Although SqueezeNet1.1 generally achieves lower classification accuracy than more recent lightweight models, its small model size, approximately 1.24 million parameters and 4.8 MB serialized size, makes it attractive for devices with strict memory limitations. The architectural composition and computational specifications of SqueezeNet1.1 are summarized in Table 6, indicating its compact structure and suitability for low-memory edge deployment.
Table 6. Architectural and computational characteristics of SqueezeNet1.1
|
Category |
Item/Layer Type |
Value |
|
Model Specifications |
Top-1 Accuracy (ImageNet) |
58.2% |
|
Parameters |
1.24 million |
|
|
Serialized Size |
4.8 MB |
|
|
Architecture (Layer Composition) |
Conv2D Layers |
25 |
|
Concatenate Layers |
8 |
|
|
MaxPooling2D Layer |
3 |
|
|
Dense Layers |
1 |
|
|
Global Average Pooling |
1 |
|
|
Efficiency Strategies |
1 × 1 convolutions |
This section presents the experimental results of the evaluation of the four lightweight deep learning models, namely MobileNetV2, EfficientNet-V2B0, YOLOv8n and SqueezeNet1.1, for real-time lettuce health classification. The models were evaluated with a set of classification and computational performance measures to assess their feasibility of deployment on resource-constrained edge devices. We evaluate the models in terms of classification accuracy, F1-score, recall, root mean square error (RMSE), FPS, memory consumption and GFLOPs. Furthermore, the trained models were also deployed on a Raspberry Pi 4 to evaluate their real-time inference ability in practical edge computing scenarios. The obtained results are analyzed and discussed to reveal the trade-offs between prediction accuracy, computational efficiency and deployment feasibility to find the most suitable lightweight deep learning model for real-time lettuce health monitoring on resource-constrained edge platforms.
5.1 Classification performance
The classification performance of the proposed lightweight deep learning models was evaluated by means of four popular performance metrics such as accuracy, F1-score, recall, and RMSE. Accuracy is the overall number of correctly classified lettuce images. The F1-score is a balanced measure that combines precision and recall, making it ideal for binary classification. Recall is the ability of the model to correctly identify the unhealthy lettuce plants as reported by Eq. (1), where TP, TN, FP, and FN denote the numbers of true positives, true negatives, false positives, and false negatives, respectively. RMSE is the prediction error. Lower RMSE values indicate better classification performance. The mathematical expressions for computing the F1-score and classification accuracy are given by Eqs. (2) and (3), respectively. Specificity measures the ability of the classifier to correctly identify negative samples and complements Recall by quantifying the true-negative recognition performance as described by Eq. (4).
Recall$=\frac{T_P}{T_P+F_N}$ (1)
$F_1-$score$=\frac{2 \times \text {Precision} \text {×} \text {Recall}}{\text {Precision}+ \text {Recall}} \times 100 \%$ (2)
Accuracy$=\frac{\text {Number of correct predictions}}{\text {Total Number of Prediction}} \times 100 \%$ (3)
Specificity$=\frac{T_N}{T_N+F_P}$ (4)
The confusion matrix was also used to derive metrics for each class (Healthy and Unhealthy) to evaluate the binary lettuce-health classification in more detail. In addition to overall Accuracy, Precision, Recall (Sensitivity), Specificity and F1-score were computed for each class separately. Macro averaging was used to report Precision, Recall, and F1-score values, giving equal weight to both classes. Where probability outputs were available, ROC-AUC was also used to assess the discrimination ability of each model regardless of the classification threshold.
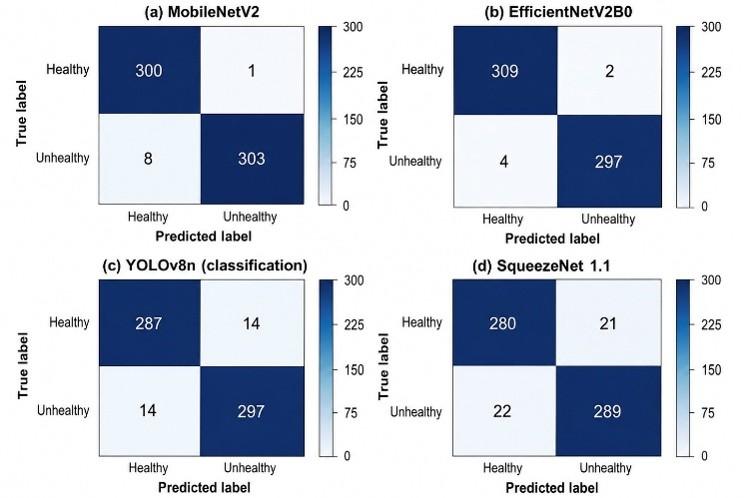
The class-wise evaluation of the four models for classification of Healthy and Unhealthy lettuce is presented in the confusion matrices of Figure 7. EfficientNet-V2B0 showed the most balanced predictions with the least number of misclassifications, while SqueezeNet1.1 showed relatively higher classification errors. These results are complementary to the overall performance indicators by showing explicitly correct and incorrect predictions for each class.
Figure 7. Confusion matrices of the evaluated lightweight deep learning models for healthy and unhealthy lettuce classification
The single-run classification performance of EfficientNet-V2B0 is the best, with the highest accuracy, F1-score, and recall of 99.02% and the lowest RMSE of 0.0990, as shown in Table 7. The EfficientNet-V2B0 was the best model in classification performance among the evaluated models, with 99.02% accuracy, 99.02% F1-score, 99.02% recall, and the lowest RMSE of 0.099, showing the best ability to distinguish between healthy and unhealthy lettuce plants. MobileNetV2 came in a close second with an accuracy of 98.53%, an F1-score of 94.92%, a recall of 94.93% and an RMSE of 0.2251, but with much lower GFLOPs. In comparison, YOLOv8n obtained a classification accuracy of 95.42% and the RMSE was equal to 0.213, while the lowest classification accuracy (93.00%) and the highest prediction error (RMSE = 0.2651) were obtained by SqueezeNet1.1.
Table 7. Single-run classification performance of the evaluated deep learning models
|
Model |
Samples (N) |
Accuracy (%) |
F1-Score (%) |
Recall (%) |
RMSE |
|
EfficientNet-V2B0 |
612 |
99.02 |
99.02 |
99.02 |
0.0990 |
|
YOLOv8n |
612 |
95.42 |
95.42 |
95.42 |
0.2139 |
|
MobileNetV2 |
612 |
98.53 |
94.92 |
94.93 |
0.2251 |
|
SqueezeNet1.1 |
612 |
93.00 |
92.97 |
92.97 |
0.2651 |
These results were obtained using the held-out test subset of the same custom dataset used for model development, and therefore characterize in-dataset test performance rather than external generalization to different farms, seasons, cameras, and lettuce varieties. It is important to point out that the classification results presented were obtained from one run of each model in the experiment, thus the variability of different random seeds, standard deviations and confidence intervals could not be measured. Therefore, the observed model ranking should be interpreted according to the current single-run evaluation, and repeated experiments with multiple random seeds are required for further statistical validation.
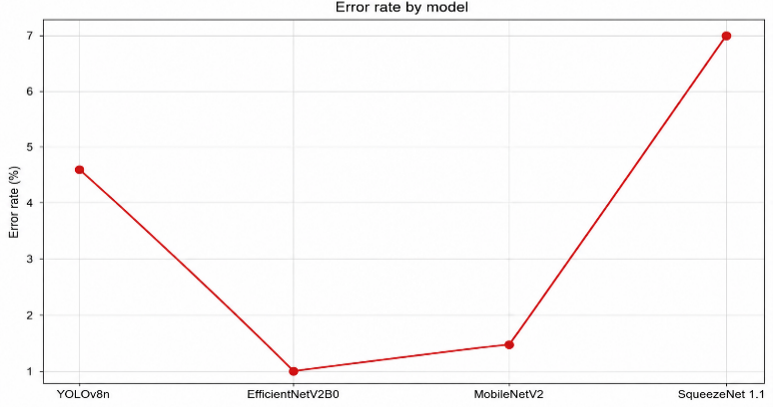
Figure 8 shows the corresponding classification error rates to further illustrate the relative performance of the evaluated models. As shown in the figure, the lowest classification error was achieved by EfficientNet-V2B0 with 1.0%, followed by MobileNetV2 with 1.47%, YOLOv8n with 4.58%, and SqueezeNet1.1 with 7.0%. These results demonstrate that although EfficientNet-V2B0 achieves the highest classification accuracy, MobileNetV2 has comparable prediction performance but better computational efficiency for real-time edge deployment. Therefore, the classification results show that both models are very effective for lettuce health monitoring, while YOLOv8n and SqueezeNet1.1 provide alternative solutions when FPS or memory restrictions are preferred.
Figure 8. Classification error rates of the evaluated lightweight deep learning models
In addition, the reported performance was only tested on a held-out test subset coming from the same custom dataset used to develop the models with no independent externally collected test set. Therefore, the results are performance under the conditions represented by the current dataset and are not evidence of broad generalization across different farms, seasons, cameras, or lettuce varieties. External validation under independent agricultural conditions is needed to determine broader model robustness and generalizability.
5.2 Computational efficiency and edge deployment
Besides classification performance, the computational efficiency of the evaluated lightweight models was assessed to determine their suitability for resource-constrained Edge AI applications. The evaluation considered the number of parameters, model size, GFLOPs, FPS and per-image latency. For the sake of comparison consistency, MobileNetV2, EfficientNet-V2B0, YOLOv8n and SqueezeNet were evaluated on a uniform input resolution of 224 × 224 pixels. To prevent the mixing of measurements obtained under different execution environments, desktop computational characteristics have been analyzed separately from edge-deployment performance.
Table 8 shows the computational characteristics and desktop performance of the four models. MobileNetV2 had the least GFLOPs of 0.61 GFLOPs, and EfficientNet-V2B0 had the highest classification accuracy of 99.02%. YOLOv8n had the fastest desktop FPS at 20.05 FPS. The results show different trade-offs between accuracy and efficiency for the architectures tested before deployment at the edge.
Table 8. Computational characteristics and desktop performance of the evaluated models
|
Model |
Input Size |
Parameters [M] |
Accuracy [%] |
Model Size [MB] |
Complexity [GFLOPs] |
Desktop Speed [FPS] |
|
EfficientNet-V2B0 |
224 × 224 |
19.35 |
99.02 |
25.26 |
1.46 |
4.93 |
|
SqueezeNet1.1 |
224 × 224 |
1.24 |
93.00 |
8.62 |
1.68 |
8.75 |
|
MobileNetV2 |
224 × 224 |
2.42 |
98.53 |
11.01 |
0.61 |
7.69 |
|
YOLOv8n |
224 × 224 |
3.20 |
95.42 |
5.55 |
8.13 |
20.05 |
Table 9. TensorFlow Lite inference performance of the evaluated models on Raspberry Pi 4
|
Model |
Input Size |
Parameters (M) |
Raspberry Pi [FPS] |
Latency [ms/image] |
|
MobileNetV2 |
224 × 224 |
2.42 |
7.40 |
135.1 |
|
EfficientNet-V2B0 |
224 × 224 |
19.35 |
4.55 |
219.8 |
|
YOLOv8n |
224 × 224 |
3.20 |
18.05 |
55.4 |
|
SqueezeNet1.1 |
224 × 224 |
1.24 |
8.10 |
123.5 |
The trained models were deployed on a local Raspberry Pi 4 Model B with a 1.8 GHz quad-core 64-bit ARM Cortex-A72 processor for edge evaluation. Inference was performed on single images with a batch size of 1 to mimic the intended real-time monitoring scenario. The edge evaluation was performed on the specified test subset of 916 images. FPS was reported in FPS, which is the number of test images processed per second and the corresponding average per-image latency was derived as 1000/FPS and reported in ms/image. The edge inference rates measured were 18.05 FPS for YOLOv8n, 8.10 FPS for SqueezeNet, 7.40 FPS for MobileNetV2, and 4.55 FPS for EfficientNet-V2B0 with estimated latencies of 55.4, 123.5, 135.1 and 219.8 ms/image, respectively. Detailed CPU-thread configuration, warm-up runs, power consumption and peak runtime memory were not systematically recorded during the original benchmarking and were not retrospectively estimated or quantitatively compared. These factors are recognized as limitations of the current edge-device benchmarking protocol. Table 9 summarizes the results, where YOLOv8n has the highest FPS of 18.05 FPS (55.4 ms/image) followed by SqueezeNet at 8.10 FPS (123.5 ms/image), MobileNetV2 at 7.40 FPS (135.1 ms/image) and the lowest edge FPS of 4.55 FPS (219.8 ms/image) for EfficientNet-V2B0.
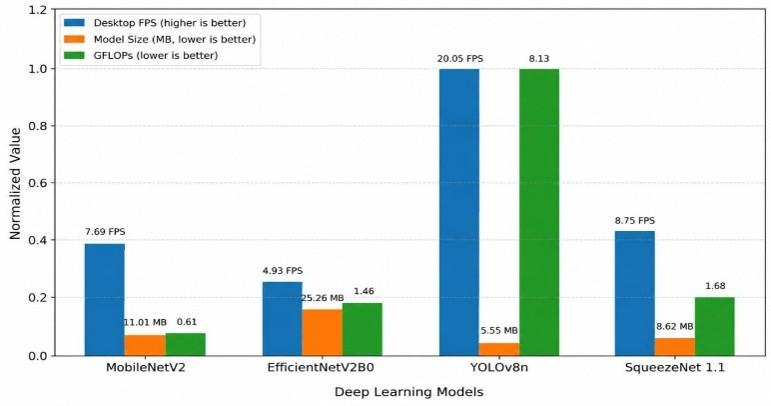
The comparative results show that EfficientNet-V2B0 provided the best classification performance but required more computational resources, leading to slower edge inference, while YOLOv8n provided the fastest TensorFlow Lite inference on the Raspberry Pi 4. The MobileNetV2 model provided a good balance between classification accuracy, GFLOPs, and fast, real-world edge FPS. We also show the computational trade-offs of the evaluated models in terms of FPS, GFLOPs and memory requirements further in Figure 9. However, the runtime memory, detailed CPU-thread configuration, warm-up runs, and power consumption were not systematically measured under the same deployment conditions and thus not quantitatively compared. Overall, the results confirm the practical feasibility of lightweight deep learning for real-time lettuce health monitoring on Edge AI platforms based on Raspberry Pi, while highlighting the trade-off between predictive accuracy and computational efficiency.
Figure 9. Comparative computational performance of the evaluated models
Table 10 compares representative studies in a focused way in terms of dataset size, recognition or monitoring task, AI method, edge hardware, inference performance, irrigation-control strategy, key numerical results, and reported limitations. Previous studies have made substantial progress in crop monitoring, disease detection, IoT-based sensing and automated irrigation. However, the experimental scope and deployment conditions vary widely, and direct comparisons are often limited by differences in datasets, tasks, hardware platforms, and reported computational metrics. In particular, a limited number of studies systematically evaluate different lightweight deep learning architectures on the same agricultural dataset and under a common edge-oriented experimental setting. The present study addresses this particular gap by comparatively evaluating MobileNetV2, EfficientNet-V2B0, YOLOv8n, and SqueezeNet for Healthy/Unhealthy lettuce classification and evaluating their computational characteristics and Raspberry Pi 4 deployment performance. Irrigation control is not experimentally evaluated in the present work and is therefore only treated as a potential future integration of the proposed monitoring framework.
Table 10. Comparative analysis of representative AI- and IoT-based approaches for crop monitoring and intelligent irrigation
|
Ref. /Year |
Dataset/Size |
Recognition/Monitoring Task |
AI Method |
Edge Hardware |
Inference Speed (FPS) |
Irrigation-Control Method |
Key Numerical Result |
Main Limitation |
|
[18] 2024 |
Historical weather/IoT data; N/R |
Real-time rainfall prediction |
Bi-LSTM |
Arduino MKR1010 |
N/R |
Forecast-assisted irrigation |
Acc. 92%; R² 0.91; RMSE 0.40 |
No visual plant-health assessment |
|
[19] 2024 |
Environmental IoT data; 85:15 split |
Water-demand prediction |
GBT |
N/R |
N/R |
AI-based irrigation scheduling |
R² 0.92; MAE 0.84; MSE 1.00 |
No image-based health assessment |
|
[23] 2025 |
Plant-leaf images; N/R |
Plant-disease detection |
YOLOv7/YOLOv8 |
N/R |
N/R |
None |
mAP 91.05%; P 91.22%; R 87.66%; F1 89.40% |
No irrigation integration |
|
[24] 2024 |
5,280 tomato-leaf images |
Healthy/unhealthy classification |
Modified MobileNetV2 |
N/R |
N/R |
None |
Acc. 95.3% |
No IoT sensing/irrigation |
|
[25] 2026 |
38 plant classes |
Disease classification + treatment recommendation |
EfficientNet-V2B0 |
Desktop |
N/R |
None |
Overall value N/R |
No IoT/irrigation integration |
|
[26] 2026 |
PlantVillage + field potato images |
Potato-disease classification |
YOLOv8n/s/m |
N/R |
N/R |
None |
Acc. 96%; P 96%; R 94%; F1 95% |
No irrigation actuation |
|
[27] 2025 |
Healthy/diseased leaf datasets; N/R |
Plant identification/disease diagnosis |
SqueezeNet1.1 + SVM |
N/R |
N/R |
None |
Acc. 96.9–100% |
No sensor–irrigation integration |
|
[28] 2025 |
Environmental IoT sensor data; N/R |
Intelligent irrigation decision |
Fuzzy + DNN |
IoT/WSN |
N/R |
Automatic fuzzy control |
Quantitative irrigation evaluation |
No visual health assessment |
|
This work |
6,107 field-acquired lettuce images |
Healthy/Unhealthy lettuce classification |
MobileNetV2EfficientNet-V2B0, YOLOv8n, SqueezeNet1.1 |
Raspberry Pi 4 |
18.05 FPS (max.) |
Not experimentally evaluated |
Best Acc. 99.02%; fastest edge inference 18.05 FPS (55.4 ms/image) |
No external validation or closed-loop irrigation evaluation |
This paper introduced an Edge AI framework for real-time lettuce health monitoring was introduced and a comparative analysis of four lightweight deep learning models was performed on a custom dataset of 6,107 images of lettuces acquired in the field. In the usual 224 × 224 input setting, EfficientNet-V2B0 produced the highest classification accuracy of 99.02%, while MobileNetV2 (98.53%), YOLOv8n (95.42%), and SqueezeNet1.1 (93.00%) came after. For FPS at the edge, YOLOv8n was the fastest (18.05 FPS, 55.4 ms/image) on the Raspberry Pi 4 using TensorFlow Lite, followed by SqueezeNet1.1 (8.10 FPS), MobileNetV2 (7.40 FPS) and EfficientNet-V2B0 (4.55 FPS). These results indicate a clear trade-off between prediction accuracy and computational efficiency. Although EfficientNet-V2B0 achieved the best classification performance, YOLOv8n was the fastest in edge inference. Nevertheless, the evaluation was limited to a held-out subset of the same custom dataset and did not empirically validate closed-loop irrigation control. Therefore, future work should include external validation on different farms, seasons, cameras and lettuce varieties, as well as repeated evaluations with multiple random seeds and experimental integration with environmental sensing and irrigation control systems.
The authors would like to express their sincere gratitude to the Technical Engineering College/Mosul, Northern Technical University, Iraq, for providing the facilities, technical resources, and academic environment that supported the completion of this research. The authors also appreciate the valuable guidance and support received from the Department of Computer Techniques Engineering throughout the development and implementation of this work.
|
AI |
Artificial Intelligence |
|
CNN |
Convolutional Neural Network |
|
FPS |
Frames Per Second |
|
GFLOPs |
Giga Floating Point Operations |
|
GPIO |
General Purpose Input/Output |
|
GPU |
Graphics Processing Unit |
|
IoT |
Internet of Things |
|
MBConv |
Mobile Inverted Bottleneck Convolution |
|
RMSE |
Root Mean Square Error |
|
SE |
Squeeze-and-Excitation |
|
TFLite |
TensorFlow Lite |
|
Greek symbols |
|
|
α |
Learning rate coefficient |
|
Subscripts |
|
|
Acc |
Classification accuracy (%) |
|
P |
Precision |
|
TP |
True Positive |
|
N |
Number of samples |
|
M |
Number of evaluated models |
[1] Obaid, M.K., Alazzai, W.K., Abood, B.S.Z., Al-Farouni, M. (2024). Sustainable agriculture practices: AI and IoT’s vital contribution. E3S Web of Conferences, 491: 01025. https://doi.org/10.1051/e3sconf/202449101025
[2] Jaiswal, P., Shrivastava, P.C. (2026). Predicting and managing crop health through Artificial Intelligence and IoT. In Advancing Precision Agriculture with AI and IoT, pp. 203-234. https://doi.org/10.4018/979-8-3373-7257-0.ch008
[3] Yadav, M., Preety, Saxena, E., Das, A. (2024). Smart agriculture system using artificial intelligence and Internet of Things. In Reshaping Intelligent Business and Industry, pp. 403-418. https://doi.org/10.1002/9781119905202.ch27
[4] Aggarwal, N., Singh, D. (2021). Technology assisted farming: Implications of IoT and AI. IOP Conference Series: Materials Science and Engineering, 1022(1): 012080. https://doi.org/10.1088/1757-899x/1022/1/012080
[5] Cisse, A., Diallo, O., Ndoye, E.H.M., Sene, O. (2025). Review of smart agriculture for resource-limited areas highlighting limits, opportunities and key-challenges for sustainable IoT and AI-based solutions. Discover Computing, 28(1): 324. https://doi.org/10.1007/s10791-025-09883-w
[6] Elbasi, E., Alzoubi, Y.I., Topcu, A.E., Nadeem, M. (2025). Green AI for smart agriculture: Energy-efficient predictive models for crop yield and resource management. IEEE Access, 13: 204924-204953. https://doi.org/10.1109/access.2025.3637027
[7] AlZubi, A.A., Galyna, K. (2023). Artificial intelligence and internet of things for sustainable farming and smart agriculture. IEEE Access, 11: 78686-78692. https://doi.org/10.1109/access.2023.3298215
[8] Ghazi, N.M., Tahir, H.T., Othman, S.S., Hawar, D.A., Abdulkadir, M.A., Korkmaz, C. (2025). Smart irrigation systems: A comprehensive review of IoT, AI, and sustainable agriculture technologies. A review article. Kirkuk University Journal for Agricultural Sciences, 16(4): 266-281. https://doi.org/10.58928/ku25.16429
[9] Soy, A., Salwadkar, M. (2024). Smart irrigation systems using IoT and AI for efficient water resource management. National Journal of Smart Agriculture and Rural Innovation, 2(1): 26-32.
[10] Abdulwahab, E., Younis, A.K. (2024). Surveillance system based on face recognition utilizing deep learning technique. In 2024 1st International Conference on Emerging Technologies for Dependable Internet of Things (ICETI), Sana'a, Yemen, pp. 1-6. https://doi.org/10.1109/iceti63946.2024.10777082
[11] Pauzi, N.A.M., Mustaza, S.M., Zainal, N., Zaman, M.H.M., Moubark, A.M. (2025). Artificial intelligence in precision agriculture: A review. Jurnal Kejuruteraan, 37(2): 1025-1047. https://doi.org/10.17576/jkukm-2025-37(2)-38
[12] Bablu, T.A., Rashid, M.T. (2025). Edge computing and its impact on real-time data processing for IoT-driven applications. Journal of Advanced Computing Systems, 5(1): 26-43.
[13] Sharma, K., Shivandu, S.K. (2024). Integrating artificial intelligence and internet of things (IoT) for enhanced crop monitoring and management in precision agriculture. Sensors International, 5: 100292. https://doi.org/10.1016/j.sintl.2024.100292
[14] Younis, B.M.K., Younis, A.K. (2021). Hardware accelerator for anti-aliasing Wu's line algorithm using FPGA. TELKOMNIKA (Telecommunication Computing Electronics and Control), 19(2): 672-682. https://doi.org/10.12928/telkomnika.v19i2.18158
[15] Reginald, P.J. (2024). Integrating IoT and AI for precision irrigation and intelligent nutrient management in smart agriculture. National Journal of Plant Sciences and Smart Horticulture, pp. 34-39.
[16] Shaukat, A. (2022). Information systems for smart agriculture: Integrating AI, IoT, and environmental science. Multidisciplinary Research in Computing and Information Systems, 2(3): 144-159. https://doi.org/10.71465/mrcis31
[17] Thakur, R., Rahate, K., Borkar, P. (2026). An intelligent smart farming advisory system using integrating IoT sensor networks and generative AI for real-time crop management and decision support system. Advanced International Journal for Research, 7(3): 26035689. https://doi.org/10.63363/aijfr.2026.v07i03.5689
[18] Peeriga, R., Rinku, D.R., Bhaskar, J.U., et al. (2024). Real-time rain prediction in agriculture using AI and IoT: A bi-directional LSTM approach. Engineering, Technology & Applied Science Research, 14(4): 15805-15812. https://doi.org/10.48084/etasr.8011
[19] Benhmad, T., Rhaimi, C.B., Alomari, S., Aljuhani, L. (2024). Design and implementation of an integrated IoT and artificial intelligence system for smart irrigation management. International Journal of Advances in Soft Computing & Its Applications, 16(1): 197. https://doi.org/10.15849/ijasca.240330.12
[20] Arlanova, A.A., Hojamkuliyeva, B.A., Babanazarov, N.S., Arlanov, M.S. (2025). Artificial intelligence for smart irrigation: Reducing water consumption and improving agricultural output. E3S Web of Conferences, 623: 04001. https://doi.org/10.1051/e3sconf/202562304001
[21] Martelli, A., Rapinesi, D., Verdi, L., Donati, I.I.M., Dalla Marta, A., Altobelli, F. (2025). Smart irrigation for management of processing tomato: A machine learning approach. Irrigation Science, 43(6): 1407-1424. https://doi.org/10.1007/s00271-024-00993-9
[22] Pandey, P., Agarwal, S. (2023). A low-cost smart irrigation planning based on machine learning and Internet of Things. Current Agriculture Research Journal, 11(2): 568-579. https://doi.org/10.12944/carj.11.2.19
[23] Riayth, A.M., Jarjees, M.S., Younis, A.K. (2023). A review of sickle cells classification system based on microscopic images. AIP Conference Proceedings, 2862(1). https://doi.org/10.1063/5.0181048
[24] Kumar, E.S., Kumar, A., Vardhan, H., Prasanth, R., Sai, P.P. (2024). Classification of healthy and unhealthy leaf disease using modified MobileNetV2. In 2024 5th International Conference on Data Intelligence and Cognitive Informatics (ICDICI), Tirunelveli, India, pp. 482-488. https://doi.org/10.1109/icdici62993.2024.10810763
[25] Karthik, Kadava, R.N., Eswari, B., PremKumar, G., Livingstone, G.V., Sai Jahnavi, M. (2026). Plant leaf disease classification using EfficientNet-V2B0 with treatment recommendation. In 2026 2nd International Conference on Computing, Communication and Green Engineering (CCGE), Pune, India, pp. 1-6. https://doi.org/10.1109/ccge67142.2026.11581469
[26] Alkhammash, E.H. (2026). The application of YOLOv8n, YOLOv8s, and YOLOv8m for potato leaf diseases classification. Potato Research, 69(2): 50. https://doi.org/10.1007/s11540-025-09956-9
[27] Kabel, S.A.E.M., El-Shafai, W., El-Samie, F.E.A., Mohamed, B. (2025). Enhanced plant identification and disease diagnosis through SqueezeNet1.1 and SVM for smart agriculture applications. Iran Journal of Computer Science, 8(4): 1353-1369. https://doi.org/10.1007/s42044-025-00237-9
[28] Liu, X., Zhao, Z., Rezaeipanah, A. (2025). Intelligent and automatic irrigation system based on Internet of Things using fuzzy control technology. Scientific Reports, 15(1): 14577. https://doi.org/10.1038/s41598-025-98137-2
[29] Srivastav, A.K., Das, P. (2025). Edge computing and AI in agricultural IoT. In Biotechnology and IoT in Agriculture and Food Production, pp. 187-200. https://doi.org/10.1007/979-8-8688-1469-3_21
[30] Restrepo-Arias, J.F., Branch-Bedoya, J.W., Awad, G. (2024). Image classification on smart agriculture platforms: Systematic literature review. Artificial Intelligence in Agriculture, 13: 1-17. https://doi.org/10.1016/j.aiia.2024.06.002
[31] Sharmila, B.S., Santhosh, H.S., Parameshwara, S., Swamy, M.S., Baig, W.H., Nanditha, S.V. (2023). Optimizing deep learning networks for edge devices with an instance of skin cancer and corn leaf disease dataset. SN Computer Science, 4(6): 793. https://doi.org/10.1007/s42979-023-02239-5
[32] Maharani, D.A., Utaminingrum, F., Husnina, D.N.N., et al. (2025). A review: Lightweight architecture model in deep learning approach for lung disease identification. Computers in Biology and Medicine, 194: 110425. https://doi.org/10.1016/j.compbiomed.2025.110425
[33] Lakshmanarao, A., Supriya, N., Arulmurugan, A. (2022). Plant disease prediction using transfer learning techniques. In 2022 Second International Conference on Advances in Electrical, Computing, Communication and Sustainable Technologies (ICAECT), Bhilai, India, pp. 1-5. https://doi.org/10.1109/icaect54875.2022.9807956
[34] Zhao, C.T., Wang, R.F., Tu, Y.H., Pang, X.X., Su, W.H. (2024). Automatic lettuce weed detection and classification based on optimized convolutional neural networks for robotic weed control. Agronomy, 14(12): 2838. https://doi.org/10.3390/agronomy14122838
[35] Sandler, M., Howard, A., Zhu, M., Zhmoginov, A., Chen, L.C. (2018). MobileNetV2: Inverted residuals and linear bottlenecks. In 2018 IEEE/CVF Conference on Computer Vision and Pattern Recognition, Salt Lake City, UT, USA, pp. 4510-4520. https://doi.org/10.1109/cvpr.2018.00474
[36] Tan, M., Le, Q. (2019). EfficientNet: Rethinking model scaling for convolutional neural networks. In International Conference on Machine Learning, Milan, Italy, pp. 6105-6114. https://doi.org/10.48550/arXiv.1905.11946
[37] Terven, J., Córdova-Esparza, D.-M., Romero-González, J.-A. (2023). A comprehensive review of YOLO architectures in computer vision: From YOLOv1 to YOLOv8 and YOLO-NAS. Machine Learning and Knowledge Extraction, 5(4): 1680-1716. https://doi.org/10.3390/make5040083
[38] Wang, X., Liu, J. (2024). Vegetable disease detection using an improved YOLOv8 algorithm in the greenhouse plant environment. Scientific Reports, 14(1): 4261. https://doi.org/10.1038/s41598-024-54540-9
[39] Liu, Y., Li, Z., Chen, X., Gong, G., Lu, H. (2020). Improving the accuracy of SqueezeNet1.1 with negligible extra computational cost. In 2020 International Conference on High Performance Big Data and Intelligent Systems (HPBD&IS), Shenzhen, China, pp. 1-6. https://doi.org/10.1109/hpbdis49115.2020.9130577