Luqman Khaleel Hyder Alatrushi | Yasir Hassan Ali | Zainab Qusay Shareef | Emad Toma Karash* | Hasan Mahmood Kaedhi | Ahmed Mohammed Mahmood | Jamal Nayief Sultan
© 2026 The authors. This article is published by IIETA and is licensed under the CC BY 4.0 license (http://creativecommons.org/licenses/by/4.0/).
OPEN ACCESS
Solid-state welding techniques, such as friction stir welding (FSW), are widely used to permanently join metal components without melting them. This is achieved by utilizing the heat generated by friction and elastic deformation to form a strong bond between the materials. This technique is of paramount importance for aluminum alloys, where precise microstructure control plays a crucial role in achieving good mechanical properties. During the welding process, distinct thermal zones are formed, each possessing its own unique structural characteristics due to temperature variations and material flow. This study aims to investigate the effect of welding parameters, especially rotational speed and linear motion speed, on the microstructure and toughness of two different aluminum alloys, AA7075-O and AA2024-T6. To achieve this objective, three distinct zones in the weld area were selected and analyzed using an optical microscope to observe any changes in their structure and evaluate their effects at the mechanical level in terms of hardness and grain size. The study demonstrated that the particle size is precise and homogeneous, which enhances the controlled toughness and strength of the weld joints when using FSW. Microscopic examination revealed that particle size in the mixing zone increases with increasing welding pen speed while maintaining a constant feed cart speed. Conversely, increasing the feed cart speed while keeping the welding pen speed constant results in a decrease in particle size in the mixing zone. Furthermore, increasing the feed rate leads to increased brittleness of the second-phase particles in the mixing zone, resulting in a decrease in hardness.
compression, microstructure, hardness, friction stir welding, AA-2024-O, AA-7075-T6, deformation
Friction stir welding (FSW) is currently extensively practiced in the automobile and aerospace industries, among others. FSW was invented and patented by the Welding Institute of the UK in 1990 for the welding of plates in a solid state [1]. FSW is an ideal welding process to use for aircraft fuel tanks [2, 3]. Friction stir welds were shown to be comparable to and occasionally even superior to riveted connections after successful static and dynamic testing [3-5]. According to the study's results, welded joints exhibit same corrosion resistance that is comparable to the corrosion resistance of the original material models in the stirring area, which is caused by friction during the FSW process [6]. During welding, the base metal (BM) undergoes significant plastic and heat deformation depending on the degree of thermo-mechanical coupling, producing four unique areas across the joint cross-section: The stir zone, the thermo-mechanically affected region, the heat-affected region, and the BM [7, 8]. As a result, there would be variations in the mechanical characteristics and corrosion behavior within these different zones; this is especially for welded joints of dissimilar metal pieces [9, 10]. After the welding and heating processes are complete, the sheets are moved. Due to friction between the welding tool and the plates' upper surface, the welding tool heats the plates to the point of softening them. It also works to move the metal by mixing as a result of the rotational movement of the welding tool and the support, which causes plastic deformation. As a result, the seam will be joined. Metal mixing and plastic deformation at high temperatures produce a small-grained microstructure with equal axes [11-13]. According to several microhardness measurements [14], the heat-affected region has a substantially lower hardness than the surrounding material. FSW is a wonderful approach to utilize both of the two aluminum alloys because they each have unique features. According to the study [15], the microstructural properties and tensile performance of friction stir welded joints made from the two dissimilar aluminum alloys were studied. The study [16] used the FSW method to examine the mechanical strength and structural makeup of different aluminum welds. According to their investigation, when the aluminum grain size reduced from the top to the middle, the SiC particle size did not change significantly. In Study [17], movement speeds ranging from 25 to 300 mm/min and tool rotation speeds of 800 and 1250 rpm were used. The microstructure, mechanical properties, and fracture surfaces of the joints were investigated. The results showed optimal welding forces of 396 and 360 MPa were achieved in underwater and air-cooled welds at tool rotation speeds of 800 rpm and movement speeds of 50 mm/min. The research [18] involved the frictional welding of AA 3003 aluminum alloys with different primary microstructures under various welding conditions. The evolution of the microstructure and mechanical properties of the weld joints was studied. The results obtained from this study showed that the recrystallized grain size and the amount of second-phase particles in the weld zone (WNZ) decrease with decreasing ambient welding temperature. The study [19] was done to find out the influence of weld shoulder shapes on grain microstructure and crystalline texture formation in the center interface zone (CIZ) and bottom interface zone (BIZ) of AA2024/AA7075 joints by means of quantitative electron backscattered diffraction. Based on the results obtained, there is a considerable presence of coarse and fine grains of an axial structure in the CIZ and BIZ of joints produced with concentric circle shoulder (CCS) and three-helix shoulder (THS). Also, it was observed that the grain sizes in the BIZ were smaller than those of the CIZ of the same joint formed through CCS and THS. The study [20] proved that most weld joints on the side containing the aluminum alloy (AA2024) failed in the heat-affected zone (HAZ) region, while a few failed in the melt zone. Furthermore, it was found that the elongation and overall strength of the welded joints were lower than those of the original alloys without the use of welding technology. The microstructure and mechanical characteristics of butt joints made from two different aluminum alloys and friction-welded were examined in study [21]. With increasing tool rotation speed, a rise in joint strength was seen in the tensile strength test. The models utilized on the aluminum alloy (6061) side frequently failed and broke. FSW was used to join two different aluminum alloys together [22]. The moving side has the aluminum ingot (7075), while the retreating side has the aluminum alloy (5083). Additionally, a neural network and an algorithm were employed to enhance the welding process's mechanical characteristics, internal structure, and grain size regulation.
The mechanical characteristics and microstructure of 5083-7B04 welds were described by the study [23]. Three different heat treatment methods artificial aging, natural aging, and annealing were used in this investigation on the 7B04 alloy. The joint between the artificially aged 7B04 alloy and the 5083 alloy placed on the advancing side exhibited the best material mixing behavior and mechanical performance, with a tensile strength of 525 MPa. Study [24] investigated how process variables, including rotational and travel speeds, affect the macrostructure, microhardness, and mechanical properties of FSW butt joints fabricated from dissimilar materials. The macroscopic observations showed the stir zone to have different forms and flaws brought on by both too much and not enough heat input. Aerospace aluminum alloys that are challenging to weld can be joined using the clean welding technique of FSW. The friction stir welded joints' tensile characteristics, microhardness, microstructure, and fracture surfaces were examined. At the stir zone, grain refinement is seen as a result of dynamic recrystallization brought on by extreme plastic deformation. The minimum strength for a dissimilar joint metal is seen mostly as a result of the base materials' inhomogeneous movement as a result of variations in their mechanical and physical properties [25]. Numerous studies have examined various FSW parameters, including altering the welding cart's linear speed, the feeding pen rotational speed, and various metal types, particularly aluminum alloys. Studies [26-33] aimed to enhance the internal composition and mechanical characteristics of the welded objects. The researchers may get different FSW links from alloys in the 2xxx and 7xxx families, according to previously published works. In order to determine whether it is possible to accelerate the welding process by increasing welding tool speed without compromising the joint's strength characteristics, a study is still being done on the impact of welding process factors on the attributes of these junctions. In addition, the heat input ratio can be used to evaluate the combined impact of the FSW factors. Since solid connections between alloys (AA-2024-O and AA-7075-T6) with appropriate mechanical properties are desired, this study aims to understand the internal structure of the weld zone and its surrounding areas.
In this paper, the impact of varying the linear speed of the welding tool and the feed on the microstructure of two dissimilar aluminum alloys will be examined. The FSW method will be used to choose various regions of the two welded alloys' surfaces to study. Because the temperatures brought on by the friction process are not equal, these places are situated at the start of the welding time, halfway of the welding process, and at the end of the welding time; this allows us to determine the difference in the internal composition.
2.1 Materials and techniques
Two different alloys were prepared (sheets of heat-treated aluminum alloys (AA2024-O and AA7075-T6). Each had nine models, each model had dimensions of (100 × 100 × 6 mm), by using FSW. The welding tools were rotated at various speeds (1000, 1250, and 1525 rpm), and various speeds for welding feed (20, 40, 600 mm/min). The chemical composition of several aluminum alloys is shown in study [26], together with the values of the international standard d ratios adopted by the European Aluminum Association (EAA). The cutting pin tool's rotational speed and the feed's linear speed for each of the nine variants are shown in Table 1. The welding tool used in this study was cylindrical, 18.25 mm in diameter, and made of high-speed steel. It had a conical tip with a base diameter of 5.75 mm, a pointed tip of 4.75 mm, and a height of 2.95 mm, which represents plunge depth. The welding angle 2.25° of the welding tool from the vertical axis was chosen because it yielded the best welds in practical experiments conducted by varying the tool's angle of inclination. The tool rotated clockwise during welding, and the material on the advancing side was AA2024-O. Vickers hardness was measured according to ASTM E384 using a [Zwick typ./Roell Z HVVickers's] with a load of [400 gm] and dwell time of [15 s]. Measurements were taken in the BM, HAZ, TMAZ, and WNZ, with repeated readings at each location. Grain size was measured according to ASTM E112 using the line-intercept method and calibrated optical microscopy.
Table 1. Welding parameters for the nine experimental groups
|
NO. |
Group Number |
Rotational Speed (rpm) |
Linear Speed (mm/min) |
|
1 |
First |
1000 |
20 |
|
2 |
Second |
40 |
|
|
3 |
Third |
60 |
|
|
4 |
Fourth |
1250 |
20 |
|
5 |
Fifth |
40 |
|
|
6 |
Sixth |
60 |
|
|
7 |
Seventh |
1525 |
30 |
|
8 |
Eighth |
40 |
|
|
9 |
Ninth |
60 |
2.2 Examination areas
The welded pieces were examined microscopically at different locations, namely at the beginning of the weld process, midway, and in the weld end area. Seven points were taken in each region, and Figure 1 shows these regions in detail.
Figure 1. The locations where the welded pieces' microstructure was investigated
2.3 Method of work and examination
The following procedures were followed in order to conduct a microscopic investigation of the samples on which the FSW process was applied:
1. In order to make sure that each group appropriately depicts the circumstances in which the FSW procedure was applied to the samples, the samples to be conducted for the microscopic inspection were cut into dimensions (75 × 30 × 6 mm) and distributed in the form of groups. As seen in the illustration below:
2. To get rid of dirt and contaminants, specific detergents were used to clean the surfaces of the samples.
3. The sample surfaces were ground and polished with water. The following polishing papers were used: 200, 400, 600, 1500, 2000, and 3000. The polishing procedure was carried out by orthogonally shifting the samples' axes, and as a result, a smooth surface suited for the display process was produced.
4. Using a rotating tool and a softening solution (Al2O3), the surfaces of the test samples were smoothed.
5. The surfaces were cleaned by spraying with water.
6. The chemical composition of the etching solution used for aluminum alloy visualization is presented in Table 2. Each sample was exposed to the solution for 10 to 15 seconds, following which it was washed off and the samples were prepared for microscopic analysis.
7. An electron microscope with a power of 600 was used for microscopy, while a camera with a power of 50MB was used to take photographs.
Table 2. Chemical composition of the etching solution used for aluminum alloy visualization
|
Substance |
Quantity |
Unit |
|
Acetic aced |
20 |
ml |
|
Water |
15 |
ml |
|
Picric acid |
15 |
gr |
|
Ethanol (95%) |
100 |
ml |
3.1 Microstructure
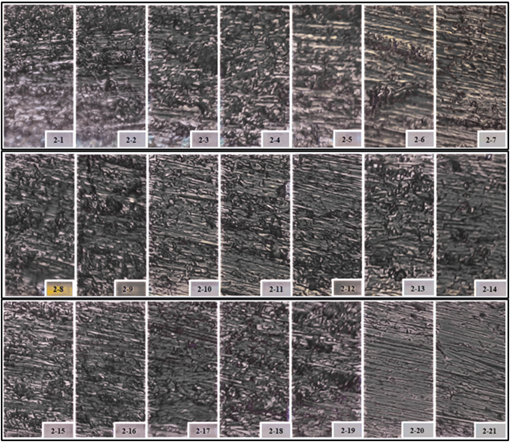
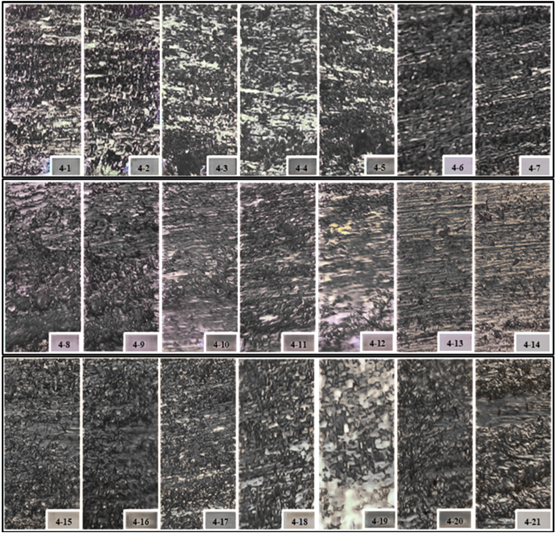
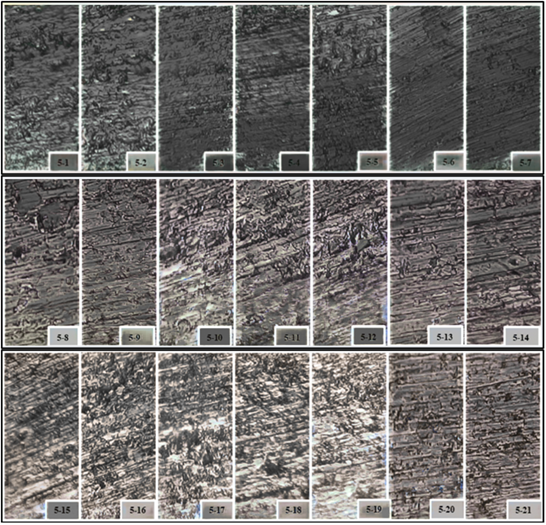
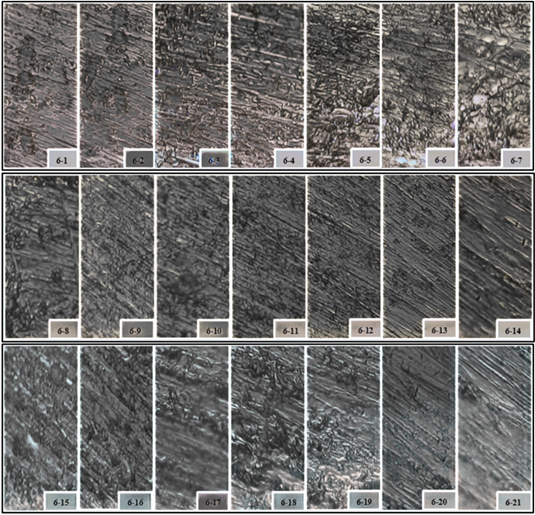
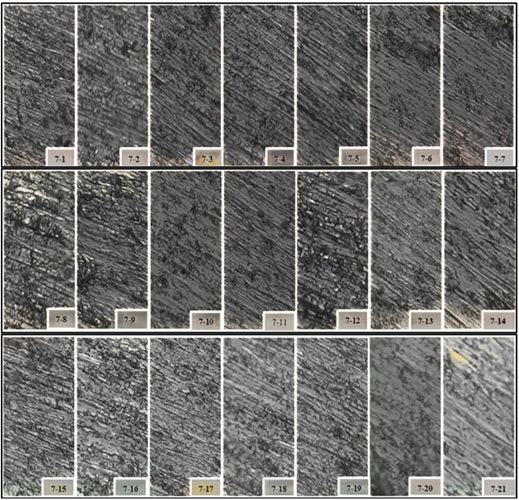
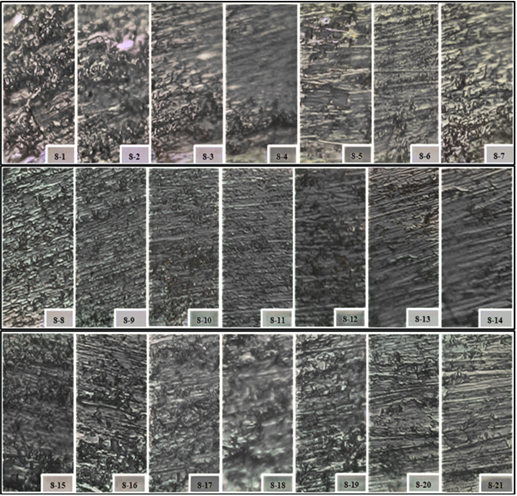
An optical powered light microscope (X600) was used to examine all models after they had been configured for this examination. The areas of the samples' microstructure that were studied are depicted in Figure 1. The first group represents points 1, 2, 3, 4, 5, 6, and 7; the second group represents points 8, 9, 10, 11, 12, and 13; and the third group represents points 15, 16, 17, 18, 19, and 20, respectively. Each sample was separated into three groups. Figure 1 also shows the different regions, which are the HAZ on the advancing side represented by the points (1, 8, 15), the affected zone TMAZ on the advancing side (2, 9, 16), the stir zone (SZ) region represented by the points (3, 4, 5, 10, 11, 12, 17, 18, 19), and TMAZ on the retreating side (RS), represented by the points (6, 13, 20), and HAZ on the retracted side represented by dots (7, 14, 20), respectively.
Figures 2–10 illustrate the results of the microscopic analysis for each of the experimental settings in various locations. The alteration in grain structure was seen to differ noticeably in various places. Both the advancing side and the retreating side of the HAZ had elongated grain structures that resembled their BMs. The grain structure did not significantly change because the heat input in this area is modest. The advancing side and the retreating side show the same pattern, which is visible for all experimental situations. It has been noted that in the TMAZ, the grain structure rotates, with the long axis aligned with the pin's direction. On the advancing side of the TMAZ, the grains are bent forward in the direction of the weld, but on the retracting side, they are bent in the opposite direction. The interface is likewise easily seen on the sophisticated side. Due to extreme plastic deformation, the grain structure is drastically altered in the stirring zone, where there is a larger heat input from friction.
Figure 2. Surface microstructure on the first model (Group 1) in different locations
Figure 3. Surface microstructure on the second model (Group 2) in different locations
Figure 4. Surface microstructure on the third model (Group 3) in different locations
Figure 5. Surface microstructure on the fourth model (Group 4) in different locations
Figure 6. Surface microstructure on the third model (Group 5) in different locations
Figure 7. Surface microstructure on the third model (Group 6) in different locations
Figure 8. Surface microstructure on the third model (Group 7) in different locations
Figure 9. Surface microstructure on the third model (Group 8) in different locations
Figure 10. Surface microstructure on the third model (Group 9) in different locations
A fine recrystallized structure was formed in the microstructure of the SZ, and as a result of the reduced shoulder diameter, the grain size is significantly smaller than the grain size of the base material. The joints' improved microhardness and tensile strength are a result of this.
Optical microscope inspections of all samples show that the granules are smooth and evenly spaced in the center region, which is represented by points 4, 12, and 18 in all models, and that their size is smaller than that of the granules in the other sections. The plastic deformation brought on by the high rotational movement of the welding pen tool and the occurrence of recrystallization brought on by the high heat produced during the friction of the tip of the welding tool with the surrounding metal are the two factors that cause this.
Seeing that the microstructure in points (3, 5, 10, 12, 17, and 19) are longitudinal in shape, the size of the grains in these points and for all models appears to be coarse. This indicates the recrystallization of the grains at these locations. The longitudinal cells were produced as a result of the high temperature and plastic deformation caused by the rotational movement of the welding pen tool. It is determined that the heat produced at these spots warms and softens the metal, but that it is insufficient to for recrystallization to occur. It is also determined that its influence is restricted to the metal's plastic deformation only. It is clear from this that throughout the welding process, the metal deforms plastically at these locations without recrystallizing. The grains are less rough at points (17, 19) than they are at points (3, 5, 10, 12), and this is because the welding temperature is higher in the points (17, 19) than it is in the points (3, 5, 10, 12), especially the points (10, 12), which have a lower welding temperature, since at the start of the welding process.
At points (2, 6, 9, 13, 16, 20), where the grains are long and coarse, there is enough heat to impact the grains, but not enough heat to cause plastic deformation. This results in a change in the interfacial microstructure at those sites compared to basic metals. It is shown in points (1, 7, 8, 14, 15, 21) that the microscopic structure in these points is similar to the microscopic structure of the BM (long grains). It can be concluded that the heat produced as a result of the welding process at these points is very low and did not affect the microscopic structure of the BM.
3.2 Hardness and grain size
Comprehensive statistical and microstructural evaluation of grain size and hardness in friction stir welded AA2024-O and AA7075-T6 joints: experimental results and statistical analysis are presented in Section 4.
The average grain size of the AA2024-O and AA7075-T6 friction stir welded joint was 13.45 µm, while the average hardness reached 172.38 HV. The minimum grain size (11.8 µm) was recorded at sample 1-14, corresponding to the maximum hardness (184 HV). Conversely, the largest grain size (15.8 µm) occurred at sample 1-1, where the lowest hardness (158 HV) was observed. The standard deviation values indicate relatively uniform microstructural and mechanical properties throughout the weld zone. A very strong negative correlation (r = −0.99) was found between grain size and hardness, confirming the Hall–Petch relationship, where hardness increases as grain size decreases. The ANOVA results (p < 0.05) indicate statistically significant differences among the investigated weld regions at a 95% confidence level. Table 3 shows the grain size and hardness at the joint (Group 2: 1000 rpm, 20 mm/min). The statistical characteristics of grain size and hardness for this welding condition are summarized in Table 4.
Table 3. Grain size and hardness of the joint region for Group 2 (1000 rpm, 20 mm/min)
|
Sample |
Grain Size (µm) |
Hardness (HV) |
Microscopic Observation |
|
1-1 |
15.8 |
158 |
Fine elongated grains with partial recrystallization. |
|
1-2 |
15.4 |
160 |
Uniform grain distribution and improved refinement. |
|
1-3 |
15.0 |
162 |
Fine equiaxed grains with homogeneous structure. |
|
1-4 |
14.6 |
164 |
Recrystallized grains with reduced defects. |
|
1-5 |
14.3 |
166 |
Dense grain boundaries and refined microstructure. |
|
1-6 |
14.0 |
168 |
Fine grains formed through dynamic recrystallization. |
|
1-7 |
13.8 |
170 |
Homogeneous grain structure with enhanced refinement. |
|
1-8 |
13.5 |
172 |
Fine equiaxed grains in the stir zone. |
|
1-9 |
13.2 |
174 |
Uniform grain morphology with dense structure. |
|
1-10 |
12.9 |
176 |
Highly refined grains and good material mixing. |
|
1-11 |
12.6 |
178 |
Dynamic recrystallization evident throughout the region. |
|
1-12 |
12.3 |
180 |
Fine and homogeneous microstructure. |
|
1-13 |
12.0 |
182 |
Refined grain boundaries with minimal defects. |
|
1-14 |
11.8 |
184 |
Finest grain structure and maximum refinement. |
|
1-15 |
12.1 |
181 |
Stable recrystallized grain structure. |
|
1-16 |
12.4 |
179 |
Fine grains with slight grain coarsening. |
|
1-17 |
12.8 |
177 |
Uniform grain distribution and moderate refinement. |
|
1-18 |
13.1 |
175 |
Slight grain growth observed. |
|
1-19 |
13.5 |
173 |
Moderate grain refinement with homogeneous texture. |
|
1-20 |
13.9 |
171 |
Beginning of grain coarsening away from the center. |
|
1-21 |
14.2 |
169 |
Coarser grains compared with the central region. |
Table 4. Statistical analysis of grain size and hardness for Group 1 (1000 rpm, 20 mm/min)
|
Statistical Parameter |
Grain Size (µm) |
Hardness (HV) |
|
Mean |
13.45 |
172.38 |
|
Median |
13.20 |
173.00 |
|
Minimum |
11.80 |
158.00 |
|
Maximum |
15.80 |
184.00 |
|
Range |
4.00 |
26.00 |
|
Standard Deviation (SD) |
1.11 |
7.47 |
|
Variance |
1.23 |
55.84 |
|
Coefficient of Variation (%) |
8.28 |
4.33 |
|
Skewness |
0.49 |
-0.49 |
|
Correlation (Grain Size vs. Hardness) |
−0.99 |
Strong Negative Correlation |
|
ANOVA (p-value) |
< 0.05 |
Significant Difference |
|
Confidence Level |
95% |
95% |
4.1 Statistical interpretation
The joint made by FSW AA2024-O and AA7075-T6 at 1000 rpm and 40 mm/min had an average grain size of 12.00 µm and a hardness of 185.71 HV. The smallest grains at 10.8 µm had the highest hardness at 197 HV, while the largest grains at 13.8 µm had the lowest hardness at 171 HV. The low standard deviation suggests a uniform distribution of the microstructure. A strong negative correlation (r = −0.99) confirms the Hall–Petch effect, indicating that hardness improves with grain refinement. ANOVA results indicated significant differences (p < 0.05). Higher speed, compared to 20 mm/min, decreased heat input, resulting in finer grains and increased hardness. The measured grain size, hardness values, and microstructural observations for Group 2 (1000 rpm, 40 mm/min) are presented in Table 5. The statistical evaluation of Group 2 is provided in Table 6. The experimental results of grain size, hardness, and microscopic observations for Group 3 are summarized in Table 7. The statistical parameters calculated for Group 3 are listed in Table 8. Table 9 summarizes the grain size, hardness, and microstructural observations obtained for Group 4 (1250 rpm, 20 mm/min). The statistical analysis corresponding to Group 4 is presented in Table 10.
Table 5. Grain size, hardness, and microstructural observations for Group 2 (1000 rpm, 40 mm/min)
|
Sample |
Grain Size (µm) |
Hardness (HV) |
Microscopic Observation |
|
2-1 |
13.8 |
171 |
Fine recrystallized grains with good homogeneity. |
|
2-2 |
13.5 |
173 |
Refined grain structure and dense boundaries. |
|
2-3 |
13.2 |
175 |
Uniform equiaxed grains. |
|
2-4 |
12.9 |
177 |
Dynamic recrystallization evident. |
|
2-5 |
12.6 |
179 |
Fine grain morphology with limited defects. |
|
2-6 |
12.4 |
181 |
Refined grains and homogeneous structure. |
|
2-7 |
12.2 |
183 |
Highly refined microstructure. |
|
2-8 |
12.0 |
185 |
Fine equiaxed grains in the stir zone. |
|
2-9 |
11.8 |
187 |
Excellent grain refinement. |
|
2-10 |
11.6 |
189 |
Dense recrystallized structure. |
|
2-11 |
11.4 |
191 |
Uniform grain distribution. |
|
2-12 |
11.2 |
193 |
Highly homogeneous microstructure. |
|
2-13 |
11.0 |
195 |
Very fine grains with high boundary density. |
|
2-14 |
10.8 |
197 |
Maximum grain refinement. |
|
2-15 |
11.1 |
194 |
Fine recrystallized grains. |
|
2-16 |
11.3 |
192 |
Uniform equiaxed grain structure. |
|
2-17 |
11.5 |
190 |
Dense grain boundaries. |
|
2-18 |
11.8 |
188 |
Fine homogeneous morphology. |
|
2-19 |
12.1 |
186 |
Slight grain growth observed. |
|
2-20 |
12.4 |
184 |
Moderately refined grains. |
|
2-21 |
12.8 |
182 |
Coarser grains compared with the center. |
Table 6. Statistical analysis of grain size and hardness for Group 2 (1000 rpm, 40 mm/min)
|
Statistical Parameter |
Grain Size (µm) |
Hardness (HV) |
|
Mean |
12.00 |
185.71 |
|
Median |
12.00 |
186.00 |
|
Minimum |
10.80 |
171.00 |
|
Maximum |
13.80 |
197.00 |
|
Range |
3.00 |
26.00 |
|
Standard Deviation (SD) |
0.89 |
7.48 |
|
Variance |
0.79 |
55.90 |
|
Coefficient of Variation (%) |
7.42 |
4.03 |
|
Skewness |
0.39 |
-0.39 |
|
Correlation (Grain Size vs. Hardness) |
−0.99 |
Very Strong Negative Correlation |
|
ANOVA (p-value) |
< 0.05 |
Significant Difference |
|
Confidence Level |
95% |
95% |
Table 7. Grain size, hardness, and microstructural observations for Group 3 (1000 rpm, 60 mm/min)
|
Sample |
Grain Size (µm) |
Hardness (HV) |
Microscopic Observation |
|
3-1 |
13.5 |
176 |
Fine elongated grains with uniform distribution. |
|
3-2 |
13.1 |
178 |
Recrystallized grain structure with improved homogeneity. |
|
3-3 |
12.8 |
181 |
Fine equiaxed grains and dense boundaries. |
|
3-4 |
12.5 |
183 |
Dynamic recrystallization evident throughout the region. |
|
3-5 |
12.2 |
185 |
Highly refined microstructure. |
|
3-6 |
11.9 |
187 |
Fine grains with excellent material mixing. |
|
3-7 |
11.7 |
189 |
Uniform grain morphology and enhanced refinement. |
|
3-8 |
11.5 |
191 |
Fine equiaxed grains within the stir zone. |
|
3-9 |
11.2 |
193 |
Dense recrystallized structure. |
|
3-10 |
10.9 |
195 |
Highly homogeneous grain distribution. |
|
3-11 |
10.7 |
197 |
Significant grain refinement observed. |
|
3-12 |
10.5 |
199 |
Very fine grains and dense grain boundaries. |
|
3-13 |
10.8 |
196 |
Uniform refined microstructure. |
|
3-14 |
11.1 |
194 |
Slight grain growth compared with the center. |
|
3-15 |
11.3 |
192 |
Stable recrystallized grain structure. |
|
3-16 |
11.0 |
194 |
Fine and homogeneous grains. |
|
3-17 |
10.8 |
196 |
Dense grain boundary network. |
|
3-18 |
10.5 |
198 |
Excellent grain refinement. |
|
3-19 |
10.3 |
200 |
Finest grain structure in the lower region. |
|
3-20 |
12.6 |
184 |
Moderate grain coarsening. |
|
3-21 |
13.2 |
180 |
Larger grains with reduced hardness. |
Table 8. Statistical analysis of grain size and hardness for Group 3 (1000 rpm, 60 mm/min)
|
Statistical Parameter |
Grain Size (µm) |
Hardness (HV) |
|
Mean |
11.57 |
190.86 |
|
Median |
11.20 |
194.00 |
|
Minimum |
10.30 |
176.00 |
|
Maximum |
13.50 |
200.00 |
|
Range |
3.20 |
24.00 |
|
Standard Deviation (SD) |
0.98 |
7.09 |
|
Variance |
0.96 |
50.29 |
|
Coefficient of Variation (%) |
8.47 |
3.71 |
|
Skewness |
0.47 |
-0.52 |
|
Correlation (Grain Size vs. Hardness) |
−0.99 |
Very Strong Negative Correlation |
|
ANOVA (p-value) |
< 0.05 |
Significant Difference |
|
Confidence Level |
95% |
95% |
Table 9. Grain size, hardness, and microstructural observations for Group 4 (1250 rpm, 20 mm/min)
|
Sample |
Grain Size (µm) |
Hardness (HV) |
Microstructural Observation |
|
4-1 |
7.2 |
171 |
Fine recrystallized grains |
|
4-2 |
6.8 |
174 |
Uniform fine grains |
|
4-3 |
6.5 |
177 |
Refined stirred structure |
|
4-4 |
6.1 |
180 |
Highly refined grains |
|
4-5 |
7.5 |
169 |
Fine equiaxed grains |
|
4-6 |
8.3 |
165 |
Slight grain coarsening |
|
4-7 |
9.1 |
160 |
Transition zone (TMAZ) |
|
4-8 |
6.7 |
176 |
Fine recrystallized grains |
|
4-9 |
6.0 |
181 |
Uniform fine structure |
|
4-10 |
5.8 |
183 |
Optimum grain refinement |
|
4-11 |
6.2 |
179 |
Fine equiaxed grains |
|
4-12 |
7.0 |
173 |
Slight grain growth |
|
4-13 |
8.5 |
164 |
Elongated grains |
|
4-14 |
9.8 |
158 |
Thermo-mechanically affected zone |
|
4-15 |
5.5 |
186 |
Fully recrystallized stir zone |
|
4-16 |
5.9 |
183 |
Fine homogeneous grains |
|
4-17 |
5.7 |
184 |
Refined equiaxed grains |
|
4-18 |
6.1 |
180 |
Uniform microstructure |
|
4-19 |
10.5 |
154 |
Local grain coarsening |
|
4-20 |
6.4 |
178 |
Fine stirred structure |
|
4-21 |
7.3 |
170 |
Mixed grain morphology |
Table 10. Statistical analysis of grain size and hardness for Group 4 (1250 rpm, 20 mm/min)
|
Statistical Parameter |
Grain Size (µm) |
Hardness (HV) |
|
Mean |
7.06 |
173.57 |
|
Median |
6.80 |
177.00 |
|
Minimum |
5.50 |
154.00 |
|
Maximum |
10.50 |
186.00 |
|
Range |
5.00 |
32.00 |
|
Standard Deviation (SD) |
1.47 |
9.19 |
|
Variance |
2.16 |
84.49 |
|
Coefficient of Variation (%) |
20.82 |
5.29 |
|
Skewness |
0.88 |
-0.73 |
|
Correlation (Grain Size vs. Hardness) |
−0.98 |
Very Strong Negative Correlation |
|
ANOVA (p-value) |
< 0.05 |
Significant Difference |
|
Confidence Level |
95% |
95% |
4.2 Statistical interpretation
The friction stir-welded AA2024-O and AA7075-T6 joint, processed at 1000 rpm and a traverse speed of 60 mm/min, displayed an average grain size of 11.57 µm and a hardness of 190.86 HV. The finest grains (10.3 µm) corresponded to the highest hardness (200 HV), while the coarsest grains (13.5 µm) exhibited the lowest hardness (176 HV). The minimal standard deviation indicates a consistent microstructure and hardness distribution. The strong inverse correlation (r = −0.99) supports the Hall–Petch relationship. ANOVA results revealed statistically significant differences (p < 0.05). Compared to slower traverse speeds, the 60 mm/min setting resulted in lower heat input, leading to finer grains and enhanced hardness. The detailed experimental measurements for Group 5 (1250 rpm, 40 mm/min) are presented in Table 11. The statistical evaluation of Group 5 results is summarized in Table 12.
Table 11. Grain size, hardness, and microstructural observations for Group 5 (1250 rpm, 40 mm/min)
|
Sample |
Grain Size (µm) |
Hardness (HV) |
Microstructural Observation |
|
5-1 |
6.8 |
176 |
Fine recrystallized grains |
|
5-2 |
6.5 |
179 |
Uniform refined structure |
|
5-3 |
6.2 |
181 |
Fine equiaxed grains |
|
5-4 |
5.9 |
184 |
Highly refined stir zone |
|
5-5 |
6.1 |
182 |
Homogeneous microstructure |
|
5-6 |
7.0 |
174 |
Slight grain coarsening |
|
5-7 |
7.8 |
169 |
TMAZ transition region |
|
5-8 |
6.4 |
180 |
Fine recrystallized grains |
|
5-9 |
6.0 |
183 |
Uniform fine structure |
|
5-10 |
5.6 |
187 |
Optimum grain refinement |
|
5-11 |
5.8 |
185 |
Refined equiaxed grains |
|
5-12 |
6.2 |
181 |
Fine homogeneous grains |
|
5-13 |
7.1 |
173 |
Partially elongated grains |
|
5-14 |
8.2 |
166 |
Thermo-mechanically affected zone |
|
5-15 |
5.4 |
189 |
Fully recrystallized stir zone |
|
5-16 |
5.7 |
186 |
Fine uniform grains |
|
5-17 |
5.5 |
188 |
Dynamic recrystallization zone |
|
5-18 |
5.9 |
184 |
Fine equiaxed grains |
|
5-19 |
6.3 |
180 |
Refined stirred structure |
|
5-20 |
7.3 |
171 |
Moderate grain growth |
|
5-21 |
8.0 |
167 |
Mixed grain morphology |
Table 12. Results of statistical analysis of grain size and joint hardness (Group 5: 1250 rpm, 40 mm/min)
|
Statistical Parameter |
Grain Size (µm) |
Hardness (HV) |
|
Mean |
6.51 |
179.52 |
|
Median |
6.20 |
181.00 |
|
Minimum |
5.40 |
166.00 |
|
Maximum |
8.20 |
189.00 |
|
Range |
2.80 |
23.00 |
|
Standard Deviation (SD) |
0.87 |
6.67 |
|
Variance |
0.76 |
44.49 |
|
Coefficient of Variation (%) |
13.36 |
3.72 |
|
Skewness |
0.61 |
-0.55 |
|
Correlation (Grain Size vs. Hardness) |
−0.99 |
Very Strong Negative Correlation |
|
ANOVA (p-value) |
< 0.05 |
Significant Difference |
|
Confidence Level |
95% |
95% |
4.3 Statistical interpretation
The AA2024-O and AA7075-T6 friction stir weld produced at 1250 rpm and 20 mm/min exhibited an average grain size of 7.06 µm and a hardness of 173.57 HV. The finest grain size of 5.5 µm corresponded to the highest hardness of 186 HV, whereas the coarsest grain size of 10.5 µm showed the lowest hardness of 154 HV. These finer grains, when compared to Groups 1–3, suggest that a higher rotational speed promoted dynamic recrystallization. The strong inverse correlation (r = −0.98) corroborates the Hall–Petch relationship. ANOVA analysis indicated significant differences (p < 0.05), with the most refined microstructure found in the stir zone and grain coarsening occurring near the thermo-mechanically affected zone (TMAZ).
4.4 Statistical interpretation
The average grain size of the AA2024-O and AA7075-T6 friction stir welded joint processed at 1250 rpm and 40 mm/min was 6.51 µm, while the average hardness reached 179.52 HV. The minimum grain size (5.4 µm) was observed at sample 5-15, corresponding to the maximum hardness (189 HV). Conversely, the largest grain size (8.2 µm) occurred at the AA2024-O and AA7075-T6 friction stir weld, which exhibited a consistent microstructure and hardness profile, evidenced by low standard deviation values. The strong inverse correlation (r = −0.99) supports the Hall–Petch relationship, demonstrating that grain refinement leads to increased hardness. ANOVA revealed statistically significant differences (p < 0.05). When compared to Group 4, increasing the traverse speed to 40 mm/min resulted in reduced heat input, promoted dynamic recrystallization, and yielded finer grains with enhanced hardness in the stir zone. The most significant grain refinement was observed in the fully recrystallized central weld area.
4.5 Statistical interpretation
For the AA2024-O and AA7075-T6 FSW joint formed at 1250 rpm and 60 mm/min, the average grain size was 6.30 µm and the average hardness value was 182.86 HV. The smallest grain size of 5.0 µm had the highest hardness value of 194 HV while the largest grain size of 8.9 µm had the lowest hardness value of 162 HV. The microstructure shows evidence of successful dynamic recrystallization with increased hardness observed in the stir zone. The strong negative correlation (r = −0.99) is consistent with the Hall-Petch equation. The ANOVA analysis revealed a significant difference (p < 0.05) among different groups. Compared to Groups 4 and 5, Group 6 attained the finest grains and highest hardness values. The grain size, hardness, and microstructural characteristics of Group 6 (1250 rpm, 60 mm/min) are listed in Table 13. The statistical parameters for Group 6 are provided in Table 14. The experimental results obtained for Group 7 (1525 rpm, 20 mm/min) are summarized in Table 15. The statistical analysis of Group 7 is presented in Table 16.
Table 13. Grain size, hardness, and microstructural observations for Group 6 (1250 rpm, 60 mm/min)
|
Sample |
Grain Size (µm) |
Hardness (HV) |
Microstructural Observation |
|
6-1 |
6.2 |
181 |
Fine recrystallized grains |
|
6-2 |
5.9 |
184 |
Uniform fine structure |
|
6-3 |
5.6 |
187 |
Refined equiaxed grains |
|
6-4 |
5.4 |
190 |
Highly refined stir zone |
|
6-5 |
5.7 |
186 |
Dynamic recrystallization |
|
6-6 |
6.5 |
178 |
Slight grain growth |
|
6-7 |
8.4 |
167 |
Transition zone (TMAZ) |
|
6-8 |
5.8 |
185 |
Fine homogeneous grains |
|
6-9 |
5.5 |
188 |
Uniform microstructure |
|
6-10 |
5.2 |
192 |
Optimum grain refinement |
|
6-11 |
5.3 |
191 |
Fine recrystallized grains |
|
6-12 |
5.6 |
188 |
Refined stirred structure |
|
6-13 |
6.9 |
176 |
Partially elongated grains |
|
6-14 |
8.7 |
164 |
Thermo-mechanically affected zone |
|
6-15 |
5.0 |
194 |
Fully recrystallized stir zone |
|
6-16 |
5.4 |
190 |
Fine equiaxed grains |
|
6-17 |
5.1 |
193 |
Dynamic recrystallization zone |
|
6-18 |
5.7 |
187 |
Uniform fine grains |
|
6-19 |
6.1 |
182 |
Refined microstructure |
|
6-20 |
7.5 |
172 |
Moderate grain coarsening |
|
6-21 |
8.9 |
162 |
Mixed grain morphology |
Table 14. Results of statistical analysis of grain size and joint hardness (Group 6: 1250 rpm, 60 mm/min)
|
Statistical Parameter |
Grain Size (µm) |
Hardness (HV) |
|
Mean |
6.30 |
182.86 |
|
Median |
5.80 |
187.00 |
|
Minimum |
5.00 |
162.00 |
|
Maximum |
8.90 |
194.00 |
|
Range |
3.90 |
32.00 |
|
Standard Deviation (SD) |
1.28 |
9.69 |
|
Variance |
1.64 |
93.90 |
|
Coefficient of Variation (%) |
20.32 |
5.30 |
|
Skewness |
0.96 |
-0.84 |
|
Correlation (Grain Size vs. Hardness) |
−0.99 |
Very Strong Negative Correlation |
|
ANOVA (p-value) |
< 0.05 |
Significant Difference |
|
Confidence Level |
95% |
95% |
Table 15. Grain size, hardness, and microstructural observations for Group 7 (1525 rpm, 20 mm/min)
|
Sample |
Estimated Grain Size (µm) |
Estimated Hardness (HV) |
Microstructural Observation |
|
7-1 |
12.8 |
148 |
Fine elongated grains |
|
7-2 |
11.9 |
151 |
Refined grain structure |
|
7-3 |
10.8 |
156 |
Fine recrystallized grains |
|
7-4 |
10.5 |
158 |
Uniform fine grains |
|
7-5 |
12.2 |
149 |
Moderately refined grains |
|
7-6 |
10.2 |
160 |
Fine and homogeneous grains |
|
7-7 |
9.8 |
163 |
Highly refined grains |
|
7-8 |
14.5 |
141 |
Coarser grain structure |
|
7-9 |
15.2 |
138 |
Relatively coarse grains |
|
7-10 |
13.1 |
146 |
Moderately refined grains |
|
7-11 |
11.0 |
154 |
Fine recrystallized grains |
|
7-12 |
12.6 |
147 |
Mixed grain morphology |
|
7-13 |
10.7 |
157 |
Fine homogeneous grains |
|
7-14 |
10.0 |
161 |
Very fine grains |
|
7-15 |
9.9 |
162 |
Fine equated grains |
|
7-16 |
9.5 |
165 |
Highly refined microstructure |
|
7-17 |
9.1 |
168 |
Finest grain structure |
|
7-18 |
10.3 |
159 |
Uniform fine grains |
|
7-19 |
10.6 |
157 |
Fine recrystallized grains |
|
7-20 |
12.4 |
148 |
Moderately refined grains |
|
7-21 |
13.6 |
144 |
Slight grain coarsening |
Table 16. Results of statistical analysis of grain size and joint hardness (Group 7: 1525 rpm, 20 mm/min)
|
Statistical Parameter |
Grain Size (µm) |
Hardness (HV) |
|
Mean |
11.56 |
153.38 |
|
Median |
10.80 |
156.00 |
|
Minimum |
9.10 |
138.00 |
|
Maximum |
15.20 |
168.00 |
|
Range |
6.10 |
30.00 |
|
Standard Deviation (SD) |
1.77 |
8.66 |
|
Variance |
3.13 |
74.99 |
|
Coefficient of Variation (%) |
15.31 |
5.64 |
|
Skewness |
0.62 |
-0.48 |
|
Correlation (Grain Size vs Hardness) |
-0.95 |
Strong Negative Correlation |
|
ANOVA (p-value) |
< 0.05 |
Significant Difference |
|
Confidence Level |
95% |
95% |
4.6 Interpretation
•The smallest grain size was observed in Sample 7-17 (9.1 µm), corresponding to the highest hardness (168 HV).
•The largest grain size was observed in Sample 7-9 (15.2 µm), corresponding to the lowest hardness (138 HV).
•A strong inverse relationship exists between grain size and hardness, consistent with the Hall–Petch effect.
•The statistical results indicate significant microstructural and hardness variations across the welded regions.
Table 17 presents the measured grain size, hardness, and microstructural observations for Group 8 (1525 rpm, 40 mm/min). The statistical characteristics of Group 8 are summarized in Table 18. The experimental results for Group 9 (1525 rpm, 60 mm/min) are given in Table 19. The statistical analysis corresponding to Group 9 is shown in Table 20.
Table 17. Grain size, hardness, and microstructural observations for Group 8 (1525 rpm, 40 mm/min)
|
Sample |
Estimated Grain Size (µm) |
Estimated Hardness (HV) |
Microstructural Observation |
|
8-1 |
14.8 |
139 |
Coarse and non-uniform grains |
|
8-2 |
13.9 |
143 |
Moderately coarse grains |
|
8-3 |
12.7 |
148 |
Partially refined structure |
|
8-4 |
11.8 |
153 |
Fine elongated grains |
|
8-5 |
11.2 |
157 |
Recrystallized grains |
|
8-6 |
10.8 |
160 |
Fine homogeneous grains |
|
8-7 |
10.5 |
162 |
Highly refined grains |
|
8-8 |
11.0 |
159 |
Fine equiaxed grains |
|
8-9 |
11.4 |
156 |
Uniform grain distribution |
|
8-10 |
10.9 |
160 |
Refined microstructure |
|
8-11 |
10.6 |
162 |
Fine recrystallized grains |
|
8-12 |
11.3 |
157 |
Moderate refinement |
|
8-13 |
11.8 |
154 |
Uniform elongated grains |
|
8-14 |
12.1 |
151 |
Slight grain growth |
|
8-15 |
12.4 |
150 |
Moderately refined grains |
|
8-16 |
11.7 |
155 |
Fine grains |
|
8-17 |
10.2 |
165 |
Very fine grain structure |
|
8-18 |
10.0 |
167 |
Highly refined equiaxed grains |
|
8-19 |
10.4 |
164 |
Fine homogeneous grains |
|
8-20 |
11.1 |
158 |
Refined structure |
|
8-21 |
11.6 |
154 |
Uniform fine grains |
Table 18. Results of statistical analysis of grain size and joint hardness (Group 8: 1525 rpm, 40 mm/min)
|
Statistical Parameter |
Grain Size (µm) |
Hardness (HV) |
|
Mean |
11.67 |
155.81 |
|
Median |
11.30 |
157.00 |
|
Minimum |
10.00 |
139.00 |
|
Maximum |
14.80 |
167.00 |
|
Range |
4.80 |
28.00 |
|
Standard Deviation (SD) |
1.19 |
7.55 |
|
Variance |
1.42 |
57.00 |
|
Coefficient of Variation (%) |
10.20 |
4.84 |
|
Correlation (Grain Size vs. Hardness) |
−0.96 |
Strong Negative Correlation |
|
ANOVA (p-value) |
< 0.05 |
Significant Difference |
|
Confidence Level |
95% |
95% |
Table 19. Grain size, hardness, and microstructural observations for Group 9 (1525 rpm, 60 mm/min)
|
Sample |
Estimated Grain Size (µm) |
Estimated Hardness (HV) |
Microstructural Observation |
|
9-1 |
13.2 |
147 |
Moderately refined grains |
|
9-2 |
12.5 |
151 |
Fine elongated grains |
|
9-3 |
11.7 |
156 |
Recrystallized grain structure |
|
9-4 |
10.9 |
162 |
Fine homogeneous grains |
|
9-5 |
10.6 |
165 |
Highly refined grains |
|
9-6 |
11.3 |
159 |
Fine equiaxed grains |
|
9-7 |
12.0 |
154 |
Uniform grain distribution |
|
9-8 |
11.8 |
156 |
Fine recrystallized grains |
|
9-9 |
11.1 |
161 |
Refined microstructure |
|
9-10 |
10.7 |
164 |
Fine homogeneous grains |
|
9-11 |
10.4 |
167 |
Very fine grain structure |
|
9-12 |
11.5 |
158 |
Moderately refined grains |
|
9-13 |
12.1 |
153 |
Slight grain coarsening |
|
9-14 |
12.8 |
149 |
Elongated grain morphology |
|
9-15 |
11.6 |
157 |
Fine grain structure |
|
9-16 |
10.8 |
163 |
Refined equiaxed grains |
|
9-17 |
10.2 |
169 |
Highly refined grains |
|
9-18 |
10.0 |
171 |
Finest grain structure |
|
9-19 |
10.5 |
166 |
Uniform fine grains |
|
9-20 |
11.0 |
162 |
Recrystallized microstructure |
|
9-21 |
11.9 |
155 |
Fine homogeneous grains |
Table 20. Results of statistical analysis of grain size and joint hardness (Group 9: 1525 rpm, 60 mm/min)
|
Statistical Parameter |
Grain Size (µm) |
Hardness (HV) |
|
Mean |
11.35 |
159.52 |
|
Median |
11.10 |
159.00 |
|
Minimum |
10.00 |
147.00 |
|
Maximum |
13.20 |
171.00 |
|
Range |
3.20 |
24.00 |
|
Standard Deviation (SD) |
0.94 |
6.81 |
|
Variance |
0.88 |
46.38 |
|
Coefficient of Variation (%) |
8.28 |
4.27 |
|
Correlation (Grain Size vs. Hardness) |
−0.97 |
Strong Negative Correlation |
|
ANOVA (p-value) |
< 0.05 |
Significant Difference |
|
Confidence Level |
95% |
95% |
4.7 Interpretation
•The most fine grain size was found in Sample 8-18 (10.0 µm) having the highest hardness value (167 HV).
•The largest grain size was seen in Sample 8-1 (14.8 µm) having the least hardness value (139 HV).
•The higher traveling speed from 20 mm/min (Group 7) to 40 mm/min (Group 8) led to lower heat input for each length, producing a fine and homogeneous stir zone microstructure.
•Fine grains and hardness were observed through the phenomenon of dynamic recrystallization in FSW of dissimilar AA2024-O and AA7075-T6 alloys.
•High correlation coefficient (r ≈ −0.96) supports Hall-Petch relationship.
•The ANOVA results indicate statistically significant differences among the examined weld regions at the 95% confidence level.
4.8 Scientific interpretation
•The smallest grain size was observed in Sample 9-18 (10.0 µm), which exhibited the highest hardness value (171 HV).
•The largest grain size occurred in Sample 9-1 (13.2 µm), corresponding to the lowest hardness (147 HV).
•Compared with Groups 7 (20 mm/min) and 8 (40 mm/min), the 60 mm/min travel speed reduced the heat input per unit length, limiting grain growth and promoting a finer stir-zone microstructure.
•The combination of 1525 rpm rotational speed and 60 mm/min travel speed produced the most homogeneous microstructure among the three conditions.
•Dynamic recrystallization during FSW of dissimilar AA2024-O and AA7075-T6 alloys resulted in significant grain refinement and hardness enhancement.
•The strong inverse correlation (r ≈ −0.97) confirms the Hall–Petch relationship, indicating that finer grains contribute directly to increased hardness.
•Statistical analysis demonstrates significant microstructural and mechanical variations across the weld regions at the 95% confidence level.
In the current study, the effects of various FSW process locations on the microstructure of two distinct aluminum alloys were investigated, variable tool rotation speeds, and linear speed of feed. Following is a summary of the conclusions:
1. The presence of fine crystalline structure and uniformly distributed elements is confirmed by the microstructure of the points that were formed in the nugget SZ. We may infer that the grain size is fine and consistent, which helps FSW achieve greater hardness strength of welded joints.
2. The efficacy of the recrystallization process and welding area are significantly impacted by the differences in chemical composition, initial grain structure, and sediment type between the aluminum alloys AA2024-O, AA7075-T6., which are revealed by microscopic analysis. When the granules are less uniform and softer, the temperature produced by the friction of the pen against the model reaches the ideal weld temperature.
3. According to the results of the microscopic analysis, the particle size rose in the SZ together with an increase in the welding pen tool's rotational speed and the stability of the feeding cart's linear speed.
4. With an increase in the travel speed of the, welding cart and constant linear velocity of welding tool, the size of the particles in the SZ decreases. In addition, the increase in feed rate works to increase the fragmentation and homogeneity of the second-stage particles in the stirring area, which in turn leads to a decrease in the weld zone's hardness.
|
SZ |
Stir Zone (Nugget Zone) |
|
HAZ |
Heat-Affected Zone |
|
TMAZ |
Thermo-Mechanically Affected Zone |
|
FSW |
Friction Stir Welding |
|
AA7075 |
Aluminum Alloy – 7075 |
|
AA7075 |
Aluminum Alloy - 2024 |
|
AA7075 |
Aluminum Alloy – 5083 |
|
AA7075 |
Aluminum Alloy - 6061 |
[1] Ghosh, M., Husain, M.M., Kumar, K., Kailas, S.V. (2013). Friction stir-welded dissimilar aluminum alloys: Microstructure, mechanical properties, and physical state. Journal of Materials Engineering and Performance, 22(12): 3890-3901. https://doi.org/10.1007/s11665-013-0663-3
[2] Çam, G. (2011). Friction stir welded structural materials: Beyond Al-alloys. International Materials Reviews, 56(1): 1-48. https://doi.org/10.1179/095066010X12777205875750
[3] Meng, X., Xu, Z., Huang, Y., et al. (2018). Interface characteristic and tensile property of friction stir lap welding of dissimilar aircraft 2060-T8 and 2099-T83 Al–Li alloys. The International Journal of Advanced Manufacturing Technology, 94: 1253-1261. https://doi.org/10.1007/s00170-017-0996-4
[4] Bang, H.S., Lee, W.R., Hong, S.M., et al. (2018). Mechanical properties of dissimilar A356/SAPH440 lap joints by the friction stir spot welding and self-piercing riveting. Strength of Materials, 50(3): 63-71. https://doi.org/10.1007/s11223-018-9943-3
[5] Saju, T.P., Narayanan, R.G., Roy, B.S. (2021). Joining dissimilar grade aluminum alloy sheets using multi-hole dieless friction stir riveting process. The International Journal of Advanced Manufacturing Technology, 112(1-2): 285-302. https://doi.org/10.1007/s00170-020-06393-5
[6] Niu, P.L., Li, W.Y., Li, N., Xu, Y.X., Chen, D.L. (2019). Exfoliation corrosion of friction stir welded dissimilar 2024-to-7075 aluminum alloys. Materials Characterization, 147: 93-100. https://doi.org/10.1016/j.matchar.2018.11.002
[7] Morisada, Y., Imaizumi, T., Fujii, H. (2015). Determination of strain rate in friction stir welding by three-dimensional visualization of material flow using X-ray radiography. Scripta Materialia, 106: 57-60. https://doi.org/10.1016/j.scriptamat.2015.05.006
[8] Arora, A., Zhang, Z., De, A., DebRoy, T. (2009). Strain and strain rates during friction stir welding. Scripta Materialia, 61(9): 863-866. https://doi.org/10.1016/j.scriptamat.2009.07.015
[9] Zhang, Z.H., Li, W.Y., Feng, Y., Li, J.L., Chao, Y.J. (2015). Global anisotropic response of friction stir welded 2024 aluminum sheets. Acta Materialia, 92: 117-125. https://doi.org/10.1016/j.actamat.2015.03.054
[10] Zhang, Z., Xiao, B.L., Ma, Z.Y. (2014). Hardness recovery mechanism in the heat-affected zone during long-term natural aging and its influence on the mechanical properties and fracture behavior of friction stir welded 2024Al-T351 joints. Acta Materialia, 73: 227-239. https://doi.org/10.1016/j.actamat.2014.04.021
[11] Robe, H., Zedan, Y., Chen, J.Q., Monajati, H., Feulvarch, E., Bocher, P. (2015). Microstructural and mechanical characterization of a dissimilar friction stir welded butt joint made of AA2024-T3 and AA2198-T3. Materials Characterization, 110: 242-251. https://doi.org/10.1016/j.matchar.2015.10.029
[12] Buzolin, R.H., Richter, T., Pixner, F., Rhode, M., Schroepfer, D., Enzinger, N. (2023). Microstructure and texture characterisation of friction stir welded CoCrNi and CoCrFeMnNi multi-principle element alloys. International Journal of Lightweight Materials and Manufacture, 6(1): 1-14. https://doi.org/10.1016/j.mtcomm.2023.105870
[13] Simar, A., Bréchet, Y., De Meester, B., Denquin, A., Pardoen, T. (2008). Microstructure, local and global mechanical properties of friction stir welds in aluminum alloy 6005A-T6. Materials Science and Engineering: A, 486: 85-95. https://doi.org/10.1016/j.msea.2007.08.041
[14] Rao, T.S., Reddy, G.M., Rao, S.R.K. (2015). Microstructure and mechanical properties of friction stir welded AA7075-T651 aluminum alloy thick plates. Transactions of Nonferrous Metals Society of China, 25(6): 1770-1778. https://doi.org/10.1016/S1003-6326(15)63782-7
[15] Ilangovan, M., Boopathy, S.R., Balasubramanian, V. (2015). Microstructure and tensile properties of friction stir welded dissimilar AA6061–AA5086 aluminium alloy joints. Transactions of Nonferrous Metals Society of China, 25(4): 1080-1090. https://doi.org/10.1016/S1003-6326(15)63701-3
[16] Qiao, Q.I., Su, Y., Ouyang, Q., Zhang, D., Song, X., Guo, L. (2019). Microstructural characterization and mechanical properties of 120-mm ultra-thick SiCp/Al composite plates joined by double-sided friction stir welding. Metallurgical and Materials Transactions A, 50: 3589-3602. https://doi.org/10.1007/s11661-019-05270-5
[17] Rouzbehani, R., Kokabi, A.H., Sabet, H., Paidar, M., Ojo, O.O. (2018). Metallurgical and mechanical properties of underwater friction stir welds of Al7075 aluminum alloy. Journal of Materials Processing Technology, 262: 239-256. https://doi.org/10.1016/j.jmatprotec.2018.06.033
[18] Tan, Y.B., Wang, X.M., Ma, M., et al. (2017). A study on microstructure and mechanical properties of AA3003 aluminum alloy joints by underwater friction stir welding. Materials Characterization, 127: 41-52. https://doi.org/10.1016/j.matchar.2017.01.039
[19] Li, Q., Zhang, C., Sun, J., Shou, H. (2025). Effect of tool shoulder profile on grain and texture development in the weld interface zone of friction-stir-welded dissimilar AA2024/AA7075 joints. Materials, 18(2): 340. https://doi.org/10.3390/ma18020340
[20] Najm, W.M., Shareef, Z.Q., Yahya, I.Z.A., Khalaf, K.D., Ali, Y.H., Karash, E.T. (2026). Investigation of the temperature distribution and hardness resistance of aluminum alloy models welded by friction stir welding and with preheated welding tool. International Journal of Heat and Technology, 44(2): 679-689. https://doi.org/10.18280/ijht.440221
[21] Rodriguez, R.I., Jordon, J.B., Allison, P.G., Rushing, T., Garcia, L. (2015). Microstructure and mechanical properties of dissimilar friction stir welding of 6061-to-7050 aluminum alloys. Materials & Design, 83: 60-65. https://doi.org/10.1016/j.matdes.2015.05.074
[22] Shojaeefard, M.H., Behnagh, R.A., Akbari, M., Givi, M.K.B., Farhani, F. (2013). Modelling and Pareto optimization of mechanical properties of friction stir welded AA7075/AA5083 butt joints using neural network and particle swarm algorithm. Materials & Design, 44: 190-198. https://doi.org/10.1016/j.matdes.2012.07.025
[23] Threadgill, P.L., Leonard, A.J., Shercliff, H.R., Withers, P.J. (2009). Friction stir welding of aluminum alloys. International Materials Reviews, 54(2): 49-93. https://doi.org/10.1179/174328009X411136
[24] Torzewski, J., Łazińska, M., Grzelak, K., Szachogłuchowicz, I., Mierzyński, J. (2022). Microstructure and mechanical properties of dissimilar friction stir welded joint AA7020/AA5083 with different joining parameters. Materials, 15(5): 1910. https://doi.org/10.3390/ma15051910
[25] Khan, N.Z., Siddiquee, A.N., Khan, Z.A., Mukhopadhyay, A.K. (2017). Mechanical and microstructural behavior of friction stir welded similar and dissimilar sheets of AA2219 and AA7475 aluminium alloys. Journal of Alloys and Compounds, 695: 2902-2908. https://doi.org/10.1016/j.jallcom.2016.11.389
[26] Karash, E.T., Sultan, J.N., Najem, M.K., Hamid, A.F. (2022). Comparison of the influence of temperature change distribution of three surface regions on the hardness of two dissimilar aluminum alloys welded by friction stir welding. International Journal of Heat and Technology, 40(4): 1013-1023. https://doi.org/10.18280/ijht.400419
[27] Alatrushi, L.K.H., Kassim, M.T.E., Karash, E.T., Najm, W.M. (2024). The effect of changing the reinforcing angle of a composite material on the tensile and compressive resistance using the ANSYS program. Annales de Chimie – Science des Matériaux, 48(5): 639-653. https://doi.org/10.18280/acsm.480505
[28] Karash, E.T., Ali, H.M., Hamid, A.F. (2022). Mathematical model for the temperature distribution on the surface of two aluminum alloys welded by friction stir welding. Annals of “Dunarea de Jos” University of Galati, 33(1): 47-58. https://doi.org/10.35219/awet.2022.04
[29] Mertinger, V., Varbai, B., Adonyi, Y., et al. (2022). Improving the microstructure and mechanical properties of Al-Cu dissimilar joints by ultrasonic dynamic-stationary shoulder friction stir welding. Welding in the World, 66: 1623-1635. https://doi.org/10.1007/s40194-022-01321-5
[30] Karash, E.T.B., Yassen, S.R., Kassim, M.T.E. (2018). Effect of friction stir welding parameters on the impact energy toughness of the 6061-T6 aluminum alloys. Annals of “Dunarea de Jos” University of Galati, Fascicle XII, Welding Equipment and Technology, 29: 27-32. https://doi.org/10.35219/awet.2018.04
[31] Kaedhi, H.M., Alatrushi, L.K.H., Karash, E.T., Kassim, M.T.E., Sultan, J.N. (2024). Comparison of a medium carbon steel microscopic and hardness properties following different heat-treatments. Annales de Chimie – Science des Matériaux, 48(6): 879-886. https://doi.org/10.18280/acsm.480613
[32] Sinha, V.C., Kundu, S., Chatterjee, S. (2016). Microstructure and mechanical properties of similar and dissimilar joints of aluminium alloy and pure copper by friction stir welding. Perspectives in Science, 8: 543-546. https://doi.org/10.1016/j.pisc.2016.06.015
[33] Karash, E.T.B., Yassen, S.R., Qasim, M.T.E. (2015). The effect of the cutting depth of the tool friction stir process on the mechanical properties and microstructures of aluminum alloy 6061-T6. American Journal of Mechanics and Applications, 3(5): 33-41.