Ferly Isnomo Abdi* | Arya Mahendra Sakti | Moh. Ahnaf Aqil | Nur Vidia Laksmi B. | Aditya Chandra Hermawan | Lailatus Sa'diyah Yuniar Arifianti | Auliana Diah Wilujeng
© 2026 The authors. This article is published by IIETA and is licensed under the CC BY 4.0 license (http://creativecommons.org/licenses/by/4.0/).
OPEN ACCESS
Campus electric-bicycle charging requires selectable charging rates, independent protection, and observable operation. This study developed and laboratory-tested a 48 V prototype comprising a 36 V switched-mode power supply, a PWM-controlled boost stage with a 56 V output ceiling, current-limited modes of 3 A, 5 A, and 7 A, an XH-M603 relay that terminated charging at 51.5 V, and an ESP32-PZEM-017 monitoring chain with 5 s cloud logging. One 48 V, 20 Ah sealed lead-acid battery was tested from a standardized terminal-voltage condition of 48.00 ± 0.20 V in three trials per mode (n = 9). Mean (SD) charging durations were 197 (2), 131 (2), and 108 (2) min. Because residual normality was not supported, the one-way ANOVA result, F(2,6) = 1600.75, p < 0.001, η² = 0.998, was treated as exploratory; an exact permutation test also indicated an overall mode effect (p = 0.0036). All trials disconnected within ±0.2 V of the threshold. During approximately 48 h of stable indoor Wi-Fi testing, no missing records were observed, and sensor deviations remained within stated specifications. The contribution is an integrated, off-the-shelf proof of concept that jointly characterizes selectable current, hardware cut-off repeatability, and real-time logging. The results establish short-term electrical functionality for the tested battery, but do not establish conversion efficiency, full-charge performance, thermal or cycle-life safety, or field-network reliability.
automatic cut-off, campus mobility, electric bicycle charging station, Internet of Things, multi-mode charging
Global transportation systems are undergoing a structural transition toward electrification in response to fossil-fuel depletion, energy-price volatility, and the need to reduce greenhouse-gas emissions [1]. Electric mobility can reduce dependence on petroleum-based fuels, improve energy-conversion efficiency, and support lower-emission transport systems across different vehicle classes [2]. Long-term adoption projections based on sales records from 2010–2018 across 26 countries indicate that electric vehicles may account for approximately 30% of the global passenger vehicle fleet by 2032 [3]. Within this transition, electric bicycles represent a practical form of light electric mobility because they are suitable for short-distance travel, generate no tailpipe emissions, produce low noise, and require relatively simple maintenance [4]. In Indonesia, the relevance of light electric mobility is reinforced by national policy targets related to electric two-wheeler production and the broader decarbonisation agenda [5].
University campuses are particularly suitable environments for implementing electric bicycle infrastructure because they contain concentrated mobility demand, predictable travel patterns, and defined groups of users such as students, academic staff, and administrative personnel. Electric bicycles can support daily movement between classrooms, laboratories, offices, and parking areas while contributing to institutional sustainability goals linked to affordable energy, innovation, sustainable communities, and climate action [6]. Prior campus mobility studies indicate that predictable travel demand and dwell-time patterns can improve the feasibility of charging infrastructure deployment [7]. However, the effectiveness of electric bicycle adoption on campus depends not only on the availability of vehicles but also on reliable, accessible, and safe charging facilities.
Charging infrastructure remains one of the main barriers to wider electric vehicle adoption in Indonesia and in many campus environments. Limited access to charging points can increase waiting time, discourage users, and lead to prolonged connection of vehicles after charging is complete [8, 9]. Beyond availability, the technical quality of the charger is critical because charging current, voltage regulation, and protection mechanisms directly influence charging time, battery degradation, safety, and user convenience [9, 10]. Conventional electric bicycle chargers commonly rely on simple visual indicators to show charging completion, but this approach does not guarantee automatic electrical disconnection. As a result, vehicles left unattended for extended periods remain vulnerable to overcharging, unnecessary energy consumption, and premature battery aging.
Existing studies on electric vehicle charging infrastructure have made important contributions, but several limitations remain when the specific needs of 48 V electric bicycles and campus-scale deployment are considered. Many recent charging station studies emphasize high-power, high-voltage, or multi-energy systems for electric cars and heavy-duty electric vehicles [11, 12]. These systems provide useful insights into smart charging architecture but are not directly transferable to low-voltage electric bicycle platforms. Campus charging studies have also explored RFID-based access and multiple charging slots [9], yet they generally do not combine multi-mode current control, automatic cut-off protection, and real-time Internet of Things (IoT) monitoring in a single experimentally validated system. This creates a clear technical gap for light electric mobility infrastructure.
Against this background, the technical gap addressed here is narrow and implementation-oriented: the same 48 V prototype is used to compare three discrete current settings, verify an independent voltage-threshold cut-off, and record battery-side voltage, current, power, and energy at 5 s intervals. Relative to recent IoT e-bike chargers [7-9], the distinguishing evidence is the side-by-side charging-time and cut-off characterization of 3 A, 5 A, and 7 A modes. The work does not claim a new converter topology, a complete commercial CC-CV charger, or superior lifecycle performance.
The objectives were to design the charging and monitoring architecture, characterize charging duration and current stability for the three modes, evaluate disconnection repeatability at the calibrated 51.5 V threshold, and verify laboratory data acquisition. The study is a proof-of-concept evaluation using one 48 V, 20 Ah sealed lead-acid battery and three trials per mode. Accordingly, its contribution is integrated laboratory characterization using commercially available modules; generalization to other batteries, long-term safety, efficiency, economic value, and campus-scale operation remains outside the present evidence.
2.1 Research design and development framework
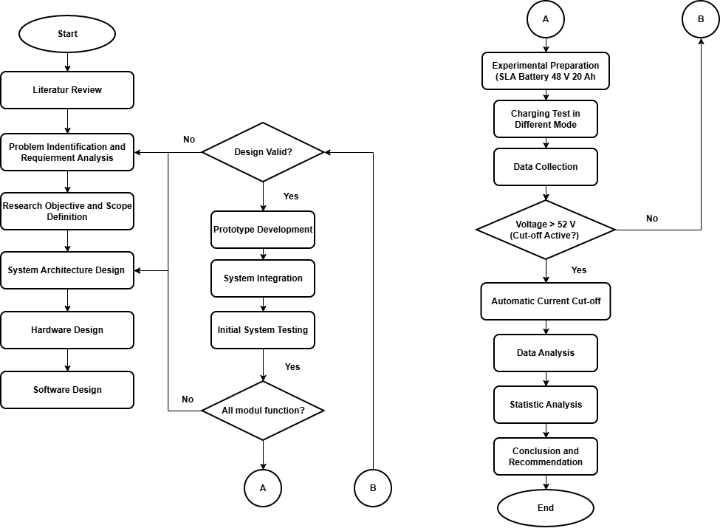
The study followed a research-and-development process with experimental verification, as summarized in Figure 1. The stages comprised focused literature review and gap identification, system specification, hardware design, component procurement, electrical and mechanical assembly, functional testing, revision, performance testing, and interpretation. This sequence is consistent with design-science work in which an engineered artifact is evaluated against explicit operating objectives [11].
Experimental verification compared three charging-current modes with three trials per mode. The same battery was intentionally reused to isolate the effect of the selected current within one pack and to reduce between-battery variability. The nine trials therefore support proof-of-concept functionality and within-pack repeatability only; they do not constitute a population sample of batteries or evidence of long-term charging performance.
Figure 1. Research framework
2.2 System architecture
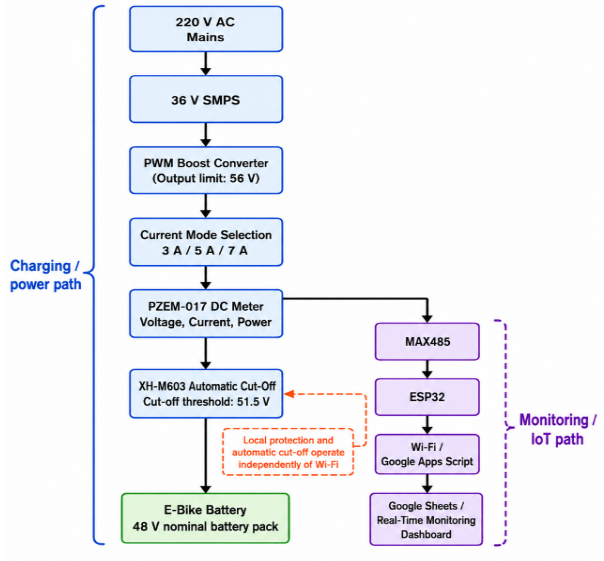
The station was organized as a modular power and information flow (Figure 2). A 220 V AC single-phase source supplied a 36 V, 30 A switched-mode power supply. A PWM-controlled boost converter provided an adjustable DC output with a configured ceiling of 56 V. This 56 V value denotes converter capability and design headroom; it was not the battery-terminal target. During the tests, the battery terminal increased from approximately 48.0 V until the independent cut-off opened at 51.5 V.
Figure 2. Functional block diagram of the charging and monitoring architecture
The implemented algorithm was current-limited charging with voltage-threshold termination. The PWM setting established nominal current levels of 3 A, 5 A, and 7 A (0.15 C, 0.25 C, and 0.35 C for the 20 Ah pack) during the main charging region. Current decreased as the terminal voltage approached the cut-off. No dedicated closed-loop constant-voltage stage or float stage was implemented; therefore, the system should not be described as a complete CC-CV charger. Table 1 reports design-point values. Input current and power were estimated using an assumed 90% conversion efficiency and were not measured.
Table 1. Design-point electrical parameters for the three current modes
|
Parameter |
Normal |
Medium |
Fast |
|
Converter voltage ceiling (V) |
56 |
56 |
56 |
|
Nominal current set point (A) |
3 |
5 |
7 |
|
Nominal C-rate for 20 Ah pack |
0.15 C |
0.25 C |
0.35 C |
|
Design-point output power at 56 V (W) |
168 |
280 |
392 |
|
Estimated 36 V input current at η = 90% (A) |
5.19 |
8.64 |
12.10 |
|
Estimated input power at η = 90% (W) |
186.67 |
311.11 |
435.56 |
Note: The η = 90% values are design estimates only. AC-side and converter input measurements were not recorded, so conversion efficiency and energy loss were not experimentally determined.
Battery-side voltage, current, power, and cumulative energy were measured by a PZEM-017 module and 50 A shunt. An XH-M603 relay module was installed in series after the sensing stage and calibrated to open at 51.5 V; 52.0 V was used only as an experimental upper observation boundary. The relay acts directly in the charging path and does not depend on Wi-Fi, the ESP32, or cloud availability. Relay actuation delay, hysteresis, reset/restart behaviour, and response to imposed voltage fluctuations were not separately instrumented; the reported protection result is therefore limited to the observed disconnection voltage in each trial.
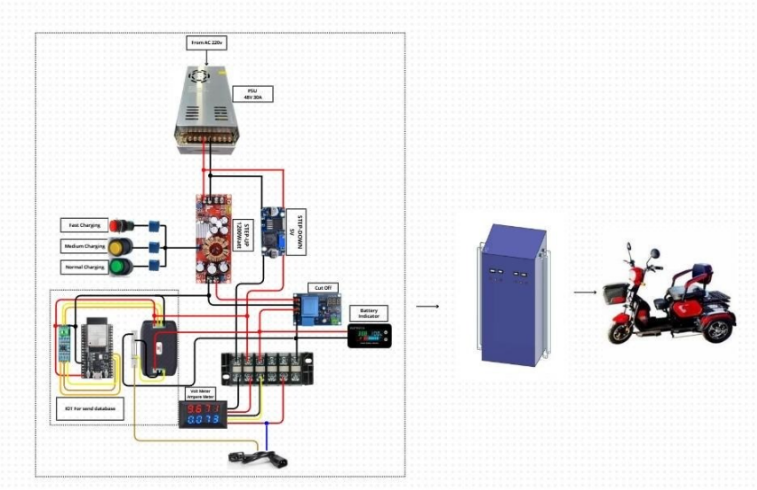
The components were mounted in a carbon-steel frame with PVC panels, ventilation openings, front-panel mode selection, and a single IEC charging connector. Figure 2 presents the functional signal and energy flow, while Figure 3 retains the component-level interconnection used for fabrication. The prototype had one charging port and no user-authentication or scheduling function.
Figure 3. Charging station design
2.3 IoT monitoring configuration
The monitoring chain consisted of the PZEM-017 sensor and shunt, a MAX485 RS-485-to-UART interface, and an ESP32. The PZEM-017 provided voltage, current, power, and energy registers through Modbus-RTU at 9600 baud. The ESP32 polled the sensor through UART2 and transmitted the readings to a Google Apps Script endpoint. Because the protection relay is electrically independent, failure of this data path does not prevent threshold disconnection.
The polling and logging interval was 5 s. Timestamped records were appended to Google Sheets through HTTP GET over indoor Wi-Fi, and selected readings were compared with a calibrated digital multimeter and a front-panel volt-ampere meter. The validation used one ESP32 under relatively stable laboratory Wi-Fi. No authentication, encrypted device identity, local buffering, redundant communication, deliberately degraded signal test, or simultaneous multi-device test was implemented.
2.4 Experimental and procedure
Tests were conducted indoors in the Mechanical Engineering Workshop D4, Faculty of Vocational Studies, Universitas Negeri Surabaya. The test article was one 48 V, 20 Ah sealed lead-acid pack installed on an electric bicycle. Its nominal energy rating is 960 Wh (48 V × 20 Ah), but actual stored or delivered energy was not determined because complete input-output energy measurements were unavailable.
Each trial began after the pack was discharged to a standardized open-circuit terminal voltage of 48.00 ± 0.20 V, verified with a calibrated digital multimeter, and rested for at least 30 min. This voltage criterion was used for repeatability; no independent state-of-charge estimator was available, so it should not be interpreted as a validated 50% state of charge. A trial ended when the relay opened at the calibrated 51.5 V threshold and current fell to 0 A. The threshold was an experimental comparison endpoint and not a claim of complete battery charging.
The independent variable was the current mode (3 A, 5 A, or 7 A). The primary outcome was elapsed time to relay disconnection. Secondary outcomes were battery-terminal voltage trajectory, current deviation from the selected set point, disconnection voltage, logging-interval consistency, record completeness, and sensor deviation from the reference instrument. Ambient temperature and relative humidity were approximately 27-30 ℃ and 60-75%, respectively. Battery-surface and component temperatures were not recorded.
For each mode, the mean and sample standard deviation were calculated from three trials. A one-way ANOVA was used as an exploratory comparison at α = 0.05, with Shapiro-Wilk assessment of residual normality, Levene assessment of variance homogeneity, F-test degrees of freedom, η² effect size, and Tukey HSD pairwise intervals. Because n = 3 per mode provides weak assumption diagnostics, an exact permutation test over all 1,680 labelled allocations of three observations per group was also used to confirm the overall mode effect. Statistical significance was not interpreted as evidence of long-term battery safety or population-level reliability.
Voltage and current records were plotted against time and terminal voltage. Descriptive regions in the curves were used to discuss observed behaviour; they were not treated as programmed charging stages. Cut-off performance was evaluated from the disconnection voltage relative to 51.5 V. IoT performance was evaluated only for the laboratory network from timestamp jitter, missing records, and selected sensor-reference deviations.
3.1 Prototype development and functional integration
The prototype integrated a 220 V AC input, a 36 V DC supply, a PWM-controlled boost stage, selectable current-limited modes, battery-side sensing, relay-based voltage-threshold disconnection, and ESP32 cloud logging. The 56 V setting served as a converter ceiling, while the tested battery terminal was disconnected at 51.5 V. The resulting architecture provided three separate functions: controllable charging current, hardware protection independent of communications, and time-stamped observation.
The hardware was assembled from commercially available modules. This choice reduced implementation complexity and supports replication, but the study did not record a bill of materials, labour cost, certification cost, or maintenance cost. Accordingly, the revised manuscript refers to an off-the-shelf prototype rather than claiming a demonstrated cost advantage. Likewise, one charging port and one monitoring device do not establish scalability.
The engineering contribution is therefore system-level integration and comparative laboratory characterization rather than a new power-converter topology. The evidence directly supports selectable current, repeatable threshold disconnection, and 5 s data logging for the tested configuration. Outdoor operation, multiple simultaneous users, unstable supply and network conditions, certified protection, and charge-profile compatibility with battery-manufacturer requirements remain necessary before campus deployment.
3.2 Charging duration performance across current modes
Charging duration was the main performance indicator used to determine the effect of current-mode variation. Nine charging trials were performed using a 48 V, 20 Ah sealed lead-acid battery, with three independent replications for each mode. Each trial began from a standardized initial condition of approximately 50% state of charge, represented by a terminal voltage of 48.00 V ± 0.2 V, and ended when the automatic cut-off relay opened at the calibrated threshold. This procedure ensured that the comparison among the three current modes was based on equivalent initial battery conditions.
Table 2. Charging station performance test results
|
Charging Mode |
Trial 1 (min) |
Trial 2 (min) |
Trial 3 (min) |
Average (min) |
SD (min) |
|
Normal (3 A) |
199 |
195 |
197 |
197 |
3.6 |
|
Medium (5 A) |
131 |
133 |
129 |
131 |
4.0 |
|
Fast (7 A) |
108 |
106 |
110 |
108 |
4.0 |
Table 2 presents the charging duration measured for each mode. Normal mode required 199, 195, and 197 min, resulting in a mean duration of 197 min and a standard deviation of ±3.6 min. Medium mode required 131, 133, and 129 min, resulting in a mean duration of 131 min and a standard deviation of ±4.0 min. Fast mode required 108, 106, and 110 min, resulting in a mean duration of 108 min and a standard deviation of ±4.0 min. The inter-trial variability remained below approximately 2.1%, indicating high repeatability across all modes and confirming that the differences in charging duration were primarily caused by the applied charging-current set point.
Relative to Normal mode, Medium mode reduced the mean time by 66 min (33.5%) and Fast mode by 89 min (45.2%). Levene’s test did not indicate unequal variances (F = 0.00, p = 1.00), whereas the Shapiro-Wilk test of ANOVA residuals did not support normality (W = 0.823, p = 0.037). The exploratory ANOVA nevertheless produced F(2,6) = 1600.75, p < 0.001, with η² = 0.998. The exact permutation result also supported an overall mode difference (p = 0.0036). Exploratory Tukey HSD intervals were 60.99-71.01 min for Normal-Medium, 83.99-94.01 min for Normal-Fast, and 17.99-28.01 min for Medium-Fast (all adjusted p < 0.001). These inferential results should be interpreted cautiously because each mode had only three observations from one battery.
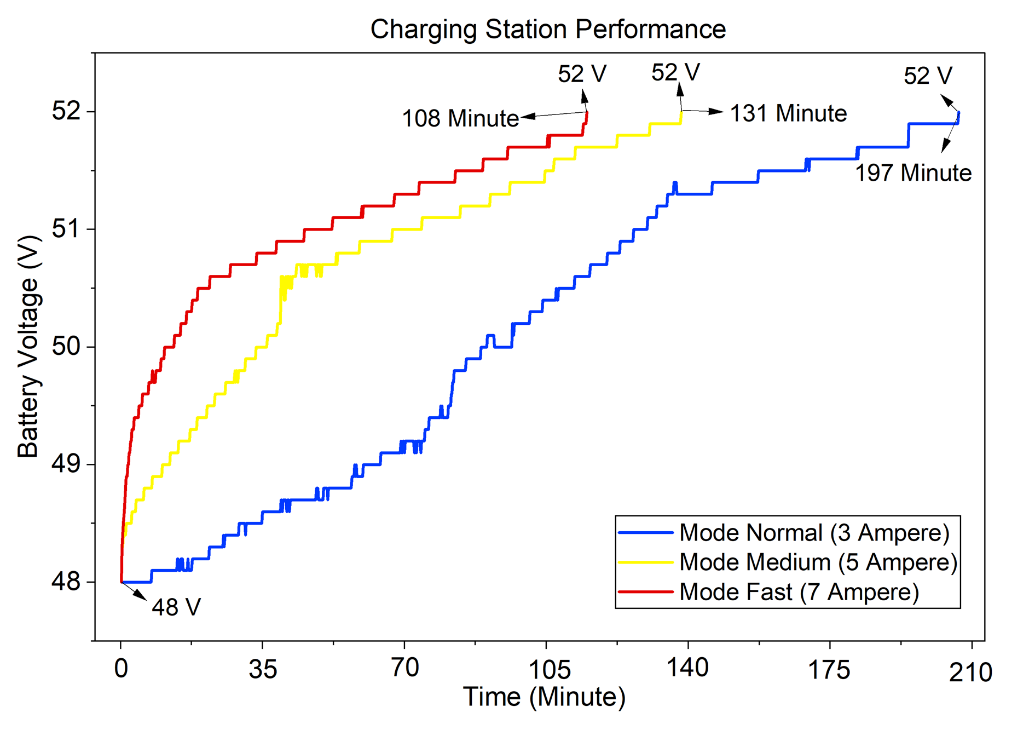
The time saving was nonlinear: increasing current from 3 A to 5 A saved 66 min, whereas increasing from 5 A to 7 A saved only 23 min. The curves are consistent with reduced marginal time benefit as the terminal voltage approaches the cut-off and current begins to taper. However, this pattern cannot be assigned uniquely to battery charge acceptance, converter efficiency, or electrical losses because AC-side input power and converter input-output energy were not measured. The 90% values in Table 1 are design assumptions, not efficiency results. Consequently, Fast mode is supported as the shortest tested option, not as the most energy-efficient mode.
3.3 Voltage profile characteristics during charging
The voltage trajectories recorded by the IoT monitoring subsystem showed reproducible multi-stage charging behaviour across all nine trials. The terminal voltage increased from approximately 48.00 V toward the automatic cut-off threshold of 51.5 V. Although the total duration differed substantially among modes, the overall pattern of voltage evolution remained consistent. This result indicates that the multi-mode current-control mechanism did not induce abnormal voltage behaviour in the tested sealed lead-acid battery.
As illustrated in Figure 4, the initial stage was characterized by a relatively rapid rise in terminal voltage from approximately 48.0–49.6 V to around 50.4 V. This stage represents early charge restoration and surface-charge accumulation on the electrode plates. Its duration decreased as the charging current increased, with Fast mode reaching this voltage range more rapidly than Normal mode. The middle stage showed a more gradual voltage increase and corresponded to the main energy-transfer period. During this phase, the current remained close to the configured set point, indicating that the regulation circuit sustained stable current delivery while most of the electrochemical charging process occurred.
The final stage was marked by an asymptotic approach to the 51.5 V cut-off threshold, during which the voltage rise progressively slowed. This pattern reflects the reduced charge acceptance of sealed lead-acid batteries near the fully charged condition. The absence of abrupt overshoot or unstable voltage escalation in Fast mode is particularly important because higher charging currents can increase the risk of thermal stress or accelerated degradation if not properly controlled. The observed voltage trajectories therefore suggest that the proposed charger can reduce charging time while maintaining controlled terminal-voltage behaviour. However, long-term cycling tests are still required to determine whether repeated Fast-mode charging affects capacity retention, internal resistance, and battery aging.
Figure 4. Charging performance and voltage trajectory
3.4 Current regulation and automatic cut-off performance
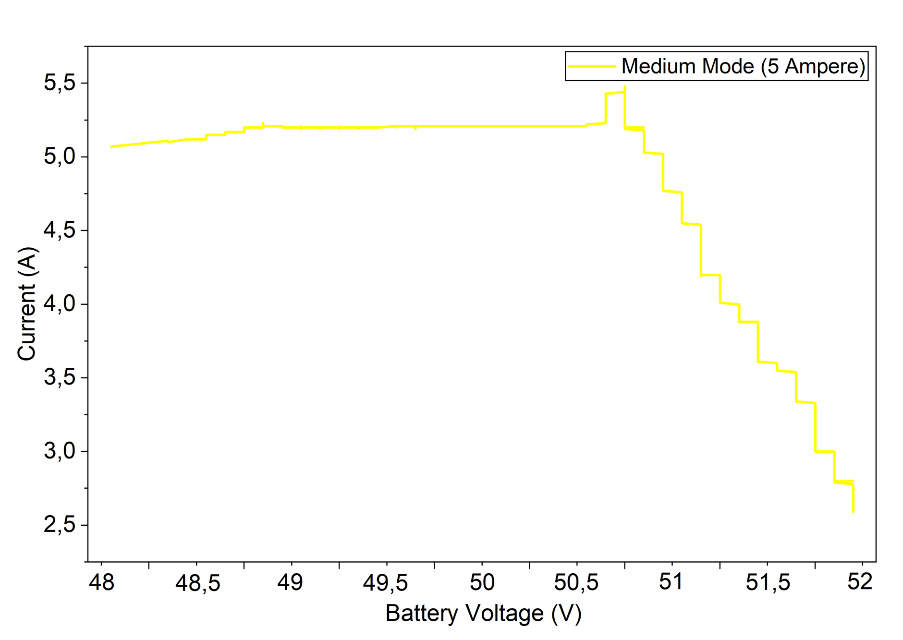
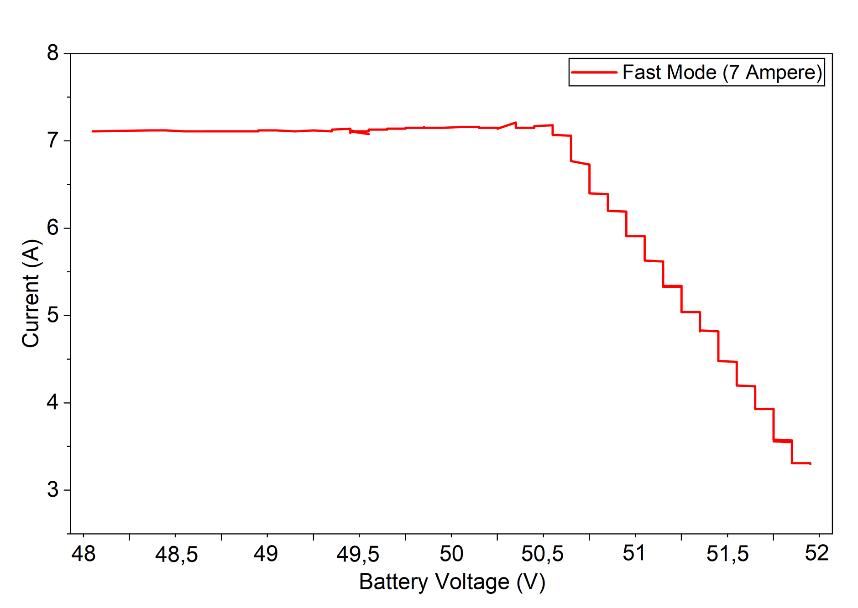
Current regulation was evaluated by comparing the measured charging current with the selected set point during the main charging phase. As shown in Figure 5-7, the system maintained current delivery within approximately ±2% of the configured level across all operating modes. In Fast mode, as shown in Figure 7, the current remained close to 7 A during the bulk phase and decreased smoothly as the battery approached the cut-off threshold. This behaviour demonstrates that the boost converter and pulse-width modulation control stage were able to provide stable current regulation without excessive oscillation.
Figure 5. Charging current profile under Normal mode
Figure 6. Charging current profile under Medium mode
Figure 7. Charging current profile under Fast mode
The automatic cut-off system was evaluated using the calibrated threshold of 51.5 V. Across all nine trials, the XH-M603 relay-based protection module successfully terminated charging within a ±0.2 V window of the threshold. The maximum positive deviation was +0.2 V, recorded at 51.7 V in Fast Mode Trial 1, whereas the maximum negative deviation was −0.2 V, recorded at 51.3 V in Medium mode Trial 1. The average cut-off voltage across all trials was 51.51 V, corresponding to a systematic deviation of only +0.01 V or approximately 0.019% relative error from the calibrated threshold. No trial exceeded the 52.0 V upper safety boundary.
As illustrated in Figures 5-7, increasing the selected charging mode resulted in a corresponding increase in charging current while maintaining a controlled profile throughout the charging process. The slightly wider cut-off deviation observed under Fast mode is technically plausible because the higher charging current produces a faster voltage rise near the threshold, reducing the response time available for relay activation. Nevertheless, all deviations remained within the predefined safety window and did not compromise the protection function. The 100% cut-off success rate is a critical finding for campus deployment because electric bicycles are often left connected while users attend classes, laboratory sessions, or administrative activities. Automatic disconnection therefore reduces the risk of overcharging, unnecessary energy consumption, and accelerated battery degradation associated with prolonged unattended charging.
3.5 IoT-based real-time monitoring validation
The IoT monitoring subsystem was validated based on logging interval consistency, data completeness, and measurement accuracy. During approximately 48 h of cumulative operation across nine charging trials, the ESP32-based data acquisition system maintained the configured five-second logging interval with a maximum observed timestamp jitter of ±0.3 s. No packet loss was recorded during the experimental campaign, indicating 100% data transmission completeness under the tested indoor Wi-Fi conditions.
Measurement accuracy was verified through parallel readings using a calibrated digital multimeter at selected intervals. The PZEM-017 voltage readings showed an average deviation of 0.38% from the reference instrument, with a maximum deviation of 0.52%. Current readings showed an average deviation of 0.94%, with a maximum deviation of 1.18%. These values remained within the sensor accuracy specifications of ±1% for voltage and ±1.5% for current, confirming that the monitoring subsystem provided sufficient measurement fidelity for real-time observation and post-test performance analysis.
The real-time monitoring function adds an important operational layer to the charging station. Rather than functioning only as an electrical charger, the system becomes an observable infrastructure component capable of producing charging records for users and facility managers. In a campus environment, this capability can support the identification of usage patterns, maintenance needs, abnormal charging behaviour, and energy consumption trends. However, the present validation was conducted under relatively stable indoor network conditions. Future deployment should therefore test communication robustness under fluctuating Wi-Fi signal strength, simultaneous users, outdoor placement, and longer unattended operation.
3.6 Comparative interpretation and practical implications
The performance trend observed in this study is consistent with the expected relationship between current level and charging duration. Peffers et al. [13] reported a charging duration of 164 min for a comparable 48 V, 20 Ah sealed lead-acid battery at 4 A. In the present system, Normal mode at 3 A required 197 min, while Medium mode at 5 A required 131 min. This comparison supports the construct validity of the results because lower current produced a longer charging duration and higher current produced a shorter duration relative to the 4 A reference condition.
Compared with large-scale electric vehicle charging systems, the proposed system addresses a more specific but practically important implementation scale. Prior studies on high-power charging infrastructure commonly emphasize electric cars, heavy-duty electric vehicles, renewable energy integration, or grid-level optimization [11, 12]. Those platforms provide important design insights, but their voltage levels, power ratings, and operational requirements are not directly transferable to 48 V electric bicycle systems. Campus-oriented charging studies have also discussed access control and charging-slot availability [9, 14, 15], yet they have not consistently integrated current-mode selection, automatic cut-off protection, and real-time monitoring in a single experimentally validated low-voltage platform.
The practical implication of the multi-mode architecture is that users are not restricted to a single charging speed. Normal mode can be used when long parking duration is available, Medium mode can support moderate-duration campus activities, and Fast mode can provide shorter turnaround for users with limited dwell time. This flexibility is particularly relevant in campus environments where travel demand is concentrated around class schedules, laboratory sessions, and administrative working hours. By aligning charging rate with user dwell time, the system can improve charging accessibility and reduce unnecessary occupation of charging ports.
The automatic cut-off function is equally important from a safety and operational perspective. In real campus use, vehicles may remain connected for longer than necessary because users are away from the parking area. A charger without automatic disconnection may continue to expose the battery to unnecessary electrical stress after the target voltage is reached. The present system mitigates this risk by terminating the charging process automatically, while the IoT subsystem provides traceable evidence that the disconnection occurred within the calibrated threshold window. The combined system therefore improves both user-level convenience and infrastructure-level controllability [16, 17].
Table 3 positions the prototype against recent e-bike monitoring studies and a commercial 48 V charger benchmark. The comparison is qualitative because the systems use different battery chemistries, test conditions, power sources, and objectives. It is intended to define the contribution and remaining gaps, not to claim universal superiority.
Table 3. Qualitative comparison with related and commercial solutions
|
Reference / Platform |
Relevant Comparison with the Present Prototype |
|
Ilahi et al. [7] |
Economical e-bike charger with IoT real-time parameter monitoring. The present work adds a controlled 3/5/7 A time comparison and reported cut-off repeatability; neither establishes lifecycle performance here. |
|
Hidayat et al. [8] |
Hybrid-powered e-bike station with IoT monitoring, Coulomb-counting-related estimation, and prediction. The present work is grid-fed and focuses on current-mode and cut-off characterization. |
|
Liu et al. [9] |
Non-intrusive CNN-BiLSTM charging-state recognition for lithium batteries. The present work uses direct sensors and has no diagnostic machine-learning function. |
|
Present prototype |
Three current-limited modes, independent 51.5 V cut-off, and 5 s battery-side logging. Limitations: one battery, one port, indoor Wi-Fi, no authentication/scheduling, no measured efficiency, thermal data, cost analysis, or certification. |
Within the laboratory scenario, Normal mode offers the longest time and lowest nominal C-rate, Medium mode provides the largest incremental time saving, and Fast mode provides the shortest measured turnaround. These labels describe operating choices rather than battery-health recommendations. Selection for actual users should be constrained by the battery manufacturer’s permitted current and charge profile, which were not evaluated across multiple pack types in this study.
The independent relay can reduce the duration of continued electrical connection after the selected terminal-voltage threshold is reached, while the IoT record can document the event. This pairing is practically useful for unattended campus parking, but one protected connector does not by itself demonstrate station-level availability, queue reduction, cybersecurity, or fleet management. Those outcomes require multi-port and multi-user deployment studies [18, 19].
3.7 Campus-mobility relevance and study limitations
The prototype can support campus e-bike mobility by providing selectable charging time, automatic experimental-threshold disconnection, and observable records. These are enabling infrastructure functions; they are not direct evidence of sustainability benefits. The study did not quantify grid energy consumption, avoided emissions, renewable-energy contribution, lifecycle impacts, or rebound effects. Accordingly, the charger is described as supporting campus-mobility operations rather than as demonstrating carbon or environmental improvement [20, 21].
The principal limitations are: one 48 V, 20 Ah sealed lead-acid battery; three trials per mode; a terminal-voltage starting criterion without independent state-of-charge estimation; no battery-surface temperature, gas, internal-resistance, capacity-retention, or cycle-life data; no measured AC input or converter efficiency; no instrumented relay delay, hysteresis, restart, or disturbance test; one device on stable indoor Wi-Fi; and no outdoor, multi-port, simultaneous-user, authentication, scheduling, cybersecurity, or commercial-charger test under a common protocol. The study also lacks a bill of materials, economic analysis, environmental assessment, and product-safety certification [22].
Future work should add multiple new and aged batteries, battery-specific charge profiles, thermal sensing, long-term cycling, four-wire and AC-side power measurements, converter-efficiency and energy-loss analysis, relay dynamic tests, degraded-network and offline-buffering tests, multi-device operation, access control, reservation and scheduling, common-protocol comparison with commercial chargers, cost-of-ownership analysis, outdoor-enclosure qualification, and lifecycle or carbon assessment. These steps are required before claims of safety, efficiency, sustainability, or campus-scale readiness can be strengthened [23].
A 48 V charging-station proof of concept was developed with current-limited modes of 3 A, 5 A, and 7 A, independent relay disconnection at 51.5 V, and 5 s ESP32-PZEM-017 logging. For one 48 V, 20 Ah sealed lead-acid battery and three trials per mode, mean (SD) times to the experimental cut-off were 197 (2), 131 (2), and 108 (2) min. The exploratory ANOVA was F(2,6) = 1600.75, p < 0.001, η² = 0.998, and an exact permutation test gave p = 0.0036. All trials disconnected within ±0.2 V of the threshold, and no missing records were observed during approximately 48 h of stable indoor Wi-Fi operation. These findings demonstrate short-term electrical functionality and within-pack repeatability of the integrated architecture. They do not establish full-charge performance, measured conversion efficiency, thermal or cycle-life safety, environmental benefit, or field communication reliability. The main contribution is therefore the combined laboratory characterization of selectable current, hardware cut-off, and real-time logging; deployment claims require the broader validation described in Section 3.7.
The authors acknowledge the Faculty of Vocational Studies, Universitas Negeri Surabaya, for providing facilities and technical support during the development and testing of the multi-mode electric bicycle charging station. The authors also thank the Mechanical Engineering Workshop D4 team for assistance during prototype fabrication, experimental preparation, and validation activities. Appreciation is extended to all laboratory staff and students who contributed to the assembly, measurement, and data acquisition processes throughout the study.
[1] Knobloch, F., Hanssen, S.V., Lam, A., et al. (2020). Net emission reductions from electric cars and heat pumps in 59 world regions over time. Nature Sustainability, 3: 437-447. https://doi.org/10.1038/s41893-020-0488-7
[2] Ashfaq, M., Butt, O., Selvaraj, J., Rahim, N. (2021). Assessment of electric vehicle charging infrastructure and its impact on the electric grid: A review. International Journal of Green Energy, 18(7): 657-686. https://doi.org/10.1080/15435075.2021.1875471
[3] Rietmann, N., Hügler, B., Lieven, T. (2020). Forecasting the trajectory of electric vehicle sales and the consequences for worldwide CO2 emissions. Journal of Cleaner Production, 261: 121038. https://doi.org/10.1016/j.jclepro.2020.121038
[4] Fishman, E., Cherry, C. (2016). E-bikes in the mainstream: Reviewing a decade of research. Transport Reviews, 36(1): 72-91. https://doi.org/10.1080/01441647.2015.1069907
[5] Sierzchula, W., Bakker, S., Maat, K., van Wee, B. (2014). The influence of financial incentives and other socio-economic factors on electric vehicle adoption. Energy Policy, 68: 183-194. https://doi.org/10.1016/j.enpol.2014.01.043
[6] Balsas, C.J.L. (2003). Sustainable transportation planning on college campuses. Transport Policy, 10(1): 35-49. https://doi.org/10.1016/S0967-070X(02)00028-8
[7] Ilahi, T., Izhar, T., Ali, M., et al. (2024). Comprehensive design analysis of economical e-bike charger with IoT-empowered system for real-time parameter monitoring. Journal of Advanced Transportation, 2024(1): 2387983. https://doi.org/10.1155/2024/2387983
[8] Hidayat, M.N., Nugroho, A., Munir, A.F., Putri, R.I. (2025). Internet of Things (IoT) based monitoring system for hybrid powered e-bike charging station. International Journal of Power Electronics and Drive Systems, 16(1): 243-250. https://doi.org/10.11591/ijpeds.v16.i1.pp243-250
[9] Liu, J.M., Wang, C., Xu, L.F., et al. (2024). A study of electric bicycle lithium battery charging monitoring using CNN and BiLSTM networks model with NILM method. Electronics, 13(16): 3316. https://doi.org/10.3390/electronics13163316
[10] Woody, M., Arbabzadeh, M., Lewis, G.M., Keoleian, G.A., Stefanopoulou, A. (2020). Strategies to limit degradation and maximize Li-ion battery service lifetime - Critical review and guidance for stakeholders. Journal of Energy Storage, 28: 101231. https://doi.org/10.1016/j.est.2020.101231
[11] Ding, R., Rao, Z.H., Li, B.Y., Liu, J., Liu, X.L. (2024). Capacity optimization and multimode operation analysis of electric vehicle charging system powered by grid, solar and geothermal energy. Sustainable Energy Technologies and Assessments, 68: 103851. https://doi.org/10.1016/j.seta.2024.103851
[12] Wang, L., Qin, Z., Slangen, T., Bauer, P., van Wijk, T. (2021). Grid impact of electric vehicle fast charging stations: Trends, standards, issues and mitigation measures - An overview. IEEE Open Journal of Power Electronics, 2: 56-74. https://doi.org/10.1109/OJPEL.2021.3054601
[13] Peffers, K., Tuunanen, T., Rothenberger, M.A., Chatterjee, S. (2007). A design science research methodology for information systems research. Journal of Management Information Systems, 24(3): 45-77. https://doi.org/10.2753/MIS0742-1222240302
[14] Kurniawan, E., Pratama, M.A.N., Eddi, E. (2024). Sound-based light control system in the ship's room with Uno Arduino. Sainstech Nusantara, 1(1): 1-6. https://doi.org/10.71225/jstn.v1i1.43
[15] Yilmaz, M., Krein, P.T. (2013). Review of battery charger topologies, charging power levels, and infrastructure for plug-in electric and hybrid vehicles. IEEE Transactions on Power Electronics, 28(5): 2151-2169. https://doi.org/10.1109/TPEL.2012.2212917
[16] Apeh, O.O., Meyer, E.L., Overen, O.K. (2021). Modeling and experimental analysis of battery charge controllers for comparing three off-grid photovoltaic power plants. Heliyon, 7(11): e08331. https://doi.org/10.1016/j.heliyon.2021.e08331
[17] Subekti, A., Pramono, S.H., Nurwati, T., Artha Wirawan, W. (2026). Metaheuristic-tuned PID and fractional-order PID control for photovoltaic systems: A systematic review and benchmarking framework. Systems Science & Control Engineering, 14(1): 2671482. https://doi.org/10.1080/21642583.2026.2671482
[18] Bimansyah, H.A., Herlambang, S.M., Eddi, E. (2024). Design and construction of fire detection equipment on electrical panels automatically using IoT. Sainstech Nusantara, 1(1): 7-12. https://doi.org/10.71225/jstn.v1i1.42
[19] Fazeli, S.S., Venkatachalam, S., Chinnam, R.B., Murat, A. (2021). Two-stage stochastic choice modeling approach for electric vehicle charging station network design in urban communities. IEEE Transactions on Intelligent Transportation Systems, 22(5): 3038-3053. https://doi.org/10.1109/TITS.2020.2979363
[20] May, G.J., Davidson, A., Monahov, B. (2018). Lead batteries for utility energy storage: A review. Journal of Energy Storage, 15: 145-157. https://doi.org/10.1016/j.est.2017.11.008
[21] Martínez, V.A., Sumper, A. (2023). Planning and operation objectives of public electric vehicle charging infrastructures: A review. Energies, 16(14): 5431. https://doi.org/10.3390/en16145431
[22] Li, Y.J., Pei, W.H., Zhang, Q., Xu, D., Ma, H. (2023). Optimal layout of electric vehicle charging station locations considering dynamic charging demand. Electronics, 12(8): 1818. https://doi.org/10.3390/electronics12081818
[23] Nugraha, A.T., Jamaludin, M., Sobhita, R.A., Saputra, D.E. (2025). Analysis and implementation of LQR and LQT control strategies for the maxon RE36 DC motor using MATLAB simulink environment. Sainstech Nusantara, 2(2): 1-13. https://doi.org/10.71225/JSTN.V2I2.9