Laith A.H. Al-Shimaysawee* | Ali H.A. Al-Dabbagh | Maitham S. Jabbar
© 2026 The authors. This article is published by IIETA and is licensed under the CC BY 4.0 license (http://creativecommons.org/licenses/by/4.0/).
OPEN ACCESS
Infrastructure-based perception systems using roadside LiDAR sensors have emerged as a promising approach for enhancing traffic safety by providing elevated, occlusion-free views of complex traffic scenarios. This paper presents a real-time collision detection framework for infrastructure-mounted LiDAR that fuses three complementary geometric criteria path intersection, corridor-based proximity, and bounding box penetration rather than relying on a single detection test. Point cloud data is processed through ground removal, background subtraction, Density-Based Spatial Clustering of Applications with Noise (DBSCAN) clustering, nearest-neighbor tracking, and constant-velocity trajectory prediction. Unlike prior infrastructure LiDAR safety studies that validate retrospectively against historical crash records, the proposed framework targets real-time, per-event collision warning. The system is evaluated on 50 accident scenarios from the simulated DeepAccident dataset across multiple prediction horizons; a 2-second horizon yields precision of 0.70, recall of 0.89, and F1-score of 0.78, suggesting a favorable balance between early warning capability and prediction reliability. End-to-end processing latency averages 97.4 ms on standard computing hardware, within the real-time budget of the 10 Hz LiDAR frame rate used in this deployment. As the evaluation is simulation-based, real-world validation remains necessary to confirm practical effectiveness.
infrastructure LiDAR, collision detection, trajectory prediction, robotics, computer vision, intelligent transportation, multi-object tracking
The rise of deployed autonomous vehicles (AVs) and connected transportation systems has created an urgent need for robust perception and safety mechanisms that can operate reliably in complex traffic environments. According to recent studies, traffic accidents are considered one of the leading causes of death globally, with intersection-related collisions accounting for a significant proportion of urban traffic fatalities [1]. Vehicle-based perception systems demonstrated remarkable progress using advanced sensors and deep learning algorithms [2]. In recent studies, multiple on-board LiDAR and camera sensors have been utilized for crash scene analysis [3, 4]. However, these methods still suffer from limitations such as occlusion, limited field of view, and computational constraints, which can compromise safety in critical scenarios.
Recently, infrastructure-based perception systems have been widely used for accident detection and analysis [5, 6]. Particularly, those relying on roadside LiDAR sensors have emerged as a promising complementary approach to enhance traffic safety and support autonomous driving operations [7].
Unlike vehicle-mounted sensors that have several limitations such as the ego vehicle’s perspective, infrastructure sensors can provide an elevated, clear view of traffic participants, enabling detection of vehicles and pedestrians from different angles and a wider perspective that may be occluded from the perspective of approaching vehicles [8]. This capability is particularly valuable at complex intersections where visual blockage such as buildings, vegetation, and other vehicles frequently creates blind spots [9].
Vehicle-to-Everything (V2X) communication technologies have further paved the way for integrating infrastructure-based perception with connected vehicles [10]. This allowed real-time sharing of detected objects, trajectories, and potential collision warnings [8, 11]. Therefore, shared or cooperative perception systems that combine infrastructure and vehicle-based sensing have demonstrated improved detection accuracy and extended perception range compared to single-agent systems [12]. Recent large-scale cooperative-perception benchmarks such as TUMTraf V2X [13] and the Technical University of Munich (TUM) traffic accident dataset [14] further illustrate this trend, providing synchronized infrastructure-vehicle sensor data for object detection and, more recently, safety-critical event analysis. However, these efforts primarily target perception and detection benchmarking rather than real-time, per-event collision prediction, which is the focus of the present work. However, the practical deployment of such systems needs efficient algorithms capable of real-time processing and collision prediction [15].
LiDAR sensors offer distinct advantages over Red-Green-Blue (RGB) cameras for traffic monitoring and collision detection applications. Indeed, LiDAR provides direct and accurate depth measurements without relying on stereo matching or depth estimation. This allows precise 3D localization of objects regardless of ambient lighting conditions [2, 16]. Moreover, LiDAR maintains consistent geometric accuracy across varying environmental conditions, which overcomes camera-based systems that suffer from performance degradation under low-light, glare, or adverse weather conditions [17, 18]. Having this sensor as infrastructure-mounted offers a fixed, elevated point that eliminates ego-motion compensation requirements and provides wider scene coverage compared to vehicle-mounted sensors [12, 13].
Despite these advantages, a fundamental challenge for learning-based collision detection is the lack of real accident data from LiDAR sensors. Traffic collisions are usually rare events, and the vast majority of autonomous driving datasets capture only normal, uneventful driving scenarios [14, 19]. Existing large-scale datasets such as nuScenes [20], KITTI [21], and Waymo Open Dataset [22] contain extensive recordings of typical traffic but lack annotated collision events. This data imbalance severely limits what supervised neural networks can realistically learn about pre-collision dynamics [23, 24]. Synthetic datasets generated from simulation environments such as CARLA offer a partial solution by enabling controlled generation of accident scenarios [19, 25], but the domain gap between simulated and real-world data is a concern for deployment [26].
Given these constraints, physics-based collision detection approaches that operate directly from kinematic principles represent a practical alternative to data-driven methods [27, 28]. Such approaches rely on fundamental motion equations to predict future trajectories and assess collision risk without requiring labeled crash data for training. They can facilitate validation and debugging, which is important for safety-critical transportation applications [29]. Accordingly, this paper presents a comprehensive framework for real-time collision detection from an infrastructure LiDAR perspective. The proposed system processes raw point cloud data through a pipeline of ground removal, clustering, tracking, and trajectory prediction. Then, it is followed by a geometric collision detection module that identifies potential conflicts through three complementary methods: parametric path intersection analysis, corridor-based proximity detection, and bounding box penetration testing. This approach avoids the reliance on learned collision patterns that enable it to be generalized across different intersection geometries and traffic scenarios while maintaining real-time performance suitable for practical deployment.
The main contributions of this work are: (1) a real-time collision detection framework for infrastructure LiDAR that fuses three complementary geometric criteria path intersection, corridor proximity, and bounding box penetration to cover distinct collision geometries rather than relying on a single test; (2) a systematic empirical characterization of the trade-off between prediction horizon and detection performance (precision/recall/F1) for physics-based trajectory prediction at intersections, evaluated on 50 real accident scenarios from DeepAccident with ground-truth collision labels; (3) unlike prior infrastructure LiDAR safety work such as Bhattarai et al. [30], which validates retrospectively against historical crash-frequency records, our framework targets real-time, per-event early-warning generation suitable for V2X broadcast, with measured end-to-end latency (97.4 ms) confirming real-time feasibility on standard hardware.
This paper is organized as follows: Section 2 presents the algorithm pipeline and the experimental evaluation methodologies. Section 3 introduces the results with a comprehensive discussion. Finally, Section 4 concludes the paper.
This section of the paper presents the applied methodologies, including the algorithmic pipeline and the conducted experiments.
2.1 Algorithm
The algorithm pipeline is displayed in Figure 1. The point cloud data obtained from infrastructure LiDAR are passed through several processing steps for accident detection. Specifically, the pipeline operates as a sequential, per-frame process at the 10 Hz LiDAR frame rate. Preprocessed point clouds (Section 2.1.1) are clustered into candidate objects with estimated bounding boxes (Section 2.1.2, Object Detection). These detections are then associated across frames by the tracking module (Section 2.1.3), which maintains persistent track identities and computes smoothed per-object velocities. The current position and smoothed velocity of each tracked object are passed to the trajectory prediction stage, which extrapolates future positions over the prediction horizon $\tau$ using the constant velocity model. The resulting predicted trajectories, together with the current object bounding boxes, are then passed to the collision decision module (Section 2.1.4), which applies the three geometric checks described below to generate collision warnings. Each stage consumes only the most recent output of the preceding stage, forming a closed detection → tracking → prediction → decision loop repeated every frame, as illustrated in Figure 1.
Figure 1. Block diagram of the proposed collision detection framework. The input LiDAR point cloud passes through several stages for collision detection, and in order to generate real-time warnings
2.1.1 Preprocessing
Raw point clouds contain substantial noise from static infrastructure and irrelevant points. Therefore, we applied two sequential operations: ground removal and background subtraction.
Ground removal applies height-based filtering to eliminate road surface points based on the known sensor mounting height [31, 32]. Points below the ground threshold are removed according to:
$\mathcal{P}_{filtered}=\left\{p_i \in \mathcal{P} \mid z_i>z_{ground}\right\}$ (1)
where, $z_{ground}$ is the ground plane height relative to the sensor frame, and $\mathcal{P}$ is the input point cloud, while $\mathcal{P}_{filtered}$ is the processed point cloud. Background subtraction relies on a learned reference model of the static environment to compare incoming points against it. A KD-tree spatial index [33] is constructed from a reference point cloud $\mathcal{P}_{ref}$ captured when the scene is empty. For each incoming point $p_i$, the nearest neighbor distance is computed:
$d_i=\min _{p_j \in \mathcal{P}_{\text {ref}}}\left\|p_i-p_j\right\|^2$ (2)
Points with $d_i>d_{threshold}$ are classified as dynamic, where is the background distance threshold. This approach efficiently isolates dynamic objects from static infrastructure such as buildings, signs, and parked vehicles.
2.1.2 Object detection
The filtered dynamic points are processed to identify and localize individual objects through clustering and bounding box estimation. The Density-Based Spatial Clustering of Applications with Noise (DBSCAN) algorithm [34, 35] groups nearby points into discrete objects without requiring a predefined number of clusters. A point is classified as a core point if it has at least $N_{min}$ neighbors within radius $\varepsilon$:
$\left|N_{\varepsilon}(p)\right| \geq N_{min}$ (3)
where,
$N_{\varepsilon}(p)=\left\{q \in \mathcal{P} \mid\|p-q\|_2 \leq \varepsilon\right\}$ (4)
For each detected cluster $C_k$, the centroid is computed as the mean position of all constituent points:
$C_k=\frac{1}{\left|C_k\right|} \sum_{p_i \in C_k} p_i$ (5)
Additionally, an axis-aligned bounding box ($b_k$) is computed for each cluster by computing the minimum and maximum coordinates:
$b_k=\left[\min _{p_i \in C_k}\left(x_i, y_i, z_i\right), \max _{p_i \in C_k}\left(x_i, y_i, z_i\right)\right]$ (6)
2.1.3 Object tracking
Detected objects are linked across frames using nearest-neighbor matching with a KD-tree for efficient spatial queries [36]. For each new detection, accordingly, the algorithm searches the centroids from the previous frame to find the closest match within a distance threshold. Matched centroids preserve the object identity, while unmatched detections initialize new tracks [37]. Track identity is preserved via greedy nearest-neighbor assignment: for each new detection, the closest track within $d_{track}$ (3.0 m) is matched if not already claimed by another detection in the same frame, preventing duplicate assignment. Unmatched tracks are retained for up to 5 consecutive missed frames (0.5 s at 10 Hz) before deletion, allowing brief occlusions without an ID switch; unmatched detections are assigned a new, incrementing track ID.
The object velocity is estimated based on consecutive centroid position differences over the known time interval:
$v(t)=\frac{p(t)-p(t-1)}{\Delta t}$ (7)
where, $p(t)$ is the object centroid at time $t$ and $\Delta t=0.1$ s (at 10 Hz frame rate).
To reduce noise sensitivity, exponential smoothing is applied [38]:
$\bar{v}(t)=\alpha \cdot v(t)+(1-\alpha) \cdot \bar{v}(t-1)$ (8)
where, α = 0.3 is the smoothing factor balancing responsiveness and stability. Future positions are extrapolated using the constant velocity model:
$\hat{p}(t+\tau)=p(t)+\bar{v}(t) \cdot \tau$ (9)
where, $p(t)$ is the current position, $\bar{v}(t)$ is the smoothed velocity, and $\tau$ represents the prediction horizon in seconds.
A constant velocity model was selected over higher-order alternatives (e.g., Kalman filtering, IMM, or learned motion models) to preserve the low per-frame latency required for real-time operation within the 100 ms budget imposed by the 10 Hz LiDAR frame rate (Section 3). This choice trades prediction accuracy for maneuvers involving acceleration, braking, or turning against computational simplicity, a trade-off examined empirically in Section 3.
2.1.4 Collision detection
For collision detection, we proposed an approach that analyzes the predicted trajectories of all tracked objects using three geometric checks:
Path Intersection: For each pair of objects (i, j), trajectory segments are modeled as parametric lines. A collision is predicted if the line segment from one object intersects with the line segment of another object within the prediction horizon. The intersection point is computed by solving:
$p_i(t)+s \cdot \bar{v}_i=p_j(t)+r \cdot \bar{v}_j$ (10)
where, s, r ∈ [0, $\tau$] are the time parameters. An intersection exists if both parameters fall within valid bounds.
Corridor Proximity: The minimum distance between two trajectory segments is computed to detect near-miss scenarios [39]:
$d_{min}(i, j)=\min _{s, r \in[0, \tau]}\left\|\hat{p}_i(t+s)-\hat{p}_j(t+r)\right\|^2$ (11)
A collision warning is issued if $d_{min}<d_{corridor}$, where $d_{corridor}$ is the safety corridor threshold.
Bounding Box Penetration: At each predicted time step, the axis-aligned bounding boxes of objects are tested for spatial overlap [40]. Two bounding boxes $\left(b_i\right)$ and $\left(b_j\right)$ overlap if and only if they intersect along all three axes.
A collision warning is generated when any of the three geometric checks indicates a potential collision within the prediction horizon $\tau$. The three checks are not independent votes requiring arbitration: path intersection and corridor proximity are evaluated jointly per trajectory-segment pair (corridor proximity is only tested if no direct geometric intersection is found), while bounding box penetration is evaluated independently against tracked object extents. A warning is issued whenever any check is satisfied for a given object pair (logical OR), and all warnings are treated as equally critical; no severity ranking or deduplication is applied across the three criteria, so a pair triggering multiple checks may generate more than one recorded warning for that pair. These warnings can be broadcast via V2X communication infrastructure to alert approaching vehicles and vulnerable road users [41]. Table 1 summarizes the key parameters used in the algorithm. The parameters in Table 1 were manually set based on sensor deployment geometry and domain knowledge (e.g., LiDAR mounting height, typical vehicle spacing and dimensions, 10 Hz frame rate) rather than a formal grid search or optimization procedure.
Table 1. Algorithm parameters
|
Parameter |
Symbol |
Value |
|
Ground height threshold |
$z_{ground}$ |
-2.5 m |
|
Background distance threshold |
$d_{thresh}$ |
0.3 m |
|
DBSCAN radius |
$\varepsilon$ |
1.5 m |
|
DBSCAN minimum points |
$N_{min}$ |
5 |
|
Tracking distance threshold |
$d_{track}$ |
3.0 m |
|
Velocity smoothing factor |
$\alpha$ |
0.3 |
|
Frame rate |
$1 / \Delta t$ |
10 Hz |
|
Corridor safety threshold |
$d_{corridor}$ |
2.0 m |
|
Prediction horizon |
$\tau$ |
1, 2, 3 s |
2.2 Experiment and evaluation
The proposed algorithm is implemented in ROS2 (Robot Operating System 2), which provides a robust framework. It has been widely used for AV development due to its real-time capabilities, modular architecture, multi-sensor support and communication [42-44]. While it is challenging to obtain real-world collision datasets due to the rarity of accidents and ethical constraints [45, 46], we evaluate the proposed system using the DeepAccident dataset [19]. This dataset has over 57,000 frames across 285 accident scenarios, including rear-end collisions, lateral collisions, and crossing-path conflicts. In this research, we randomly selected 50 recordings, each approximately 5 seconds in length, with a point cloud data frame rate of 10 Hz. DeepAccident includes, for each scenario, a dedicated roadside infrastructure agent equipped with a 32-channel LiDAR mounted at a randomized elevated height between 3 and 5 meters, in addition to four vehicle agents [19]. We use exclusively the infrastructure agent's LiDAR point cloud stream, which provides a fixed, elevated viewpoint consistent with real roadside LiDAR deployments, rather than data from any of the vehicle-mounted sensors. This ensures that the sensing geometry (mounting height, viewpoint, occlusion pattern) matches the intended real-world deployment scenario targeted by this work. The 50 recordings were selected via simple random sampling from the 285 available DeepAccident scenarios, without stratification by accident type, town, or weather, and are predominantly signalized four-way intersections. Each recording begins with normal traffic before the accident onset, so False Positives (FPs) are assessed against both normal-traffic and collision segments within the same recordings. The sampled recordings predominantly involve collisions between two vehicles, with a smaller number of scenarios involving a vehicle and a pedestrian; a formal breakdown by collision category or object count per scene was not logged. The system was visually evaluated based on the occurrence or potential occurrence of an accident using the following criteria:
1. True Positive (TP): A collision warning is issued, and an accident occurs in the recording.
2. FP: A collision warning is issued, but no accident occurs.
3. False Negative (FN): No collision warning is issued, but an accident occurs. Based on these definitions from the confusion matrix, we compute precision, recall, and F1-score, three widely adopted metrics for evaluating classification systems [47, 48].
Precision measures the proportion of issued collision warnings that correspond to actual accidents, quantifying the system’s ability to avoid false alarms [49]:
Precision $=\frac{T P}{T P+F P}$ (12)
In the context of collision warning systems, high precision indicates that when the system issues an alert, it is likely to be a genuine collision scenario. This is particularly important to prevent driver desensitization caused by frequent false warnings, which could lead to ignored alerts during actual emergencies [50].
Recall (also known as sensitivity or TP rate) measures the proportion of actual collision events that were correctly detected by the system [47, 51]:
Recall $=\frac{T P}{T P+F N}$ (13)
For safety-critical applications such as collision warning systems, high recall is essential as it reflects the system’s ability to detect all potential collision events. A missed detection (FN) in autonomous driving scenarios can have severe consequences, making recall a particularly important metric in this domain [52].
F1-score is the harmonic mean of precision and recall, providing a single metric that balances both concerns [51, 53]:
F1-score $=\frac{2 \times \text {Precision} \text {×} \text {Recall}}{\text {Precision}+ \text {Recall}}$ (14)
The harmonic mean is preferred over the arithmetic mean because it penalizes extreme values; a system with very high precision but low recall (or vice versa) will receive a lower F1-score than one with balanced performance [54]. The F1-score ranges from 0 to 1, where 1 indicates perfect precision and recall, and values closer to 1 indicate better overall classification performance. This metric is particularly valuable for evaluating collision detection systems where both FPs (unnecessary warnings) and FNs (missed collisions) carry significant consequences [55].
These metrics were obtained for three cases based on the predicted trajectory time horizon seconds (see Eq. (9)).
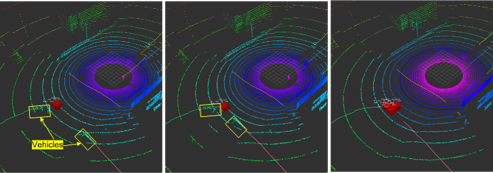
Detection samples of 3 frames sequenced in time are displayed in Figure 2. The figure shows the system's ability to identify the risk of potential collision occurrence at the marked red box. Table 2 presents the collision detection performance across three prediction horizons.
From the results, we clearly observe a trade-off between prediction horizon and detection performance. As the prediction horizon increases, recall improves from 0.80 at $\tau$ = 1 (s) to 0.90 at $\tau$ = 3 (s), indicating that longer horizons capture more collision events. However, this comes at the cost of precision, which decreases from 0.74 to 0.55, reflecting an increase in FPs.
Table 2. Collision detection performance by prediction horizon
|
$\tau$ (s) |
TP |
FP |
FN |
Precision |
Recall |
F1-Score |
|
1 |
37 |
13 |
9 |
0.74 |
0.80 |
0.77 |
|
2 |
40 |
17 |
5 |
0.70 |
0.89 |
0.78 |
|
3 |
44 |
36 |
5 |
0.55
|
0.90
|
0.68
|
The 1-second prediction horizon achieves the highest precision (0.74) with a recall of 0.80, resulting in an F1-score of 0.77. This configuration minimizes false alarms but may miss some collisions due to the limited prediction window, as evidenced by 9 FNs.
The 2-second horizon provides balanced performance with precision of 0.70, recall of 0.89, and the highest F1-score of 0.78. The improved recall (from 0.80 to 0.89) indicates better collision detection capability while maintaining acceptable precision. This horizon reduces FNs from 9 to 5, demonstrating improved sensitivity to impending collisions. Manual inspection of the 17 FPs at the 2-second horizon shows they arise mainly from two sources: intermittent misdetections/track noise causing spurious velocity estimates, and vehicles passing in close proximity without an actual collision, which the geometric checks flag as conflicts. The 5 FNs largely correspond to cases where the conflict only became geometrically apparent within the final portion of the prediction window. These patterns indicate the false-positive rate could be reduced by improved detection/tracking robustness and tighter corridor thresholds, without necessarily sacrificing recall. In addition to precision, recall, and F1-score, we performed an approximate manual review of warning timing relative to collision onset: across the reviewed scenarios, warnings were generally issued within roughly one second before or after the collision frame. This coarse estimate is not derived from systematic per-event timestamp logging; a precise, log-based measurement of warning lead time, detection delay, and false alarm rate (e.g., per unit of normal-traffic exposure) is left for future work.
The 3-second horizon (s) achieved the highest recall (0.90) but suffers from significantly degraded precision (0.55) due to 36 FPs compared to 13 and 17 for the shorter horizons. The F1-score drops to 0.68, indicating that the constant velocity assumption in trajectory prediction becomes unreliable over extended time periods, particularly for scenarios involving vehicle maneuvers such as turning, braking, or acceleration. This degradation directly reflects the constant velocity model's core limitation: it cannot anticipate deceleration, acceleration, or curvature changes, causing predicted positions to diverge from true trajectories as the horizon lengthens. More expressive models (e.g., Kalman filtering with maneuver detection, or learned predictors) could reduce this error but introduce additional per-frame computation; evaluating this accuracy-latency trade-off against such models is left for future work.
Based on these findings, the 2-second prediction horizon offers the favorable balance between early warning capability and prediction reliability for infrastructure-based collision detection systems.
To assess the real-time feasibility of the proposed framework, per-stage processing latency was measured on a consumer laptop (Intel Core i5 processor) across representative frames from the test dataset, using wall-clock timing instrumented at the entry and exit of each processing stage. As summarized in Table 3, data preprocessing and object detection require 84.6 ms on average (median: 82.7 ms), while object tracking and collision checking require 12.8 ms on average (median: 10.1 ms). The end-to-end pipeline latency averages 97.4 ms, comfortably within the 100 ms real-time budget imposed by the 10 Hz LiDAR frame rate used in this deployment, indicating the algorithm's feasibility for real-time operation on standard computing hardware. Deployment on embedded or edge-class hardware would require further evaluation and is left as future work.
Table 3. Computational time per frame with 10 fps point cloud
|
Process |
Mean (ms) |
Median (ms) |
|
Data preprocessing and object detection |
84.6 |
82.7 |
|
Object tracking and collision check |
12.8 |
10.1 |
|
End-to-end pipeline |
97.4 |
-- |
In comparison to the state of the art, the deep learning-based accident anticipation methods have achieved high average precision on ego-centric dashcam datasets [56, 57].
However, these approaches address a different problem setting and are not directly comparable to our infrastructure-based framework. The most closely related infrastructure-based work is by Bhattarai et al. [30], who developed a methodology for detecting rear-end conflicts at signalized intersections using roadside LiDAR sensors. The researchers combine three surrogate safety indices, Modified Time-to-Collision (MTTC), Safety Deceleration Index (SDI), and Conflict Severity Index (CSI) to determine a Rear-End Conflict Index (RECI). They validated their method by correlating identified conflicts with historical crash records using regression models. However, they focus on conflict identification and aggregate crash frequency prediction, whereas our work addresses real-time collision prediction with explicit detection performance metrics (precision, recall, F1-score). Secondly, our approach has configurable prediction horizons (s), which provide actionable early warnings, whereas their RECI framework is primarily designed for retrospective safety evaluation and intersection risk ranking. In this simulated evaluation, a 2-second prediction horizon achieves an F1-score of 0.78, suggesting a favorable balance between early warning capability and prediction reliability; whether this balance holds under real-world sensing conditions remains to be validated and complements the proactive safety analysis framework established by Bhattarai et al. [30].
In this paper, we presented a real-time collision detection framework from an infrastructure-mounted LiDAR perspective for traffic safety at intersections. The system applies several point cloud processing, and the collision risk is assessed through path intersection, corridor-based proximity, and bounding box penetration methods. The system was evaluated based on 50 DeepAccident scenarios and showed that the 2-second prediction horizon provides a good balance, achieving precision of 0.70, recall of 0.89, and F1-score of 0.78. Based on this simulated evaluation, this physics-based approach appears to be a promising alternative to learning-based methods, which struggle with the lack of real-world collision data; real-world validation is needed to confirm its practical effectiveness. While DeepAccident's infrastructure agent provides a geometrically realistic elevated LiDAR viewpoint, the underlying point clouds are simulator-generated and do not capture the full sensor noise characteristics, multipath effects, and environmental clutter present in real roadside LiDAR deployments; validation against real-world roadside LiDAR recordings is therefore an important next step before the reported performance figures can be generalized to physical deployments. The 50 evaluated recordings were also randomly sampled without stratification across accident types, towns, or weather conditions; evaluation on a larger, stratified sample is needed to confirm generalizability, and did not track collision category (vehicle-vehicle vs. vehicle-pedestrian) or object counts per scene in detail. Future work will explore advanced motion models such as Kalman filtering and intention prediction, along with V2X [58] integration, real-world deployment validation, and systematic quantification of warning lead time, detection delay, and false alarm rate.
[1] World Health Organization. (2023). Global status report on road safety 2023. https://www.who.int/teams/social-determinants-of-health/safety-and-mobility/global-status-report-on-road-safety-2023.
[2] Pallikonda, A.K., Bandarapalli, V.K., Aruna, V. (2025). Enhancing performance and reducing latency in autonomous systems through edge computing for real-time data processing. Mechatronics and Intelligent Transportation Systems, 4(3): 154-165. https://doi.org/10.56578/mits040305
[3] Beck, J., Arvin, R., Lee, S., Khattak, A., Chakraborty, S. (2023). Automated vehicle data pipeline for accident reconstruction: New insights from LiDAR, camera, and radar data. Accident Analysis & Prevention, 180: 106923. https://doi.org/10.1016/j.aap.2022.106923
[4] Fernandes, B., Alam, M., Gomes, V., Ferreira, J., Oliveira, A. (2016). Automatic accident detection with multi-modal alert system implementation for ITS. Vehicular Communications, 3: 1-11. https://doi.org/10.1016/j.vehcom.2015.11.001
[5] Ranka, S., Rangarajan, A., Elefteriadou, L., Srinivasan, S., Poasadas, E., Hoffman, D. (2020). A vision of smart traffic infrastructure for traditional, connected, and autonomous vehicles. In 2020 International Conference on Connected and Autonomous Driving (MetroCAD), Detroit, MI, USA, pp. 1-8. https://doi.org/10.1109/MetroCAD48866.2020.00008
[6] Ghahremannezhad, H., Shi, H., Liu, C.J. (2022). Real-time accident detection in traffic surveillance using deep learning. In 2022 IEEE International Conference on Imaging Systems and Techniques (IST), Kaohsiung, Taiwan, pp. 1-6. https://doi.org/10.1109/IST55454.2022.9827736
[7] Tsukada, M., Oi, T., Kitazawa, M., Esaki, H. (2020). Networked roadside perception units for autonomous driving. Sensors, 20(18): 5320. https://doi.org/10.3390/s20185320
[8] Ansariyar, A., Jeihani, M. (2024). Investigating LiDAR sensor accuracy for V2V and V2P conflict detection at signalized intersections. Future Transportation, 4(3): 834-855. https://doi.org/10.3390/futuretransp4030040
[9] Mo, Y.H., Vijay, R., Rufus, R., de Boer, N., Kim, J., Yu, M. (2024). Enhanced perception for autonomous vehicles at obstructed intersections: An implementation of vehicle to infrastructure (V2I) collaboration. Sensors, 24(3): 936. https://doi.org/10.3390/s24030936
[10] Namazi, E., Li, J., Lu, C. (2019). Intelligent intersection management systems considering autonomous vehicles: A systematic literature review. IEEE Access, 7: 91946-91965. https://doi.org/10.1109/ACCESS.2019.2927898
[11] Xiang, H., Zheng, Z.L., Xia, X., et al. (2024). V2X-Real: A large-scale dataset for vehicle-to-everything cooperative perception. In Computer Vision-ECCV 2024, pp. 455-470. https://doi.org/10.1007/978-3-031-72943-0_26
[12] Yu, H.B., Luo, Y.Z., Shu, M., et al. (2022). DAIR-V2X: A large-scale dataset for vehicle-infrastructure cooperative 3D object detection. In Proceedings of the IEEE/CVF Conference on Computer Vision and Pattern Recognition (CVPR), pp. 21361-21370. https://openaccess.thecvf.com/content/CVPR2022/html/Yu_DAIR-V2X_A_Large-Scale_Dataset_for_Vehicle-Infrastructure_Cooperative_3D_Object_Detection_CVPR_2022_paper.html.
[13] Zimmer, W., Wardana, G.A., Sritharan, S., Zhou, X.C., Song, R., Knoll, A.C. (2024). TUMTraf V2X cooperative perception dataset. In Proceedings of the IEEE/CVF Conference on Computer Vision and Pattern Recognition (CVPR), pp. 22668-22677. https://openaccess.thecvf.com/content/CVPR2024/html/Zimmer_TUMTraf_V2X_Cooperative_Perception_Dataset_CVPR_2024_paper.html.
[14] Zimmer, W., Greer, R., Zhou, X.C., et al. (2025). Safety-critical learning for long-tail events: The TUM traffic accident dataset. arXiv preprint arXiv:2508.14567. https://doi.org/10.48550/arXiv.2508.14567
[15] Zhang, Y.L., Hu, R.Q. (2004). Development of an automated accident detection system at intersections. In Applications of Advanced Technologies in Transportation Engineering, pp. 153-157. https://doi.org/10.1061/40730(144)29
[16] Li, Y., Ma, L.F., Zhong, Z.L., Liu, F., Chapman, M.A., Cao, D.P. (2020). Deep learning for LiDAR point clouds in autonomous driving: A review. IEEE Transactions on Neural Networks and Learning Systems, 32(8): 3412-3432. https://doi.org/10.1109/TNNLS.2020.3015992
[17] Liu, H.B., Wu, C., Wang, H.J. (2023). Real time object detection using LiDAR and camera fusion for autonomous driving. Scientific Reports, 13(1): 8056. https://doi.org/10.1038/s41598-023-35170-z
[18] Arnold, E., Al-Jarrah, O.Y., Dianati, M., Fallah, S., Oxtoby, D., Mouzakitis, A. (2019). A survey on 3D object detection methods for autonomous driving applications. IEEE Transactions on Intelligent Transportation Systems, 20: 3782-3795. https://doi.org/10.1109/TITS.2019.2892405
[19] Wang, T.Q., Kim, S., Ji, W.X., et al. (2024). DeepAccident: A motion and accident prediction benchmark for V2X autonomous driving. In Proceedings of the AAAI Conference on Artificial Intelligence, 38: 5599-5606. https://doi.org/10.1609/aaai.v38i6.28370
[20] Caesar, H., Bankiti, V., Lang, A.H., Vora, S., Liong, V.E., Xu, Q. (2020). nuScenes: A multimodal dataset for autonomous driving. In 2020 IEEE/CVF Conference on Computer Vision and Pattern Recognition (CVPR), Seattle, WA, USA, pp. 11618-11628. https://doi.org/10.1109/CVPR42600.2020.01164
[21] Geiger, A., Lenz, P., Urtasun, R. (2012). Are we ready for autonomous driving? The KITTI vision benchmark suite. In Proceedings of the IEEE Conference on Computer Vision and Pattern Recognition (CVPR), RI, USA, pp. 3354-3361. https://doi.org/10.1109/CVPR.2012.6248074
[22] Sun, P., Kretzschmar, H., Dotiwalla, X., Chouard, A., Patnaik, V., Tsui, P. (2020). Scalability in perception for autonomous driving: Waymo open dataset. In Proceedings of the IEEE/CVF Conference on Computer Vision and Pattern Recognition (CVPR), Seattle, WA, USA, pp. 2443-2451. https://doi.org/10.1109/CVPR42600.2020.00252
[23] Pour, H.H., Li, F., Wegmeth, L., et al. (2022). A machine learning framework for automated accident detection based on multimodal sensors in cars. Sensors, 22(10): 3634. https://doi.org/10.3390/s22103634
[24] Kodepogu, K., Manjeti, V.B., Siriki, A.B. (2023). Machine learning for road accident severity prediction. Mechatronics and Intelligent Transportation Systems, 2(4): 211-226. https://doi.org/10.56578/mits020403
[25] Dosovitskiy, A., Ros, G., Codevilla, F., Lopez, A., Koltun, V. (2017). CARLA: An open urban driving simulator. In Proceedings of the 1st Annual Conference on Robot Learning, PMLR, pp. 1-16. https://proceedings.mlr.press/v78/dosovitskiy17a.html.
[26] Yue, X.Y., Wu, B.C., Seshia, S.A., Keutzer, K., Sangiovanni-Vincentelli, A.L. (2018). A LiDAR point cloud generator: From a virtual world to autonomous driving. In Proceedings of the ACM International Conference on Multimedia Retrieval, pp. 458-464. https://doi.org/10.1145/3206025.3206080
[27] Lefèvre, S., Vasquez, D., Laugier, C. (2014). A survey on motion prediction and risk assessment for intelligent vehicles. ROBOMECH Journal, 1(1): 1-14. https://doi.org/10.1186/s40648-014-0001-z
[28] Ammoun, S., Nashashibi, F. (2009). Real time trajectory prediction for collision risk estimation between vehicles. In 2009 IEEE 5th International Conference on Intelligent Computer Communication and Processing, Cluj-Napoca, Romania, pp. 417-422. https://doi.org/10.1109/ICCP.2009.5284727
[29] Shalev-Shwartz, S., Shammah, S., Shashua, A. (2017). On a formal model of safe and scalable self-driving cars. arXiv preprint arXiv:1708.06374. https://doi.org/10.48550/arXiv.1708.06374
[30] Bhattarai, N., Zhang, Y.B., Liu, H.C., Pakzad, Y., Xu, H. (2024). Proactive safety analysis using roadside LiDAR based vehicle trajectory data: A study of rear-end crashes. Transportation Research Record, 2678(3): 772-785. https://doi.org/10.1177/0361198123118270
[31] Himmelsbach, M., Hundelshausen, F.V., Wuensche, H.J. (2010). Fast segmentation of 3D point clouds for ground vehicles. In 2010 IEEE Intelligent Vehicles Symposium, La Jolla, CA, USA, pp. 560-565. https://doi.org/10.1109/IVS.2010.5548059
[32] Bogoslavskyi, I., Stachniss, C. (2016). Fast range image-based segmentation of sparse 3D laser scans for online operation. In 2016 IEEE/RSJ International Conference on Intelligent Robots and Systems (IROS), Daejeon, Korea (South), pp. 163-169. https://doi.org/10.1109/IROS.2016.7759050
[33] Bentley, J.L. (1975). Multidimensional binary search trees used for associative searching. Communications of the ACM, 18: 509-517. https://doi.org/10.1145/361002.361007
[34] Ester, M., Kriegel, H.P., Sander, J., Xu, X.W. (1996). A density-based algorithm for discovering clusters in large spatial databases with noise. In Proceedings of the 2nd International Conference on Knowledge Discovery and Data Mining (KDD), pp. 226-231.
[35] Ahmed, S.M., Chew, C.M. (2020). Density-based clustering for 3D object detection in point clouds. In 2020 IEEE/CVF Conference on Computer Vision and Pattern Recognition (CVPR), Seattle, WA, USA, pp. 10605-10614. https://doi.org/10.1109/CVPR42600.2020.01062
[36] Weng, X., Kitani, K. (2019). A baseline for 3D multi-object tracking. arXiv preprint arXiv:1907.03961. https://doi.org/10.48550/arXiv.1907.03961
[37] Chiu, H.K., Prioletti, A., Li, J., Bohg, J. (2020). Probabilistic 3D multi-object tracking for autonomous driving. arXiv preprint arXiv:2001.05673. https://doi.org/10.48550/arXiv.2001.05673
[38] Holt, C.C. (2004). Forecasting seasonals and trends by exponentially weighted moving averages. International Journal of Forecasting, 20(1): 5-10. https://doi.org/10.1016/j.ijforecast.2003.09.015
[39] Althoff, M., Dolan, J.M. (2014). Online verification of automated road vehicles using reachability analysis. IEEE Transactions on Robotics, 30: 903-918. https://doi.org/10.1109/TRO.2014.2312453
[40] Jiménez, P., Thomas, F., Torras, C. (2001). 3D collision detection: A survey. Computers & Graphics, 25(2): 269-285. https://doi.org/10.1016/S0097-8493(00)00130-8
[41] Kenney, J.B. (2011). Dedicated short-range communications (DSRC) standards in the United States. Proceedings of the IEEE, 99: 1162-1182. https://doi.org/10.1109/JPROC.2011.2132790
[42] Macenski, S., Foote, T., Gerkey, B., Lalancette, C., Woodall, W. (2022). Robot operating system 2: Design, architecture, and uses in the wild. Science Robotics, 7(66): eabm6074. https://doi.org/10.1126/scirobotics.abm6074
[43] Quigley, M., Conley, K., Gerkey, B., et al. (2009). ROS: An open-source robot operating system. In ICRA Workshop on Open Source Software, 3: 5. http://lars.mec.ua.pt/public/LAR%20Projects/BinPicking/2016_RodrigoSalgueiro/LIB/ROS/icraoss09-ROS.pdf.
[44] Reke, M., Peter, D., Schulte-Tigges, J., et al. (2020). A self-driving car architecture in ROS2. In 2020 International SAUPEC/RobMech/PRASA Conference, Cape Town, South Africa, pp. 1-6. https://doi.org/10.1109/SAUPEC/RobMech/PRASA48453.2020.9041020
[45] Wang, Z., Lan, S.Y., Sun, X.L., Chang, N., Li, Z.X., Yu, Z.D. (2025). Enhancing autonomous driving safety with collision scenario integration. In 2025 IEEE/RSJ International Conference on Intelligent Robots and Systems (IROS), Hangzhou, China, pp. 10116-10123. https://doi.org/10.1109/IROS60139.2025.11246713
[46] Zhang, X.W., Zhang, Q., Han, L.F., Qu, Q., Chen, X.M., Cai, W.D. (2025). Accidentsim: Generating physically realistic vehicle collision videos from real-world accident reports. arXiv preprint arXiv:2503.20654. https://doi.org/10.48550/arXiv.2503.20654
[47] Powers, D.M.W. (2011). Evaluation: From precision, recall and F-measure to ROC, informedness, markedness and correlation. Journal of Machine Learning Technologies, 2(1): 37-63. https://doi.org/10.48550/arXiv.2010.16061
[48] Sokolova, M., Lapalme, G. (2009). A systematic analysis of performance measures for classification tasks. Information Processing & Management, 45(4): 427-437. https://doi.org/10.1016/j.ipm.2009.03.002
[49] Manning, C.D., Raghavan, P., Schütze, H. (2008). Introduction to Information Retrieval. Cambridge University Press, p. 506. https://doi.org/10.1017/CBO9780511809071
[50] Lee, J.D., McGehee, D.V., Brown, T.L., Reyes, M.L. (2002). Collision warning timing, driver distraction, and driver response to imminent rear-end collisions in a high-fidelity driving simulator. Human Factors, 44(2): 314-334. https://doi.org/10.1518/0018720024497844
[51] Van Rijsbergen, C.J. (1979). Information Retrieval (2nd ed.). London, Butterworth-Heinemann. https://shop.elsevier.com/books/information-retrieval/van-rijsbergen/978-0-408-70929-3.
[52] Feng, S., Yan, X.T., Sun, H.W., Feng, Y.H., Liu, H.X. (2021). Intelligent driving intelligence test for autonomous vehicles with naturalistic and adversarial environment. Nature Communications, 12(1): 748. https://doi.org/10.1038/s41467-021-21007-8
[53] Sasaki, Y. (2007). The truth of the F-measure. Teach Tutor Materials, 1(5): 1-5. https://www.researchgate.net/publication/268185911_The_truth_of_the_F-measure.
[54] Christen, P., Hand, D.J., Kirielle, N. (2023). A review of the F-measure: Its history, properties, criticism, and alternatives. ACM Computing Surveys, 56(3): 1-24. https://doi.org/10.1145/3606367
[55] Chicco, D., Jurman, G. (2020). The advantages of the Matthews correlation coefficient (MCC) over F1 score and accuracy in binary classification evaluation. BMC Genomics, 21(6): 1-13. https://doi.org/10.1186/s12864-019-6413-7
[56] Bao, W.T., Yu, Q., Kong, Y. (2020). Uncertainty-based traffic accident anticipation with spatio-temporal relational learning. In Proceedings of the 28th ACM International Conference on Multimedia (MM '20). Association for Computing Machinery, New York, NY, USA, pp. 2682-2690. https://doi.org/10.1145/3394171.3413827
[57] Chan, F.H., Chen, Y.T., Xiang, Y., Sun, M. (2016). Anticipating accidents in dashcam videos. In13th Asian Conference on Computer Vision (ACCV 2016), Taipei, Taiwan, pp. 136-153. https://doi.org/10.1007/978-3-319-54190-7_9
[58] Cinque, E., Valentini, F., Persia, A., Chiocchio, S., Santucci, F., Pratesi, M. (2020). V2X communication technologies and service requirements for connected and autonomous driving. In 2020 AEIT International Conference of Electrical and Electronic Technologies for Automotive (AEIT AUTOMOTIVE), Turin, Italy, pp. 1-6. https://doi.org/10.23919/AEITAUTOMOTIVE50086.2020.9307388