Luqman Assafat* | Herman Dwi Surjono | Fatchul Arifin | Rizky Dwi Wicaksono | Aris Kiswanto | Mochamad Subchan Mauludin | Singgih Dwi Prasetyo
© 2026 The authors. This article is published by IIETA and is licensed under the CC BY 4.0 license (http://creativecommons.org/licenses/by/4.0/).
OPEN ACCESS
This study proposes a non-intrusive method for estimating Total Harmonic Distortion (THD) in electrical systems using thermal infrared images of components in low-voltage distribution networks. Conventional THD measurement requires direct electrical access, which poses safety and practicality challenges; thus, a contactless alternative based on thermal signatures offers significant operational advantages. A real-world dataset consisting of 189 thermal images was collected from three locations: NRC (84 images), RS_Roemani (57 images), and GKB2 (48 images). Each image was labeled with the corresponding THD percentage measured using a power quality analyzer. Three deep learning architectures, VGG16, ResNet50, and EfficientNetB1, were adapted as regression models via transfer learning, with their final layers reconfigured to output continuous THD values. All models were trained on 80% of the data and evaluated on the remaining 20% using standard regression metrics: Mean Absolute Error (MAE), Root Mean Square Error (RMSE), Mean Absolute Percentage Error (MAPE), and coefficient of determination (R²). Experimental results show that VGG16 outperforms the other models, achieving the lowest MAE (1.22%), RMSE (1.73%), and MAPE (16.63%), as well as the highest R² (0.38). Although EfficientNetB1 converges fastest and ResNet50 demonstrates stable training behavior, both show reduced effectiveness in capturing THD variability, particularly under high-THD operating conditions observed in the RS_Roemani dataset. Visual and quantitative analyses confirm that VGG16 best captures the physical relationship between thermal anomalies and harmonic distortion. This work demonstrates the feasibility of vision-based, non-intrusive THD monitoring. It establishes VGG16 as a promising backbone for non-intrusive THD estimation in power-quality monitoring applications across industrial and smart-grid environments.
thermal imaging, Total Harmonic Distortion, deep learning regression, VGG16, ResNet50, EfficientNetB1
Total Harmonic Distortion (THD) is a critical parameter for assessing electrical power quality, with significant implications for system performance and safety. Multiple studies confirm that high THD values can indeed cause equipment damage and system failures [1, 2]. Researchers have recognized the limitations of conventional intrusive measurement methods. They are developing innovative alternatives that propose using an extremely low-frequency magnetometer to estimate current THD non-invasively [3]. In contrast, Matas et al. [4] and Costa et al. [5] developed a method with low computational burden for online THD assessment. The widespread use of power electronic devices, including those deployed in renewable energy infrastructure [6], has increased concerns regarding harmonic distortion [7]. Similar power-quality and stability challenges have also been reported for renewable-energy-driven electrolyzers operating under weak-grid conditions [8]. Advanced, non-intrusive measurement techniques are crucial for maintaining grid stability and preventing potential system failures [9, 10].
Deep learning techniques can effectively predict THD using non-intrusive thermal infrared imaging, offering a promising alternative to direct electrical measurements. Multiple studies support this approach [11-14]. A time-driven Convolutional Neural Network (CNN) framework that extracts harmonic distortion images from 60 signal cycles, enabling 1-second appliance classification. Studies [15-17] demonstrated successful THD estimation using a specially designed CNN that processes images in three dimensions. Studies [18-21] further validated the connection between harmonics and thermal behavior, showing how harmonic distortions can increase hotspot temperatures by up to 46.4 ℃. The evidence suggests that deep learning can effectively transform thermal images into quantitative assessments of harmonic distortion without requiring direct electrical access to the system. However, despite these advances, most existing studies rely on electrical signal representations or classification-based formulations and do not address continuous THD estimation using thermal infrared imagery, which is the primary focus of this study.
CNNs have demonstrated significant potential for thermal image analysis, but current research predominantly focuses on classification rather than continuous-value prediction. Multiple studies have successfully applied CNNs to thermal imaging diagnostics, including these studies [22-24], which achieved 99.74% accuracy in solar panel fault classification, and these studies [25, 26], which developed a CNN approach with 98% accuracy in identifying photovoltaic system issues. However, the research question correctly identifies a critical gap: most existing studies use binary classification (normal vs defective), whereas predicting precise numerical THD values requires a more sophisticated regression methodology. Qureshi et al. [27] and Tang et al. [28] acknowledged the complexity of thermal image analysis, highlighting challenges like data scarcity and image quality. The call for comparative studies evaluating CNN architectures for THD percentage prediction remains an open and promising research opportunity.
CNNs have demonstrated strong potential for regression tasks using thermal infrared images, with extensive validation across electrical and energy system applications. Several studies in power quality analysis report highly accurate THD prediction results; for example, Panoiu et al. [29] achieved RMSE values below 0.01 and regression coefficients exceeding 0.99. However, such performances were obtained using direct electrical signal representations, which differ fundamentally from thermal image–based estimation, where the relationship between surface temperature distributions and harmonic distortion is indirect and influenced by environmental and operational factors. Other works have explored CNN-based approaches for related power system applications, including power quality disturbance classification using wavelet-based representations [30] thermal image classification of electrical transformer rooms via transfer learning [31] and regression-based thermal control in photovoltaic systems with high R² values [32]. Additional studies report strong performance of CNN architectures for infrared image analysis [33], optimized CNN regression models, hybrid CNN–LSTM frameworks for power prediction [34], and energy forecasting tasks [35-37]. Collectively, these studies confirm the suitability of CNN architectures for learning complex relationships in energy and thermal domains, while also highlighting that most existing works rely on signal-based inputs or classification-oriented formulations. This motivates the present study, which adapts and compares CNN architectures (EfficientNetB1, VGG16, and ResNet50) for continuous THD percentage regression using thermal infrared images, and evaluates them using Mean Absolute Error (MAE), Root Mean Square Error (RMSE), and coefficient of determination (R²) metrics.
This study aims to fill this gap by comparing the performance of three architectures, EfficientNetB1, VGG16, and ResNet50, in predicting THD percentage values based on thermal infrared images of electrical components in low-voltage distribution systems. All three models were trained as regressors to map thermal patterns to continuous THD values (in %). Model performance was evaluated using standard regression metrics, namely RMSE, MAE, and R². This study is framed as a feasibility investigation rather than as a replacement for high-precision measurements. The primary objective is to examine whether thermal infrared imaging combined with deep learning regression can provide meaningful estimates of THD trends under real-world operating conditions. By focusing on non-intrusive, contactless monitoring, this work aims to support early warning and condition-monitoring applications where direct electrical access is impractical or unsafe. a system that is safe, non-intrusive, and capable of providing timely quantitative THD estimates to support predictive maintenance in industrial, commercial, and smart grid environments.
Power quality monitoring, particularly THD assessment, has been extensively studied using signal-based and data-driven approaches. Conventional THD measurement techniques rely on direct electrical signal acquisition using power quality analyzers, which are accurate but intrusive, costly, and difficult to deploy continuously in complex electrical infrastructures.
Early THD assessment has shifted from traditional signal processing to machine learning, revealing both promising advances and persistent methodological challenges. Initial approaches using the Fast Fourier Transform (FFT) and wavelet transforms provided precise harmonic decomposition but were noise-sensitive and required direct electrical access. Machine learning methods such as Support Vector Machines (SVMs), Artificial Neural Networks (ANNs), and K-Nearest Neighbors (KNNs) were introduced to overcome these limitations. However, they primarily produced discrete classification labels rather than continuous THD values.
Deep learning approaches, particularly CNNs, have shown potential for learning complex harmonic-related patterns, with Bu et al. [38] noting that AI techniques often outperform traditional methods, especially under varying operating conditions. However, current methods still predominantly focus on disturbance identification rather than quantitative THD estimation, indicating significant room for methodological improvement to meet standard efficiency benchmarks [39].
Thermal infrared imaging has emerged as a powerful non-contact technique for electrical system monitoring, and deep learning has significantly enhanced its diagnostic capabilities. Multiple studies demonstrate its effectiveness in detecting electrical equipment anomalies [40]. Researchers have successfully applied CNNs to transformer fault diagnosis and electrical equipment condition assessment [41]. While traditional approaches relied on hotspot detection and threshold-based temperature analysis, deep learning enables more sophisticated analysis of thermal images. However, a critical limitation remains: most studies focus on fault detection and classification, without developing methods to estimate quantitative power quality indices. This suggests significant potential for future research in translating thermal imaging insights into precise, measurable electrical system performance metrics.
Existing research reveals a significant gap in the use of thermal infrared imagery for continuous THD estimation, with most current studies relying on intrusive electrical measurements or limited classification methods. The research highlights that while regression-based learning has been increasingly adopted for estimating physical quantities from visual data [42], thermal imaging in power systems has predominantly focused on detection and classification rather than numerical estimation. The proposed approach aims to bridge this gap by developing a deep learning regression framework that maps thermal patterns to THD percentages, enabling non-intrusive, vision-based power quality monitoring. This work therefore introduces a regression-based framework that leverages thermal infrared imagery for non-intrusive THD estimation, addressing the limitations of prior signal-based and classification-oriented approaches and potentially offering a more flexible, non-invasive monitoring solution [43].
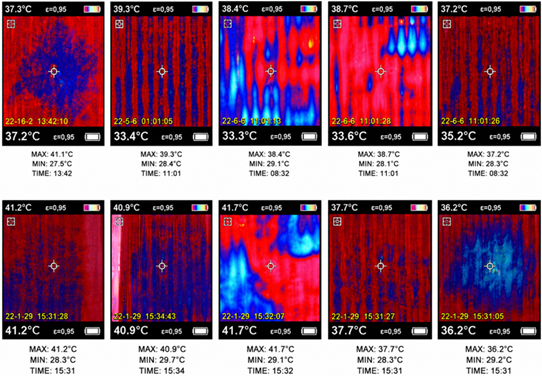
Collection of infrared thermal images taken from various locations for temperature distribution analysis and prediction of continuous current THD percentage values (%). Figure 1 displays a collection of thermal images captured from various locations and under different environmental conditions using an infrared camera. Each image illustrates surface-temperature variations in electrical components, with color gradients indicating heat intensity: red and orange indicate higher temperatures, while blue and purple indicate lower temperatures. This dataset serves as the foundation for research on estimating THD using thermal imaging. The dataset consists of 189 images collected from three distinct locations: 84 from NRC, 57 from RS_Roemani, and 48 from GKB2, ensuring diversity in thermal patterns and operational conditions. Each image is accompanied by metadata, including a timestamp, the maximum and minimum temperature values, and a crosshair marking the primary measurement area where the current THD was recorded. The three sites represent different operating environments and thermal characteristics, which contribute to variations in both temperature distribution and THD levels observed throughout the dataset. To provide a clearer overview of these site-specific characteristics, a statistical summary including the number of images, THD distribution, temperature distribution, and equipment categories for each location is presented in Section 4. After preprocessing to standardize resolution and normalize pixel values, the dataset was used for training and testing deep learning models, EfficientNetB1, VGG16, and ResNet50, to evaluate their ability to learn thermal patterns correlated with THD. This statistical information helps illustrate the dataset's diversity and supports the interpretation of differences in model performance across NRC, RS_Roemani, and GKB2 during the evaluation stage.
Figure 1. Dataset
Figure 2 illustrates the research methodology flowchart for estimating continuous THD values. The process begins with data collection and preparation, during which thermal images are obtained at various locations and under different environmental conditions to capture variations in temperature distribution related to electrical current characteristics. Each image is stored in an organized structure and labeled based on the measured current THD value. The THD labels were obtained using a power quality analyzer during field measurements, and each thermal image was associated with the corresponding THD reading recorded at the time of data acquisition. To ensure consistency between image data and electrical measurements, thermal image capture and THD recording were conducted within the same inspection session under identical operating conditions.
Figure 2. Flowchart of the Total Harmonic Distortion (THD) estimation process based on thermal images
Next, data loading and preprocessing are performed, including reading image and label files, resizing images to uniform dimensions, and normalizing pixel values to the range [0, 1] to meet the deep learning model's input assumptions. After preprocessing, all data are combined into a single main dataset, which is then divided into three parts: training, validation, and test data, with predetermined ratios to ensure generalization and objective evaluation.
This study implements an approach using three pre-trained architectures: VGG16, ResNet50, and EfficientNetB1. This methodology is supported by literature demonstrating the effectiveness of transfer learning in various image processing applications [44, 45]. The base layers of the pre-trained model are frozen, while the regression layers are replaced with fully connected layers tuned for THD value regression. The model is compiled using the Adam optimizer, a Mean Squared Error (MSE) based loss function, and an MAE evaluation metric. To improve the model's robustness to data variations, augmentation techniques such as rotation, horizontal mirroring, and spatial shifting are applied during training.
The training process uses two main callbacks: Early Stopping to prevent overfitting by stopping training when validation metric performance stops improving, and ReduceLROnPlateau to adaptively reduce the learning rate when training stagnates. Validation data is used to monitor model convergence during training. The THD measurements reflect actual operating conditions observed in the investigated low-voltage distribution systems, enabling the developed models to learn the relationship between thermal patterns and measured THD values in practical field environments. The relationship between thermal patterns and THD should, however, be interpreted with caution because multiple physical factors beyond harmonic distortion alone influence thermal distributions. Variations in load current, ambient temperature, cooling conditions, equipment aging, and installation characteristics may also affect surface temperature profiles captured by the infrared camera. Consequently, the developed models may learn combined thermal effects originating from both THD and other operating conditions present in the investigated electrical systems.
After training, the model is evaluated using several quantitative metrics. The formulas used in the evaluation are as follows:
Mean Absolute Error (MAE)
$M A E=\frac{1}{n} \sum_{i=1}^n\left|y_i-\hat{y}_i\right|$ (1)
Root Mean Square Error (RMSE)
$R M S E=\sqrt{\frac{1}{n} \sum_{i=1}^n\left(y_i-\hat{y}_i\right)^2}$ (2)
Mean Absolute Percentage Error (MAPE)
MAPE $=\frac{100}{n} \sum_{i=1}^n\left|\frac{y_i-\hat{y}_i}{y_i}\right|$ (3)
where, ${{y}_{i}}\ne 0$.
Coefficient of Determination (R²)
${{R}^{2}}=1-\frac{\mathop{\sum }_{i=1}^{n}{{({{y}_{i}}-{{{\hat{y}}}_{i}})}^{2}}}{\mathop{\sum }_{i=1}^{n}{{({{y}_{i}}-\overset{}{\mathop{y}}\,)}^{2}}}$ (4)
where, ${{y}_{i}}$ is the actual value, $\widehat{y}_i$ is the predicted value, $\bar{y}$ is the mean of the actual values, and $n$ is the total number of samples.
This evaluation approach is consistent with various previous studies. For example, studies [46-50] used a combination of MAE, RMSE, and R² to assess the performance of regression models for predicting energy consumption and power quality. Studies on THD also use similar metrics, as in these studies [51-53], which validates the use of MSE, MAE, and RMSE for harmonic current prediction.
The final stage of the methodology involves a comparative analysis of the three CNN architectures based on these evaluation metrics. The evaluation also includes a visualization of the comparison between actual and predicted THD values, as well as an analysis of the residual distribution to assess the model's reliability. This process aims to identify the best architecture for non-intrusive THD prediction based on thermal patterns in infrared images. Overall, this flowchart presents a systematic methodological framework integrating data processing, transfer-learning-based deep learning models, and quantitative evaluation for the development of a thermal-image-based power-quality monitoring system.
The model training process in this study began with data preprocessing, which involved resizing each thermal image to 224 × 224 pixels with 3 color channels (RGB). This size standardization was done to match the standard input format of pre-trained architectures such as VGG16, ResNet50, and EfficientNetB1. In addition, each pixel value was normalized by dividing it by 255.0 so that it was within the range [0, 1]. This normalization was intended to speed up convergence during training and prevent excessive gradients. The complete configuration of the preprocessing stage, model architecture, training strategy, and evaluation settings is summarized in Table 1. All thermal images were acquired using a thermal infrared camera under field operating conditions, with a consistent emissivity setting of 0.95 applied throughout data collection to ensure uniform temperature interpretation across all samples. The image acquisition procedure was conducted under naturally occurring environmental and loading conditions representative of the investigated electrical installations.
Table 1. Parameters
|
Category |
Parameters |
Value / Configuration |
|
Preprocessing |
Input Size |
224 × 224 × 3 (RGB) |
|
Normalization |
Pixel value / 255.0 → range [0, 1] |
|
|
Dataset splitting |
Train-Test Ratio |
80%: 20% |
|
Random State |
42 |
|
|
Model Architecture |
Pre-trained Backbone |
VGG16, ResNet50, EfficientNetB1 (ImageNet based) |
|
Freeze Layer |
The base layer is frozen; only the final regression layer is trained. |
|
|
Output Layer |
Dense (1) with linear activation (for THD value regression) |
|
|
Optimization & Loss |
Loss Function |
Mean Squared Error (MSE) |
|
Optimizer |
Adam (learning rate default) |
|
|
Regularization |
Dropout Rate |
0.5 (50%) |
|
L2 Regularization |
`l2(0.001)` in the `Dense` layer |
|
|
Training |
Batch Size |
32 |
|
Epoch Maksimum |
100 |
|
|
Early Stopping |
`monitor='val_loss'`,`patience=5`,`restore_best_weights=True` |
|
|
Evaluation |
Mean Absolute Error (MAE) |
|
|
Mean Absolute Percentage Error (MAPE) was calculated manually |
The dataset is then split into 80% for training and 20% for testing. This division is performed using a random state value of 42 to ensure consistent, reproducible results. The training data is used for model training, while the test data is used to objectively evaluate the model's performance. The train–test partition was performed via random sampling across the entire dataset, without explicit grouping by location, equipment type, or acquisition time. Consequently, images from the same site (NRC, RS_Roemani, or GKB2) may appear in both the training and test subsets. However, each image was treated as an independent observation with its corresponding THD label. This strategy was adopted to maximize the use of the available dataset; however, future studies should investigate location- or time-based data partitioning to assess model generalization in unseen operating environments further.
The model architecture used in this study uses ImageNet-pretrained models, namely VGG16, ResNet50, and EfficientNetB1. Pre-trained models were chosen because they have proven strong feature representations from training on millions of images. In this study, all base layers (base models) of each architecture were frozen, preventing their initial weights from being updated during training. Thus, only the added final regression layer was trained. This strategy aimed to avoid overfitting and to leverage the model's existing feature knowledge. The output layer used was Dense (1) with a linear activation function because this study focused on predicting continuous values (THD), so the model worked as a regression rather than a classification.
The training process used the MSE as the loss function. MSE was chosen because it can measure the squared difference between the predicted and actual values in a stable manner in regression settings. The optimizer used is Adam with a default learning rate, as it updates weights adaptively. To improve generalization, regularization techniques are applied: Dropout 0.5 in the final layer and L2 Regularization with a value of 0.001 in the Dense layer, both aimed at reducing model complexity and preventing overfitting. Although factors such as camera position, viewing angle, ambient conditions, and equipment loading can influence thermal image characteristics, the use of transfer learning and data augmentation was intended to improve model robustness against such variations encountered during practical measurements.
The training stage was carried out with a batch size of 32 and a maximum of 100 epochs. However, the training process was controlled using the Early Stopping mechanism with monitor = ‘val_loss’, patience = 5, and restore_best_weights = True. This means that training will automatically stop if there is no further improvement in performance on the validation data after five consecutive epochs, and the best weights from training will be restored. Model performance is evaluated using MAE, which measures the average difference between predicted and actual values. In addition, the MAPE is calculated manually to illustrate the magnitude of prediction errors as a percentage. These two metrics provide a more comprehensive picture of the model's accuracy in predicting THD values.
This section presents the evaluation results for models trained to predict THD (%) from infrared images. The evaluation was conducted using test data from three locations (GKB2, NRC, and RS_ROEMANI). In addition, a comparison of the performance between models with pre-trained VGG16, ResNet50, and EfficientNetB1 architectures is also discussed. Visualization of prediction results and error distribution is also included to provide a deeper understanding. To investigate the effectiveness of deep learning for THD estimation, future studies should also compare CNN-based approaches with conventional machine learning models, such as linear regression, random forests, and SVR, using handcrafted thermal features. Such comparisons would help determine whether the performance gains observed in deep learning models justify their additional computational complexity and feature-learning capability. Model performance was evaluated using several metrics: MAE, RMSE, R², and MAPE.
Table 2. Evaluation model
|
Model |
MAE |
RMSE |
R2 |
MAPE (%) |
|
VGG16 |
1.22 |
1.73 |
0.38 |
16.63 |
|
ResNet50 |
1.41 |
1.95 |
0.18 |
19.42 |
|
EfficientNetB1 |
1.59 |
2.25 |
0.04 |
21.57 |
Note: MAE = Mean Absolute Error, RMSE = Root Mean Square Error, MAPE = Mean Absolute Percentage Error, R2 = Coefficient of Determination.
Table 2 summarizes the regression performance of the three deep learning models in predicting current THD from thermal infrared images. Among the evaluated architectures, VGG16 achieves the best overall performance, yielding the lowest Mean Absolute Error (MAE = 1.22%), Root Mean Square Error (RMSE = 1.73%), and Mean Absolute Percentage Error (MAPE = 16.63%), along with the highest coefficient of determination (R² = 0.38). However, the present study focuses exclusively on transfer-learning-based CNN architectures. It does not include traditional regression baselines based on simple thermal descriptors, such as maximum temperature, average temperature, or hotspot characteristics. Therefore, the reported results should be interpreted as a comparative evaluation among deep learning architectures rather than as evidence that deep learning universally outperforms simpler predictive approaches.
While an R² of 0.38 indicates that the model explains only a moderate portion of the variance in THD values, the absolute error metrics remain within a practically acceptable range for non-intrusive power quality monitoring—especially considering the indirect physical relationship between surface thermal patterns and harmonic current distortion. In contrast, ResNet50 (R² = 0.18) and particularly EfficientNetB1 (R² = 0.04) exhibit substantially weaker explanatory power. The near-zero R² of EfficientNetB1 indicates limited sensitivity to THD variability, suggesting a tendency toward mean-centered predictions under this dataset. Notably, VGG16 consistently outperforms the other models across all error metrics, confirming its superior ability to capture meaningful correlations between thermal signatures and THD levels. Qualitative analyses in subsequent figures further support this advantage, showing that VGG16 maintains relatively stable prediction behavior across diverse operational environments (NRC, RS_Roemani, and GKB2), whereas ResNet50 and EfficientNetB1 show larger deviations—especially under high-THD conditions.
Figure 3. Visual analysis of VGG16 prediction samples
Figure 3 shows that each image displays the actual current THD value (Label), the model’s prediction (Pred), and the dataset origin. The value e = 0.95 represents the emissivity setting used during image capture, standardizes thermal contrast across measurements, and ensures consistent radiometric accuracy in infrared thermography. This fixed emissivity level enables reliable comparisons of temperature patterns across different locations and environmental conditions. The VGG16 model successfully predicted THD values, with varying degrees of accuracy depending on image characteristics and capture conditions. In images from the NRC dataset (label = 6.21, pred = 5.86; label = 6.65, pred = 6.01), the model shows relatively small prediction errors, indicating that the temperature distribution pattern in NRC images is quite representative and easily recognized by the model. In images from the RS_ROEMANI dataset (label = 12.57, pred = 8.09; label = 10.34, pred = 8.40), there was a greater deviation, likely due to higher thermal noise or more complex heat dissipation patterns. In images from the GKB2 dataset (label = 8.84, pred = 6.94; label = 6.51, pred = 6.06), the model provides predictions that are reasonably close to the actual values, although still with a noticeable margin of error. Overall, the VGG16 model demonstrates the ability to capture thermal patterns correlated with THD values. Still, its performance varies across datasets, highlighting the importance of diverse training data for improved generalization under real-world conditions.
Figure 4. Visual analysis of ResNet50 prediction samples
As shown in Figure 4, each image displays the actual current THD value (Label), the model’s prediction (Pred), and the dataset origin. The value e = 0.95 denotes the emissivity setting used during infrared imaging, a standardized parameter that ensures consistent radiometric accuracy across all measurements by accounting for surface heat emission properties. This fixed emissivity level enables a reliable comparison of thermal patterns across diverse environmental conditions. The ResNet50 model demonstrates relatively stable performance in predicting THD values under varying thermal conditions. For images from the NRC dataset (label = 8.60, pred = 7.44; label = 3.62, pred = 6.66), predictions are generally close to actual values, although underprediction is observed, particularly at lower THD levels. For images from the RS_ROEMANI dataset (label = 8.83, pred = 7.30; label = 14.66, pred = 7.52), significant deviations are observed, especially at high THD values (>10), suggesting that the ResNet50 architecture may not fully capture the complex thermal patterns at this location without further tuning. The largest prediction errors in this study are associated with samples with THD values above 10%, where the thermal characteristics appear more complex and less consistently represented in the training data. A dedicated error analysis for the THD > 10% subset would provide additional insight into the model’s behavior under severe harmonic distortion conditions and should be considered in future investigations. For the GKB2 dataset (label = 4.75, pred = 6.80; label = 5.53, pred = 6.54), the model tends to overpredict, indicating potential sensitivity to localized temperature variations that do not directly correlate with THD. Overall, ResNet50 shows a reasonable ability to capture the relationship between thermal distribution and THD, particularly in images with clear thermal contrast. The observed underestimation of high-THD samples by RS_ROEMANI suggests that the model tends to regress toward moderate THD values under extreme operating conditions, which may partially explain the reduced overall R². However, like other models, its performance varies across datasets, with the largest errors occurring in RS_ROEMANI, likely due to higher thermal noise or more extreme operational conditions.
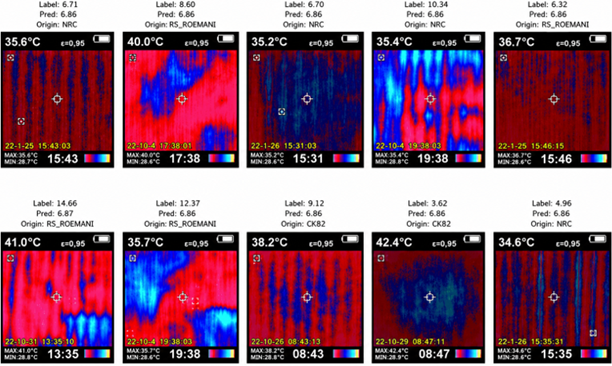
Figure 5 presents each image, which displays the actual current THD value (Label), the model’s prediction (Pred), and the dataset origin. The value e = 0.95 denotes the emissivity setting used during infrared imaging, which standardizes surface heat emission properties across all measurements. This fixed emissivity level ensures radiometric consistency and enables reliable comparison of thermal patterns under diverse environmental conditions. The EfficientNetB1 model produces stable, consistent predictions across the three architectures, particularly for images with moderate temperature variations. In the NRC dataset (label = 6.71, pred = 6.86; label = 6.32, pred = 6.86), the predictions are very close to the actual values, slightly overpredicting, indicating strong feature extraction capability. For the RS_ROEMANI dataset (label = 8.60, pred = 8.66; label = 10.34, pred = 6.87; label = 14.66, pred = 6.87), significant deviations occur at high THD levels (>10), consistent with other models, though accuracy remains good at moderate values (~8–9).
Figure 5. Visual analysis of EfficientNetB1 prediction samples
In the GKB2 dataset (label = 6.70, pred = 6.86; label = 9.12, pred = 6.86), the model tends to produce similar predictions across label values, suggesting limited sensitivity to extreme thermal gradients. Overall, EfficientNetB1 demonstrates stable training behavior and consistent predictions across varying thermal conditions; however, its regression capability is limited by underfitting, as reflected by its very low R² value. However, like other models, it struggles to accurately predict extreme THD values, highlighting a need for improved handling of outlier conditions. Figures 6-8 show the training and validation curves of the three models, VGG16, ResNet50, and EfficientNetB1. Each graph visualizes the dynamics of training and validation loss, and training and validation MAE, as indicators of the model's convergence, stability, and generalization.
Figure 6 shows two graphs depicting the dynamics of the VGG16 model over 20 epochs of training and validation, with changes in the loss function (MSE). Training and validation MAE show changes in the MAE values during training and validation. In the loss graph, the training loss decreases significantly from early epochs, indicating that the model successfully learned from the training data. The validation loss (orange) also decreases, albeit with minor fluctuations, indicating that the model generalizes to previously unseen data. At the 10th epoch, both curves begin to stabilize, and there is no drastic increase in validation loss, indicating that the model does not experience severe overfitting. MAE Graph Analysis: The training MAE (blue) decreases gradually, indicating an increase in the model's prediction accuracy on the training data. The validation MAE fluctuates but generally decreases, indicating that the model can predict THD values with a small MAE. There is no divergence between the training and validation MAEs, indicating the model remains stable and is not overly sensitive to noise in the validation data. Overall, the VGG16 model shows good convergence and stability during training. The loss and MAE curves, which decline consistently without significant divergence, indicate that the model has learned relevant patterns from the thermal images and does not experience significant overfitting.
Figure 7 shows two graphs depicting the dynamics of the ResNet50 model training over 20 epochs. Training and validation Loss show changes in the loss function (MSE) values during training and validation. Training and Validation MAE show changes in the MAE values during training and validation. Loss graph analysis. The training loss decreased significantly in the early epochs, then fluctuated moderately until epoch 20, indicating that the model continued to learn despite small variations in convergence. The validation loss value decreased steadily from the start of training and remained below the training loss after epoch 5, indicating that the model did not experience significant overfitting. At epoch 10, both curves begin to approach a stable point, with the validation loss indicating that the model has achieved a fairly good level of generalization.
The training MAE value decreases gradually but exhibits greater fluctuations than those of other models. This may be due to the complexity of the ResNet50 architecture, which has many residual layers. The validation MAE remains stable, indicating that the model can predict THD with a relatively low average absolute error. There is no divergence between the training and validation MAEs, indicating that the model maintains consistent learning patterns on the training data without sacrificing generalization. The ResNet50 model demonstrates strong learning capabilities and stability during training, despite higher fluctuations. Stable performance on validation loss and MAE indicates that the model generalizes well to new data.
Figure 6. Training and validation curves for the VGG16 model
Figure 7. Training and validation curves for the ResNet50 model
Figure 8. Training and validation curves for the EfficientNetB1 model
Figure 8 shows two graphs illustrating the training dynamics of the EfficientNetB1 model over 20 epochs. Training and Validation Loss show changes in the loss function (MSE) values during training and validation. Training and Validation MAE show changes in the MAE values during training and validation. The training loss value drops dramatically in the early epochs, indicating that the model learns very quickly from the training data. The validation loss value also decreases sharply and remains below the training loss after the 3rd epoch, indicating that the model has good generalization capabilities from the start of training. There is no divergence between the training and validation losses, indicating the model does not overfit, even though convergence is very fast. The training MAE decreases significantly in the final epoch, indicating that the model can predict THD values with a fairly low MAE. The validation MAE value decreases more quickly and is stable, even lower than the training MAE at some points, indicating that the model not only learns from the training data but also captures relevant general patterns. Minimal fluctuations in the validation MAE indicate high stability in predictions. The EfficientNetB1 model showed the fastest convergence among the three architectures tested, with stable performance and no overfitting. Its stable but underfitting ability is demonstrated by the validation loss and MAE, which remained low and stable throughout training. This characteristic makes EfficientNetB1 suitable for rapid convergence scenarios; however, its limited sensitivity to THD variability suggests that further architectural adaptation or feature enhancement is required for accurate regression-based THD estimation, especially if convergence speed and stability are priorities. It can be concluded that the transfer learning approach with the VGG16 architecture outperforms other models in predicting THD values from infrared images, both in quantitative accuracy and in the consistency of prediction behavior. Although EfficientNetB1 showed the fastest convergence and high training stability, and ResNet50 maintained good generalization without signs of overfitting, both failed to achieve the same level of accuracy as VGG16. This is evident from the lowest MAE, RMSE, and MAPE values and the highest R² achieved by VGG16, indicating that this architecture is better able to capture the complex relationship between temperature distribution in thermal images and the level of harmonic distortion in current. Visual analysis of prediction samples from the three datasets, NRC, RS_ROEMANI, and GKB2, confirms that model performance is strongly influenced by environmental characteristics and image thermal quality, with VGG16 being the most consistent at predicting THD values across varying conditions. However, it still shows deviations at extreme values. Meanwhile, the less satisfactory performance of ResNet50 and EfficientNetB1, especially on the RS_ROEMANI dataset, shows that a more complex architecture does not always lead to better performance in this context, and that the correlation between thermal patterns and electrical phenomena may not be fully captured by residual layers or efficiency-based compression. In terms of training dynamics, all models showed stable convergence without overfitting, but only VGG16 translated this stability into the most accurate test-time predictions. These findings confirm that, in the application of THD prediction based on thermal images, the choice of architecture should not be based solely on complexity or convergence speed, but on the ability to capture the physical meaning of temperature patterns relevant to electrical disturbances.
This study demonstrates that VGG16, when adapted via transfer learning for regression, achieves superior performance in estimating THD percentages from thermal infrared images compared to ResNet50 and EfficientNetB1. Among the three architectures, VGG16 yields the lowest prediction errors (MAE: 1.22%, MAPE: 16.63%) and the highest coefficient of determination (R² = 0.38), indicating better alignment between predicted and actual THD values. However, the obtained R² value remains relatively modest, suggesting that a substantial portion of THD variability remains unexplained by the model's thermal-image features. Therefore, the results should be interpreted as evidence of feasibility rather than as a demonstration of highly accurate quantitative THD prediction. Although EfficientNetB1 exhibits faster convergence and ResNet50 maintains training stability, both models show reduced generalization capability—particularly on high-THD samples from the RS_Roemani site—where prediction deviations are more pronounced. All models remain stable during training with no signs of overfitting; however, only VGG16 consistently translates learned thermal patterns into quantitatively reliable THD estimates across diverse real-world conditions. Furthermore, the observed prediction errors at elevated THD levels indicate that the relationship between thermal signatures and THD remains complex and cannot yet be captured comprehensively by the current dataset and model configuration. These findings highlight the need for additional validation across broader operating conditions and wider ranges of THD variation.
These results suggest that, for non-intrusive power quality monitoring based on thermal imaging, architectural suitability to the underlying physical phenomena may outweigh advantages in computational efficiency or modern design. Despite the moderate R² values obtained, the experimental results confirm the feasibility of estimating THD trends using thermal infrared images and deep learning regression. The proposed approach is not intended to replace conventional power quality measurement instruments, but rather to complement them with a non-intrusive, contactless monitoring solution. The findings indicate that thermal-image-based regression can provide useful trend information and preliminary assessments of THD behavior. However, further improvements in dataset diversity, measurement standardization, and model architecture are required before deployment in precision monitoring applications. Accordingly, this work should be regarded as an early feasibility study exploring the potential of thermal imaging and deep learning for non-intrusive THD estimation, rather than a mature industrial solution ready for operational deployment. More comprehensive datasets, standardized acquisition procedures, and advanced regression architectures will be necessary before the proposed approach can be considered for large-scale industrial implementation. This feasibility study demonstrates the potential of thermal-based vision systems for preliminary power-quality assessment and early estimation of harmonic distortion in industrial and smart-grid environments. Future work will focus on expanding the dataset, incorporating attention mechanisms, and improving robustness under extreme THD operating conditions to further evaluate the generalizability and practical applicability of the proposed approach.
The authors would like to express their deepest gratitude to the Institute of Research and Community Service (LP2M) Universitas Muhammadiyah Semarang (Unimus) for the financial support and funding of this research under Contract Number: 0142/Unimus.L/PG/PJ.INat/2024.
|
THD |
Total Harmonic Distortion |
|
CNN |
Convolutional Neural Network |
|
AI |
Artificial Intelligence |
|
ANN |
Artificial Neural Network |
|
SVM |
Support Vector Machine |
|
KNN |
K-Nearest Neighbors |
|
FFT |
Fast Fourier Transform |
|
NILM |
Non-Intrusive Load Monitoring |
|
VGG16 |
Visual Geometry Group 16-layer Convolutional Neural Network |
|
ResNet50 |
Residual Network with 50 Layers |
|
EfficientNetB1 |
EfficientNet-B1 Convolutional Neural Network Architecture |
|
MAE |
Mean Absolute Error |
|
RMSE |
Root Mean Square Error |
|
MAPE |
Mean Absolute Percentage Error |
|
MSE |
Mean Squared Error |
|
R² |
Coefficient of Determination |
|
RGB |
Red-Green-Blue Color Representation |
|
L2 |
L2 Regularization (Weight Decay) |
|
Adam |
Adaptive Moment Estimation Optimizer |
|
ImageNet |
Large-Scale Visual Database Used for Pre-Training |
|
NRC |
National Research Center Dataset Location |
|
RS_Roemani |
Roemani Hospital Dataset Location |
|
GKB2 |
GKB2 Distribution Facility Dataset Location |
|
e |
Surface emissivity used during thermal image acquisition (0.95) |
|
${{y}_{i}}$ |
Actual THD value |
|
${{\overset{}{\mathop{y}}\,}_{i}}$ |
Predicted THD value |
|
$\bar{y}$ |
Mean of actual THD values |
|
n |
Number of samples |
[1] Salem, W.A.A., Gabr Ibrahim, W., Abdelsadek, A.M., Nafeh, A.A. (2022). Grid connected photovoltaic system impression on power quality of low voltage distribution system. Cogent Engineering, 9(1): 2044576. https://doi.org/10.1080/23311916.2022.2044576
[2] Manoj, V., Khampariya, P., Pilla, R. (2022). A review on techniques for improving power quality: Research gaps and emerging trends. Bulletin of Electrical Engineering and Informatics, 11(6): 3099-3107. https://doi.org/10.11591/eei.v11i6.4396
[3] Portillo, F., Alcayde, A., García, R.M., Novas, N., Gázquez, J.A., Fernandez-Ros, M. (2024). Estimation of the total current harmonic distortion using an ELF magnetometer. Sensors and Actuators A: Physical, 371: 115255. https://doi.org/10.1016/j.sna.2024.115255
[4] Matas, J., Martin, H., de la Hoz, J., Abusorrah, A., Al-Turki, Y., Alshaeikh, H. (2020). A new THD measurement method with small computational burden using a SOGI-FLL grid monitoring system. IEEE Transactions on Power Electronics, 35(6): 5797-5811. https://doi.org/10.1109/TPEL.2019.2953926
[5] Costa, F.B., Häselbarth, S., Yanchenko, S., Oliveira, A.M., Strunz, K. (2023). Wavelet-based harmonic magnitude measurement in the presence of interharmonics. IEEE Transactions on Power Delivery, 38(3): 2072-2087. https://doi.org/10.1109/TPWRD.2022.3233583
[6] Mauludin, M.S., Khairudin, M., Asnawi, R., Trisnoaji, Y., Prasetyo, S.D., Azizah, S.R., Wiraguna, R.T. (2025). Assessing the technological and financial feasibility of PV-wind hybrid systems for EV charging stations on Indonesian toll roads. International Journal of Sustainable Development & Planning, 20(1): 291-304. https://doi.org/10.18280/ijsdp.200127
[7] Arranz-Gimon, A., Zorita-Lamadrid, A., Morinigo-Sotelo, D., Duque-Perez, O. (2021). A review of total harmonic distortion factors for the measurement of harmonic and interharmonic pollution in modern power systems. Energies, 14(20): 6467. https://doi.org/10.3390/en14206467
[8] Prasetyo, S.D. (2025). Meta-analysis of harmonics and stability challenges in renewable energy-driven sloppy electrolyzers under weak grid conditions. Power Engineering and Engineering Thermophysics, 4(3): 195-208. https://doi.org/10.56578/peet040305
[9] Pălăcean, A.V., Trancă, D.C., Rughiniș, R.V., Rosner, D. (2024). Smart internet of things power meter for industrial and domestic applications. Applied Sciences, 14(17): 7621. https://doi.org/10.3390/app14177621
[10] Eslami, A., Negnevitsky, M., Franklin, E., Lyden, S. (2022). Review of AI applications in harmonic analysis in power systems. Renewable and Sustainable Energy Reviews, 154: 111897. https://doi.org/10.1016/j.rser.2021.111897
[11] Papageorgiou, P., Mylona, D., Stergiou, K., Bouhouras, A.S. (2023). A time-driven deep learning NILM framework based on novel current harmonic distortion images. Sustainability, 15(17): 12957. https://doi.org/10.3390/su151712957
[12] Taghvaie, A., Fernando, T., Zare, F., Kumar, D., Fookes, C. (2025). An online harmonic Estimation technique based on deep learning in distribution networks. IEEE Journal of Emerging and Selected Topics in Power Electronics, 13(3): 3688-3697. https://doi.org/10.1109/JESTPE.2025.3529530
[13] Ferrer, C., Aviñó, O., Vellvehi, M., Jordà, X., Perpiñà, X. (2023). Die-level transient thermal imaging based on Fourier series reconstruction for power industrial electronics. IEEE Transactions on Instrumentation and Measurement, 72: 1-11. https://doi.org/10.1109/TIM.2023.3322477
[14] Shi, J., Zhi, D., Fu, R. (2024). Research on a non-intrusive load recognition algorithm based on high-frequency signal decomposition with improved VI trajectory and background color coding. Mathematics, 12(1): 30. https://doi.org/10.3390/math12010030
[15] Çalışkan, A., İnci, M., Demir, M.H., Eren, B., Tan, A., Büyük, M., Bayındır, K.Ç. (2024). A CNN-based deep learning method for total harmonic distortion estimation in power quality signals. In 2024 15th National Conference on Electrical and Electronics Engineering (ELECO), Bursa, Turkiye, pp. 1-5. https://doi.org/10.1109/ELECO64362.2024.10847252
[16] Ugwuagbo, E., Balogun, A., Ray, B., Anwar, A., Ugwuishiwu, C. (2023). Total harmonics distortion prediction at the point of common coupling of industrial load with the grid using artificial neural network. Energy and AI, 14: 100281. https://doi.org/10.1016/j.egyai.2023.100281
[17] Kuyumani, E.M., Hasan, A.N., Shongwe, T.C. (2024). A combined model of convolutional neural network and bidirectional long short-term memory with attention mechanism for load harmonics forecasting. Energies, 17(11): 2658. https://doi.org/10.3390/en17112658
[18] Abdali, A., Mazlumi, K., Rabiee, A. (2024). Harmonics impact on hotspot temperature increment of distribution transformers: Nonuniform magnetic-thermal approach. International Journal of Electrical Power & Energy Systems, 157: 109826. https://doi.org/10.1016/j.ijepes.2024.109826
[19] Singh, A., Kaswan, K.S. (2023). Intelligent control and multi-level inverter design for power management using deep learning. In 2023 2nd International Conference for Innovation in Technology (INOCON), Bangalore, India, pp. 1-7. https://doi.org/10.1109/INOCON57975.2023.10101005
[20] Hedayatrasa, S., Van Paepegem, W., Kersemans, M. (2023). Diffusion-compensated correlation analysis of frequency-modulated thermal signal for quantitative infrared thermography. Mechanical Systems and Signal Processing, 197: 110373. https://doi.org/10.1016/j.ymssp.2023.110373
[21] Seddik, M.S., Eteiba, M.B., Shazly, J. (2024). Evaluating the harmonic effects on the thermal performance of a power transformer. Energies, 17(19): 4871. https://doi.org/10.3390/en17194871
[22] Selvaraj, T., Rengaraj, R., Venkatakrishnan, G., et al. (2022). Environmental fault diagnosis of solar panels using solar thermal images in multiple convolutional neural networks. International Transactions on Electrical Energy Systems, 2022(1): 2872925. https://doi.org/10.1155/2022/2872925
[23] Phungket, C., Nangthin, P. (2024). Deep convolutional neural networks for accurate solar module classification in thermal images. In 2024 12th International Electrical Engineering Congress (iEECON), Pattaya, Thailand, pp. 1-5. https://doi.org/10.1109/iEECON60677.2024.10537810
[24] Bu, C., Liu, T., Wang, T., Zhang, H., Sfarra, S. (2023). A CNN-architecture-based photovoltaic cell fault classification method using thermographic images. Energies, 16(9): 3749. https://doi.org/10.3390/en16093749
[25] Haidari, P., Hajiahmad, A., Jafari, A., Nasiri, A. (2022). Deep learning-based model for fault classification in solar modules using infrared images. Sustainable Energy Technologies and Assessments, 52: 102110. https://doi.org/10.1016/j.seta.2022.102110
[26] Cipriani, G., D’Amico, A., Guarino, S., Manno, D., Traverso, M., Di Dio, V. (2020). Convolutional neural network for dust and hotspot classification in PV modules. Energies, 13(23): 6357. https://doi.org/10.3390/en13236357
[27] Qureshi, U.R., Rashid, A., Altini, N., Bevilacqua, V., La Scala, M. (2024). Radiometric infrared thermography of solar photovoltaic systems: An explainable predictive maintenance approach for remote aerial diagnostic monitoring. Smart Cities, 7(3): 1261-1288. https://doi.org/10.3390/smartcities7030053
[28] Tang, R., Ren, Z., Ning, S., Zhang, Y. (2024). Fault classification of photovoltaic module infrared images based on transfer learning and interpretable convolutional neural network. Solar Energy, 276: 112703. https://doi.org/10.1016/j.solener.2024.112703
[29] Panoiu, M., Panoiu, C., Mezinescu, S., Militaru, G., Baciu, I. (2023). Machine learning techniques applied to the harmonic analysis of railway power supply. Mathematics, 11(6): 1381. https://doi.org/10.3390/math11061381
[30] Salles, R.S., Ribeiro, P.F. (2023). The use of deep learning and 2-D wavelet scalograms for power quality disturbances classification. Electric Power Systems Research, 214: 108834. https://doi.org/10.1016/j.epsr.2022.108834
[31] Elgohary, A.A., Badr, M.M., Elmalhy, N.A., Hamdy, R.A., Ahmed, S., Mordi, A.A. (2024). Transfer of learning in convolutional neural networks for thermal image classification in Electrical Transformer Rooms. Alexandria Engineering Journal, 105: 423-436. https://doi.org/10.1016/j.aej.2024.07.077
[32] Elmessery, W.M., Habib, A., Shams, M.Y., et al. (2024). Deep regression analysis for enhanced thermal control in photovoltaic energy systems. Scientific Reports, 14(1): 30600. https://doi.org/10.1038/s41598-024-81101-x
[33] Taspinar, Y.S. (2023). Light weight convolutional neural network and low-dimensional images transformation approach for classification of thermal images. Case Studies in Thermal Engineering, 41: 102670. https://doi.org/10.1016/j.csite.2022.102670
[34] Fakir, K., Ennawaoui, C., El Mouden, M. (2022). Deep learning algorithms to predict output electrical power of an industrial steam turbine. Applied System Innovation, 5(6): 123. https://doi.org/10.3390/asi5060123
[35] Kuang, R., Du, B., Lund, P.D., Wang, J. (2023). Improving performance prediction of evacuated tube solar collector through convolutional neural network method. Thermal Science and Engineering Progress, 39: 101717. https://doi.org/10.1016/j.tsep.2023.101717
[36] Maleki, N., Lundström, O., Musaddiq, A., Jeansson, J., Olsson, T., Ahlgren, F. (2024). Future energy insights: Time-series and deep learning models for city load forecasting. Applied Energy, 374: 124067. https://doi.org/10.1016/j.apenergy.2024.124067
[37] Shekhar, H., Bhushan Mahato, C., Suman, S.K., et al. (2023). Demand side control for energy saving in renewable energy resources using deep learning optimization. Electric Power Components and Systems, 51(19): 2397-2413. https://doi.org/10.1080/15325008.2023.2246463
[38] Bu, C., Li, R., Liu, T., Shen, R., Wang, J., Tang, Q. (2022). Micro-crack defects detection of semiconductor Si-wafers based on Barker code laser infrared thermography. Infrared Physics & Technology, 123: 104160. https://doi.org/10.1016/j.infrared.2022.104160
[39] Mauludin, M.S., Khairudin, M., Asnawi, R. (2025). Optimization of a hybrid PV-Wind power system for enhancing efficiency and power quality using MATLAB/SIMULINK simulations. Journal Européen des Systèmes Automatisés, 58(4): 823-832. https://doi.org/10.18280/jesa.580416
[40] Kim, J.S., Choi, K.N., Kang, S.W. (2021). Infrared thermal image-based sustainable fault detection for electrical facilities. Sustainability, 13(2): 557. https://doi.org/10.3390/su13020557
[41] Balabantaraya, R., Sahoo, A.K., Sahoo, P.K., Abir, C.M., Panda, M.K. (2024). A novel infrared thermography image analysis for transformer condition monitoring. e-Prime-Advances in Electrical Engineering, Electronics and Energy, 10: 100758. https://doi.org/10.1016/j.prime.2024.100758
[42] Ayan, O., Turkay, B.E. (2022). A comparative study on harmonic analysis and thermal performance of different types of lamps for residential building. Energy Reports, 8: 932-945. https://doi.org/10.1016/j.egyr.2022.05.271
[43] Hu, T., Wen, L., Li, H., et al. (2024). Aberration-corrected hybrid metalens for longwave infrared thermal imaging. Nanophotonics, 13(17): 3059-3066. https://doi.org/10.1515/nanoph-2023-0918
[44] Liu, G., Gao, W., Liu, W., Xu, J., Li, R., Bai, W. (2024). LFM-Chirp-Square pulse-compression thermography for debonding defects detection in honeycomb sandwich composites based on THD-processing technique. Nondestructive Testing and Evaluation, 39(4): 832-845. https://doi.org/10.1080/10589759.2023.2230341
[45] Moussaoui, H., Hammerschmid, G., Subotić, V. (2023). Fast online diagnosis for solid oxide fuel cells: Optimisation of total harmonic distortion tool for real-system application and reactants starvation identification. Journal of Power Sources, 556: 232352. https://doi.org/10.1016/j.jpowsour.2022.232352
[46] Hosamo, H., Mazzetto, S. (2025). Performance evaluation of machine learning models for predicting energy consumption and occupant dissatisfaction in buildings. Buildings, 15(1): 39. https://doi.org/10.3390/buildings15010039
[47] Al Mamun, A., Sohel, M., Mohammad, N., Sunny, M.S.H., Dipta, D.R., Hossain, E. (2020). A comprehensive review of the load forecasting techniques using single and hybrid predictive models. IEEE Access, 8: 134911-134939. https://doi.org/10.1109/ACCESS.2020.3010702
[48] Khan, Z.A., Ullah, A., Ullah, W., Rho, S., Lee, M., Baik, S.W. (2020). Electrical energy prediction in residential buildings for short-term horizons using hybrid deep learning strategy. Applied Sciences, 10(23): 8634. https://doi.org/10.3390/app10238634
[49] Boutahri, Y., Tilioua, A. (2024). Machine learning-based predictive model for thermal comfort and energy optimization in smart buildings. Results in Engineering, 22: 102148. https://doi.org/10.1016/j.rineng.2024.102148
[50] Sekeroglu, B., Ever, Y.K., Dimililer, K., Al-Turjman, F. (2022). Comparative evaluation and comprehensive analysis of machine learning models for regression problems. Data Intelligence, 4(3): 620-652. https://doi.org/10.1162/dint_a_00155
[51] Wilson, A.N., Gupta, K.A., Koduru, B.H., Kumar, A., Jha, A., Cenkeramaddi, L.R. (2023). Recent advances in thermal imaging and its applications using machine learning: A review. IEEE Sensors Journal, 23(4): 3395-3407. https://doi.org/10.1109/JSEN.2023.3234335
[52] Carneiro, D., Guimaraes, M., Carvalho, M., Novais, P. (2023). Using meta-learning to predict performance metrics in machine learning problems. Expert Systems, 40(1): e12900. https://doi.org/10.1111/exsy.12900
[53] Yousif, J.H., Kazem, H.A. (2021). Prediction and evaluation of photovoltaic-thermal energy systems production using artificial neural network and experimental dataset. Case Studies in Thermal Engineering, 27: 101297. https://doi.org/10.1016/j.csite.2021.101297